
|
|||||
|
 | |
| |
| |
| |
| |
| |
|
Gene: ACER3 |
Gene summary for ACER3 |
| Gene information | Species | Human | Gene symbol | ACER3 | Gene ID | 55331 |
| Gene name | alkaline ceramidase 3 | |
| Gene Alias | APHC | |
| Cytomap | 11q13.5 | |
| Gene Type | protein-coding | GO ID | GO:0006066 | UniProtAcc | B7Z2Q2 |
Top |
Malignant transformation analysis |
| Identification of the aberrant gene expression in precancerous and cancerous lesions by comparing the gene expression of stem-like cells in diseased tissues with normal stem cells |
| Entrez ID | Symbol | Replicates | Species | Organ | Tissue | Adj P-value | Log2FC | Malignancy |
| 55331 | ACER3 | HTA11_3410_2000001011 | Human | Colorectum | AD | 4.90e-10 | -4.42e-01 | 0.0155 |
| 55331 | ACER3 | HTA11_347_2000001011 | Human | Colorectum | AD | 6.39e-06 | 5.00e-01 | -0.1954 |
| 55331 | ACER3 | HTA11_866_3004761011 | Human | Colorectum | AD | 4.47e-02 | -3.59e-01 | 0.096 |
| 55331 | ACER3 | HTA11_10711_2000001011 | Human | Colorectum | AD | 5.90e-03 | -3.78e-01 | 0.0338 |
| 55331 | ACER3 | HTA11_7696_3000711011 | Human | Colorectum | AD | 2.33e-11 | -3.79e-01 | 0.0674 |
| 55331 | ACER3 | HTA11_99999970781_79442 | Human | Colorectum | MSS | 4.20e-08 | -2.74e-01 | 0.294 |
| 55331 | ACER3 | HTA11_99999971662_82457 | Human | Colorectum | MSS | 2.39e-08 | -2.68e-01 | 0.3859 |
| 55331 | ACER3 | HTA11_99999974143_84620 | Human | Colorectum | MSS | 1.30e-12 | -4.17e-01 | 0.3005 |
| 55331 | ACER3 | A002-C-010 | Human | Colorectum | FAP | 4.33e-02 | -1.81e-01 | 0.242 |
| 55331 | ACER3 | A015-C-203 | Human | Colorectum | FAP | 2.87e-22 | -3.70e-01 | -0.1294 |
| 55331 | ACER3 | A015-C-204 | Human | Colorectum | FAP | 2.60e-04 | -3.43e-01 | -0.0228 |
| 55331 | ACER3 | A014-C-040 | Human | Colorectum | FAP | 4.00e-02 | -4.32e-01 | -0.1184 |
| 55331 | ACER3 | A002-C-201 | Human | Colorectum | FAP | 8.26e-14 | -4.38e-01 | 0.0324 |
| 55331 | ACER3 | A002-C-203 | Human | Colorectum | FAP | 1.56e-02 | -1.38e-01 | 0.2786 |
| 55331 | ACER3 | A001-C-119 | Human | Colorectum | FAP | 5.92e-06 | -4.75e-01 | -0.1557 |
| 55331 | ACER3 | A001-C-108 | Human | Colorectum | FAP | 3.47e-18 | -3.92e-01 | -0.0272 |
| 55331 | ACER3 | A002-C-021 | Human | Colorectum | FAP | 1.82e-02 | -1.66e-01 | 0.1171 |
| 55331 | ACER3 | A002-C-205 | Human | Colorectum | FAP | 4.55e-15 | -4.38e-01 | -0.1236 |
| 55331 | ACER3 | A001-C-104 | Human | Colorectum | FAP | 2.08e-09 | -3.32e-01 | 0.0184 |
| 55331 | ACER3 | A015-C-005 | Human | Colorectum | FAP | 1.19e-03 | -2.82e-01 | -0.0336 |
| Page: 1 2 3 4 5 6 7 |
| Tissue | Expression Dynamics | Abbreviation |
| Colorectum (GSE201348) |  | FAP: Familial adenomatous polyposis |
| CRC: Colorectal cancer | ||
| Colorectum (HTA11) | 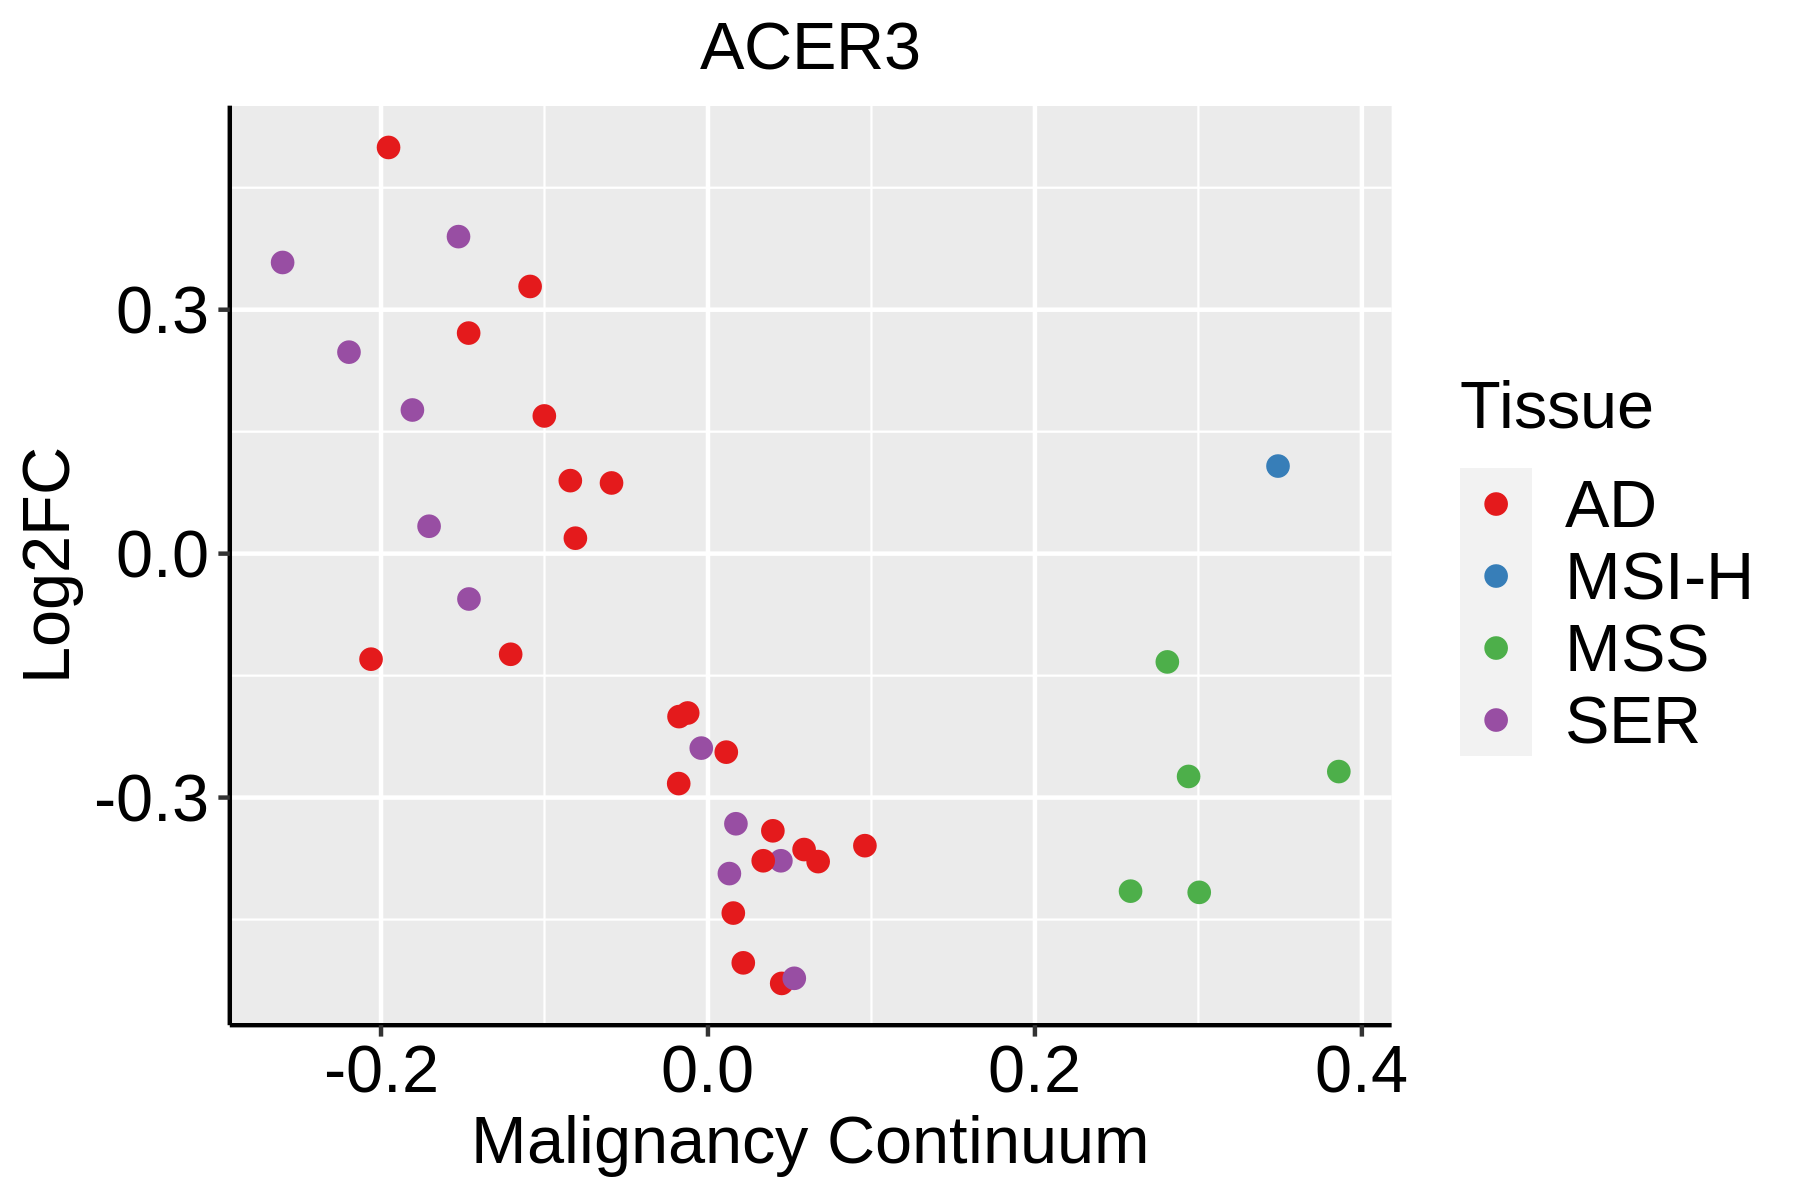 | AD: Adenomas |
| SER: Sessile serrated lesions | ||
| MSI-H: Microsatellite-high colorectal cancer | ||
| MSS: Microsatellite stable colorectal cancer | ||
| Esophagus | 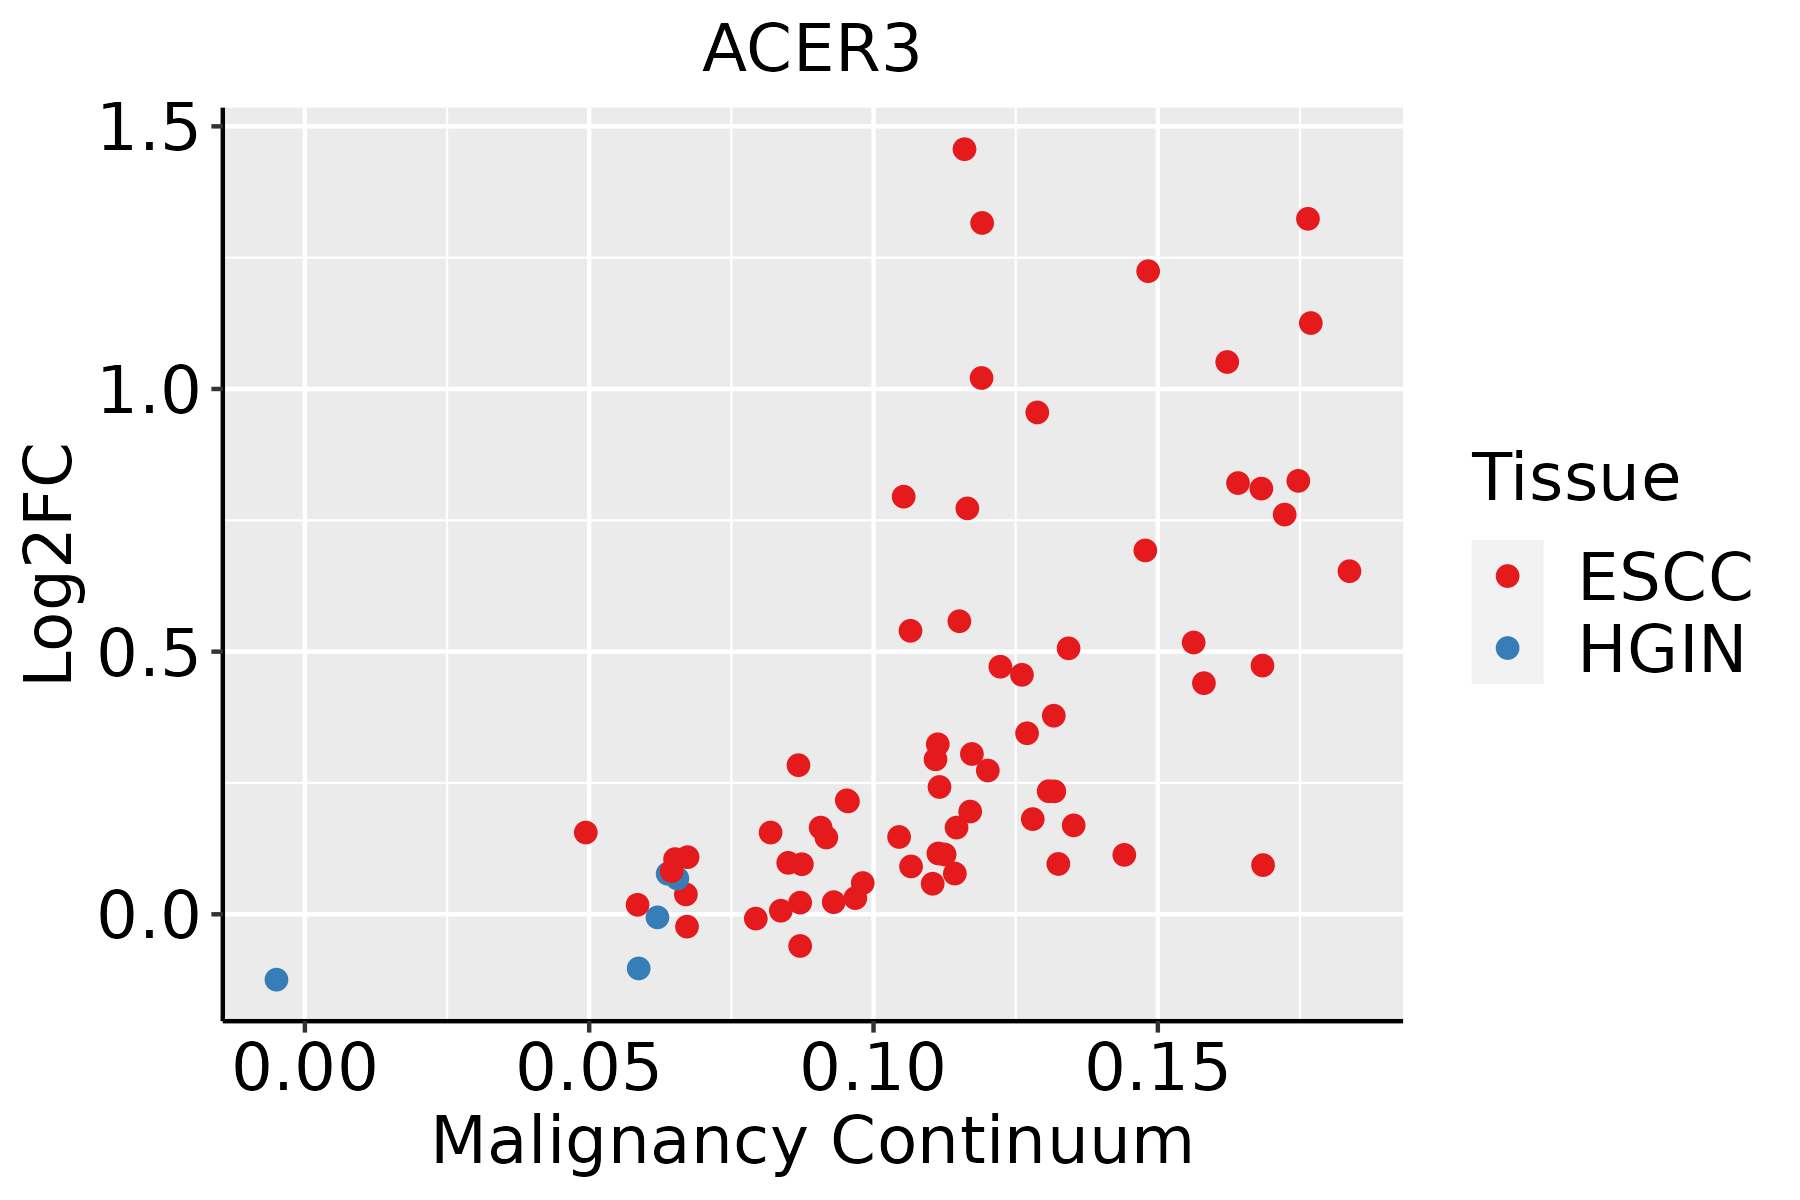 | ESCC: Esophageal squamous cell carcinoma |
| HGIN: High-grade intraepithelial neoplasias | ||
| LGIN: Low-grade intraepithelial neoplasias | ||
| Liver |  | HCC: Hepatocellular carcinoma |
| NAFLD: Non-alcoholic fatty liver disease | ||
| Oral Cavity |  | EOLP: Erosive Oral lichen planus |
| LP: leukoplakia | ||
| NEOLP: Non-erosive oral lichen planus | ||
| OSCC: Oral squamous cell carcinoma | ||
| Skin | 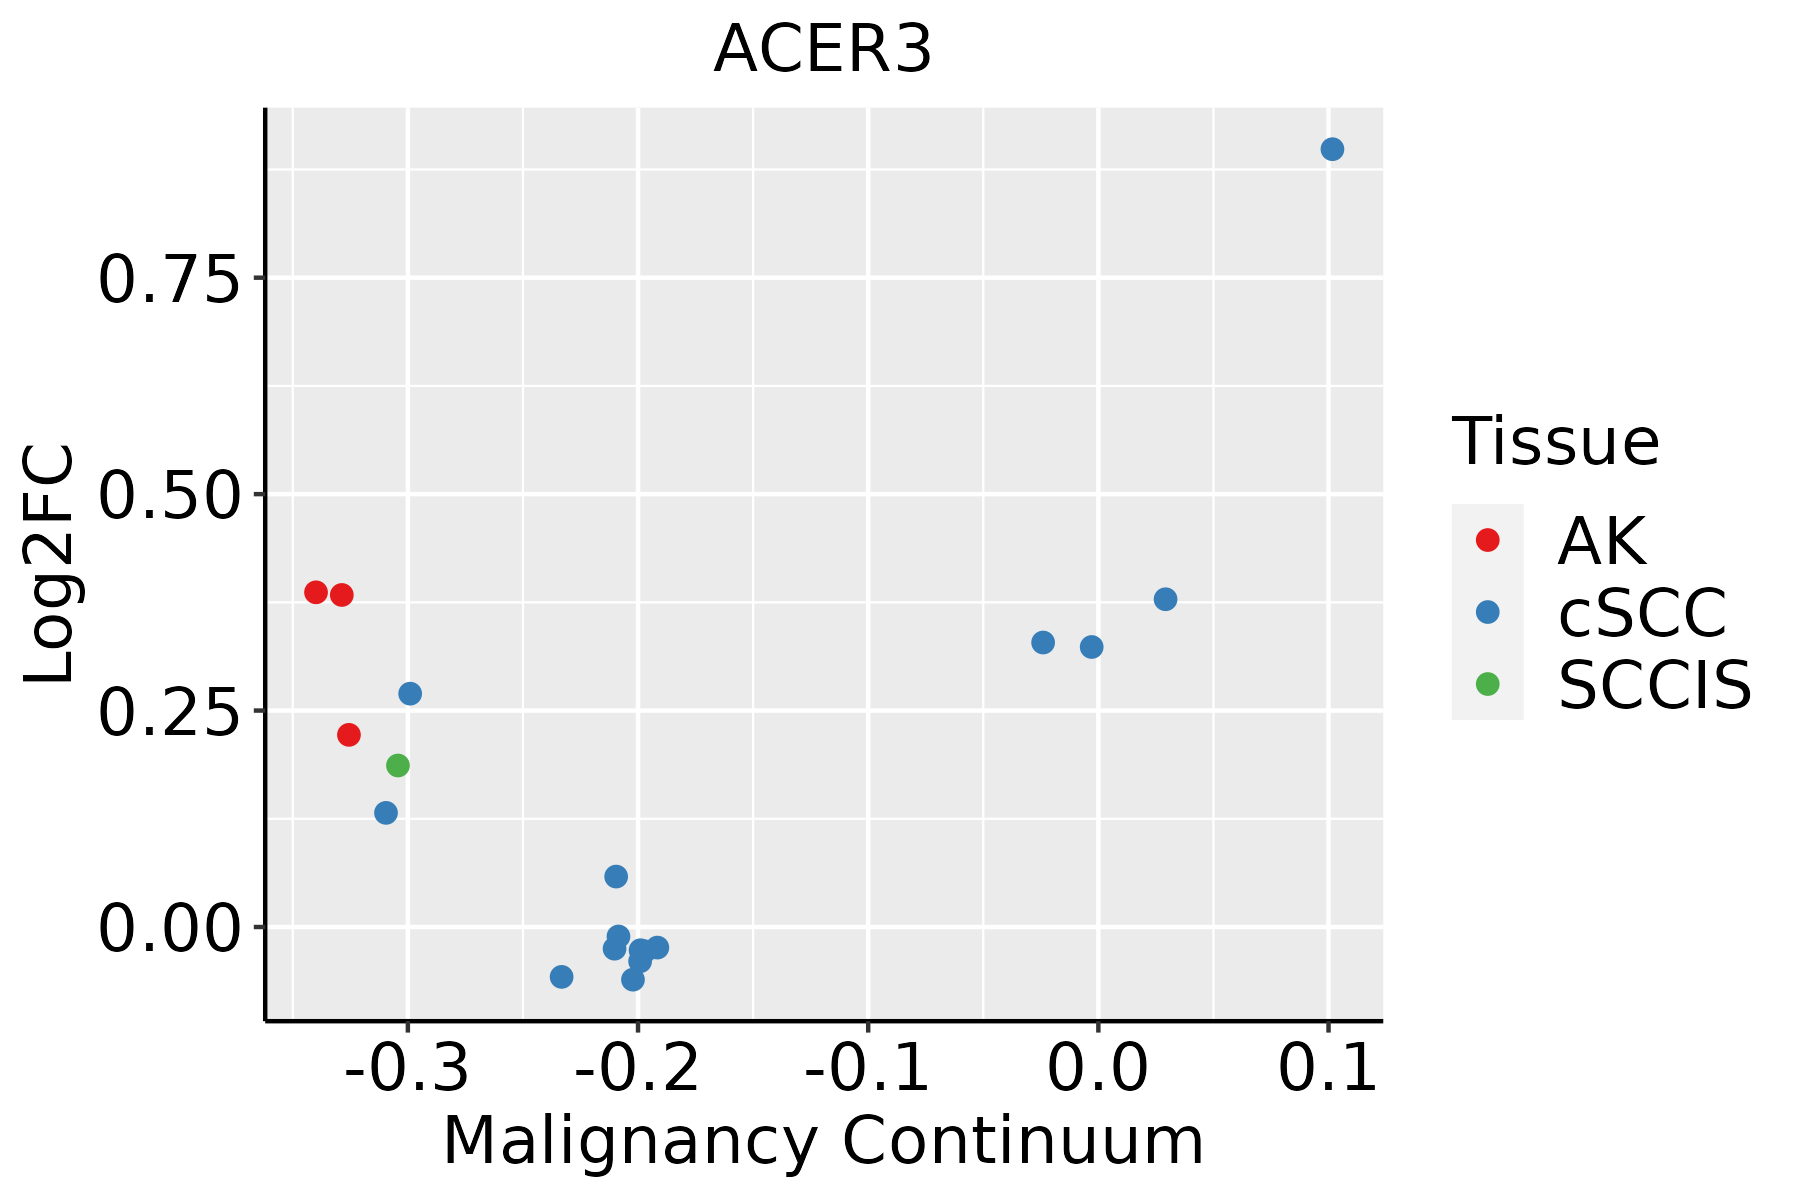 | AK: Actinic keratosis |
| cSCC: Cutaneous squamous cell carcinoma | ||
| SCCIS:squamous cell carcinoma in situ | ||
| Thyroid | 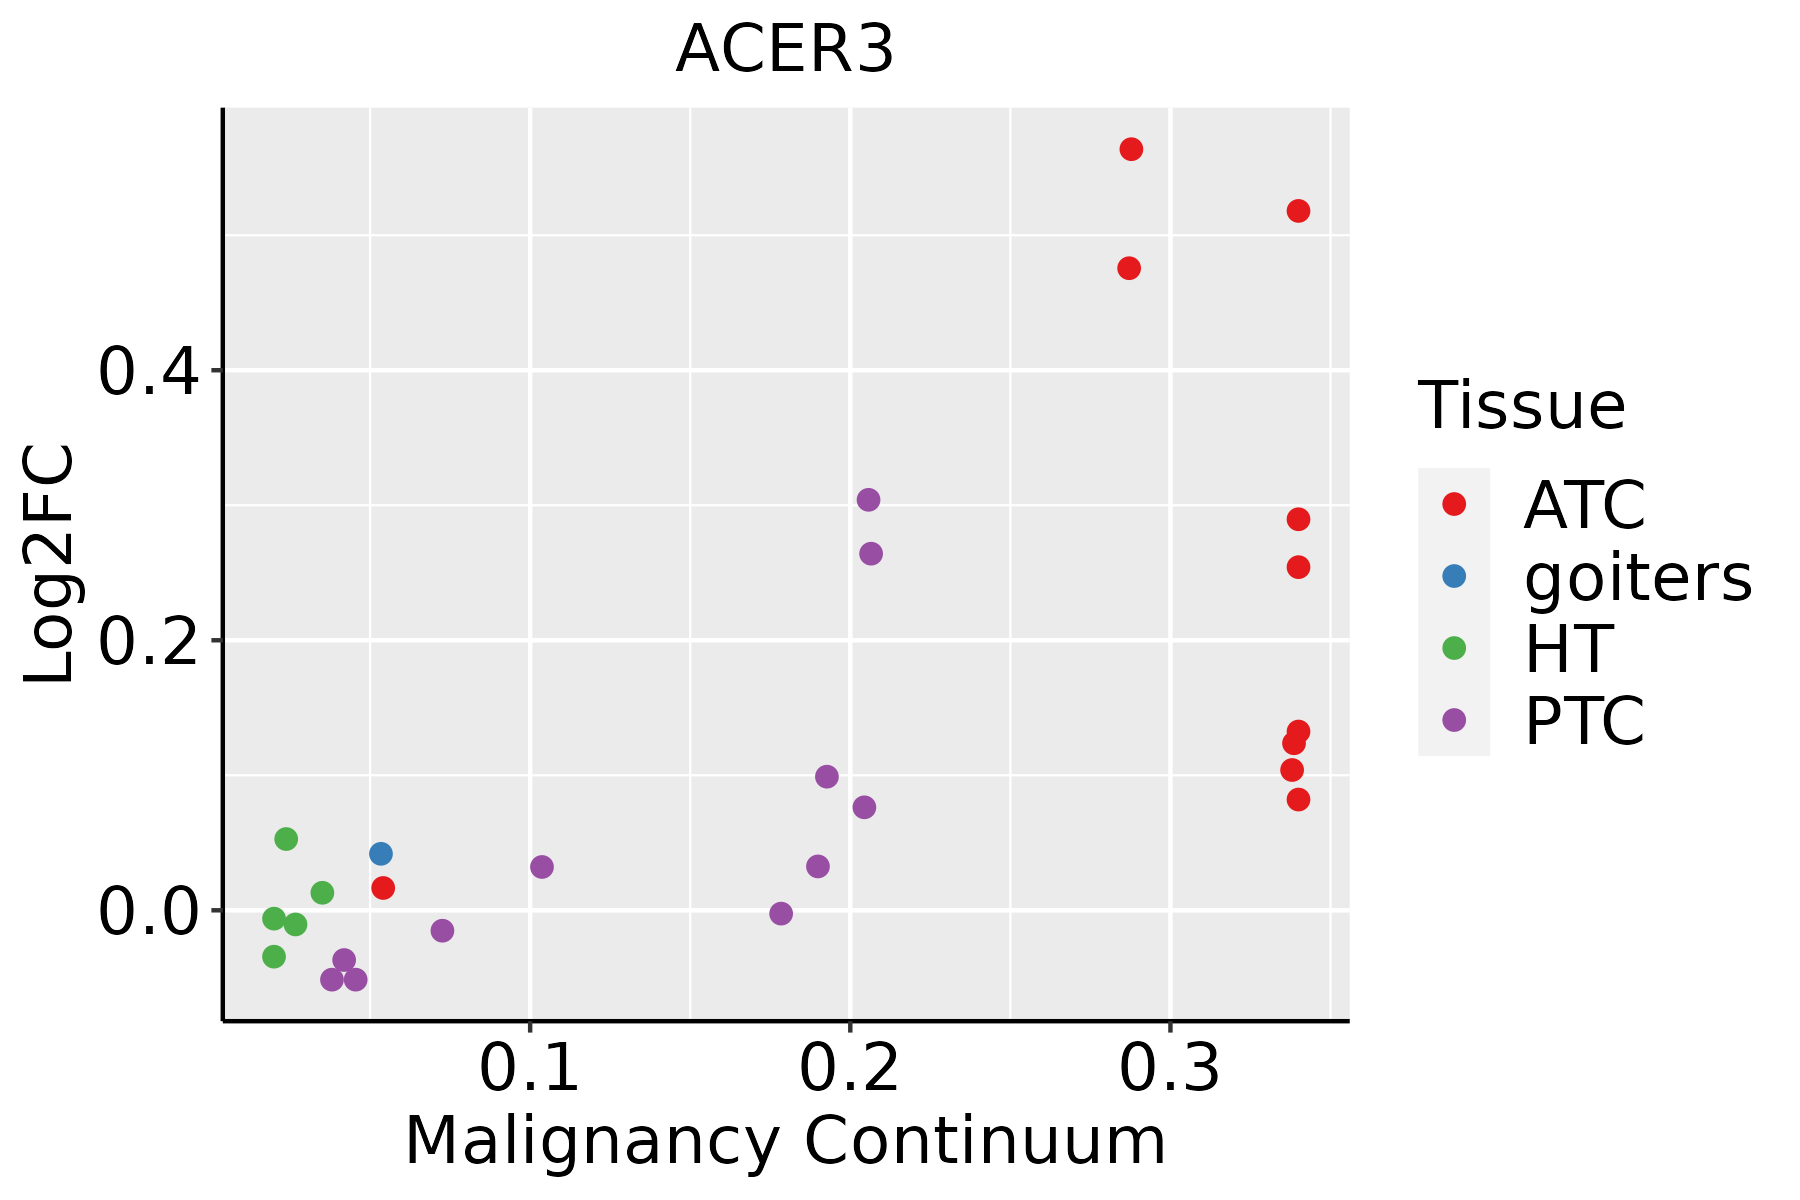 | ATC: Anaplastic thyroid cancer |
| HT: Hashimoto's thyroiditis | ||
| PTC: Papillary thyroid cancer |
| ∗log2FC in expression of this searched gene in stem-like cells from each diseased tissue sample relative to stem-like cells in normal samples in each tissue plotted against the malignancy continuum. Samples are colored based on if they are from different disease stage. |
Top |
Malignant transformation related pathway analysis |
| Find out the enriched GO biological processes and KEGG pathways involved in transition from healthy to precancer to cancer |
| Tissue | Disease Stage | Enriched GO biological Processes |
| Colorectum | AD |  |
| Colorectum | SER |  |
| Colorectum | MSS |  |
| Colorectum | MSI-H |  |
| Colorectum | FAP |  |
| ∗Top 15 enriched GO BP terms are showed in the bar plot of each disease state in each tissue. Each row represents a significant GO biological process which is colored according to the -log10(p.adjust). |
| Page: 1 2 3 4 5 6 7 8 9 |
| GO ID | Tissue | Disease Stage | Description | Gene Ratio | Bg Ratio | pvalue | p.adjust | Count |
| GO:0006066 | Colorectum | AD | alcohol metabolic process | 106/3918 | 353/18723 | 3.02e-05 | 5.57e-04 | 106 |
| GO:0016042 | Colorectum | AD | lipid catabolic process | 97/3918 | 320/18723 | 4.31e-05 | 7.56e-04 | 97 |
| GO:0044242 | Colorectum | AD | cellular lipid catabolic process | 66/3918 | 214/18723 | 3.96e-04 | 4.50e-03 | 66 |
| GO:00060662 | Colorectum | MSS | alcohol metabolic process | 92/3467 | 353/18723 | 2.57e-04 | 3.46e-03 | 92 |
| GO:00160422 | Colorectum | MSS | lipid catabolic process | 77/3467 | 320/18723 | 7.43e-03 | 4.71e-02 | 77 |
| GO:00442422 | Colorectum | FAP | cellular lipid catabolic process | 49/2622 | 214/18723 | 2.87e-04 | 3.77e-03 | 49 |
| GO:00160423 | Colorectum | FAP | lipid catabolic process | 65/2622 | 320/18723 | 1.13e-03 | 1.08e-02 | 65 |
| GO:00060663 | Colorectum | FAP | alcohol metabolic process | 69/2622 | 353/18723 | 2.29e-03 | 1.85e-02 | 69 |
| GO:0046519 | Colorectum | FAP | sphingoid metabolic process | 8/2622 | 21/18723 | 5.43e-03 | 3.53e-02 | 8 |
| GO:00160424 | Colorectum | CRC | lipid catabolic process | 53/2078 | 320/18723 | 1.89e-03 | 1.93e-02 | 53 |
| GO:00060664 | Colorectum | CRC | alcohol metabolic process | 57/2078 | 353/18723 | 2.37e-03 | 2.27e-02 | 57 |
| GO:00442423 | Colorectum | CRC | cellular lipid catabolic process | 37/2078 | 214/18723 | 4.16e-03 | 3.40e-02 | 37 |
| GO:00465191 | Colorectum | CRC | sphingoid metabolic process | 7/2078 | 21/18723 | 5.85e-03 | 4.32e-02 | 7 |
| GO:0019751 | Colorectum | CRC | polyol metabolic process | 22/2078 | 114/18723 | 6.73e-03 | 4.77e-02 | 22 |
| GO:00066433 | Esophagus | ESCC | membrane lipid metabolic process | 130/8552 | 203/18723 | 9.29e-08 | 1.54e-06 | 130 |
| GO:00464673 | Esophagus | ESCC | membrane lipid biosynthetic process | 91/8552 | 142/18723 | 7.19e-06 | 7.19e-05 | 91 |
| GO:00060668 | Esophagus | ESCC | alcohol metabolic process | 202/8552 | 353/18723 | 7.32e-06 | 7.26e-05 | 202 |
| GO:00425524 | Esophagus | ESCC | myelination | 85/8552 | 134/18723 | 2.51e-05 | 2.13e-04 | 85 |
| GO:00072724 | Esophagus | ESCC | ensheathment of neurons | 86/8552 | 136/18723 | 2.68e-05 | 2.24e-04 | 86 |
| GO:00083664 | Esophagus | ESCC | axon ensheathment | 86/8552 | 136/18723 | 2.68e-05 | 2.24e-04 | 86 |
| Page: 1 2 3 4 |
| Pathway ID | Tissue | Disease Stage | Description | Gene Ratio | Bg Ratio | pvalue | p.adjust | qvalue | Count |
| hsa006003 | Esophagus | ESCC | Sphingolipid metabolism | 36/4205 | 53/8465 | 5.41e-03 | 1.36e-02 | 6.99e-03 | 36 |
| hsa0060012 | Esophagus | ESCC | Sphingolipid metabolism | 36/4205 | 53/8465 | 5.41e-03 | 1.36e-02 | 6.99e-03 | 36 |
| Page: 1 |
Top |
Cell-cell communication analysis |
| Identification of potential cell-cell interactions between two cell types and their ligand-receptor pairs for different disease states |
| Ligand | Receptor | LRpair | Pathway | Tissue | Disease Stage |
| Page: 1 |
Top |
Single-cell gene regulatory network inference analysis |
| Find out the significant the regulons (TFs) and the target genes of each regulon across cell types for different disease states |
| TF | Cell Type | Tissue | Disease Stage | Target Gene | RSS | Regulon Activity |
| ∗The dot plots of a searched regulon are shown for all cell subpopulations in each disease state of each tissue based on the regulon specific score inferred using pySCENIC and by calculating the average expression. |
| Page: 1 |
Top |
Somatic mutation of malignant transformation related genes |
| Annotation of somatic variants for genes involved in malignant transformation |
| Hugo Symbol | Variant Class | Variant Classification | dbSNP RS | HGVSc | HGVSp | HGVSp Short | SWISSPROT | BIOTYPE | SIFT | PolyPhen | Tumor Sample Barcode | Tissue | Histology | Sex | Age | Stage | Therapy Types | Drugs | Outcome |
| ACER3 | SNV | Missense_Mutation | c.599N>C | p.Arg200Thr | p.R200T | Q9NUN7 | protein_coding | tolerated(0.08) | possibly_damaging(0.556) | TCGA-A2-A04W-01 | Breast | breast invasive carcinoma | Female | <65 | I/II | Chemotherapy | cytoxan | SD | |
| ACER3 | SNV | Missense_Mutation | novel | c.421G>C | p.Glu141Gln | p.E141Q | Q9NUN7 | protein_coding | tolerated(0.36) | benign(0.018) | TCGA-AN-A0XW-01 | Breast | breast invasive carcinoma | Female | <65 | III/IV | Unknown | Unknown | SD |
| ACER3 | SNV | Missense_Mutation | c.55N>T | p.Asp19Tyr | p.D19Y | Q9NUN7 | protein_coding | deleterious(0) | probably_damaging(0.964) | TCGA-BH-A18Q-01 | Breast | breast invasive carcinoma | Female | <65 | I/II | Unknown | Unknown | SD | |
| ACER3 | SNV | Missense_Mutation | c.336G>T | p.Lys112Asn | p.K112N | Q9NUN7 | protein_coding | deleterious(0.02) | probably_damaging(0.917) | TCGA-C8-A138-01 | Breast | breast invasive carcinoma | Female | <65 | III/IV | Unknown | Unknown | SD | |
| ACER3 | SNV | Missense_Mutation | c.476N>T | p.Arg159Leu | p.R159L | Q9NUN7 | protein_coding | tolerated(0.21) | benign(0.048) | TCGA-AA-3713-01 | Colorectum | colon adenocarcinoma | Male | >=65 | III/IV | Chemotherapy | 5-fluorouracil | PR | |
| ACER3 | SNV | Missense_Mutation | rs756951583 | c.172N>A | p.Gly58Ser | p.G58S | Q9NUN7 | protein_coding | deleterious(0.04) | possibly_damaging(0.591) | TCGA-D5-6540-01 | Colorectum | colon adenocarcinoma | Male | >=65 | I/II | Unknown | Unknown | SD |
| ACER3 | SNV | Missense_Mutation | c.788N>G | p.Pro263Arg | p.P263R | Q9NUN7 | protein_coding | deleterious_low_confidence(0) | benign(0.001) | TCGA-G4-6294-01 | Colorectum | colon adenocarcinoma | Male | >=65 | III/IV | Chemotherapy | fluorouracil | PD | |
| ACER3 | SNV | Missense_Mutation | novel | c.407A>G | p.Tyr136Cys | p.Y136C | Q9NUN7 | protein_coding | deleterious(0) | probably_damaging(1) | TCGA-EI-6917-01 | Colorectum | rectum adenocarcinoma | Male | <65 | III/IV | Chemotherapy | 5fluorouracil+oxaciplatina+l-folinian | SD |
| ACER3 | SNV | Missense_Mutation | novel | c.342G>T | p.Lys114Asn | p.K114N | Q9NUN7 | protein_coding | deleterious(0.04) | benign(0.412) | TCGA-AJ-A5DW-01 | Endometrium | uterine corpus endometrioid carcinoma | Female | <65 | I/II | Unknown | Unknown | SD |
| ACER3 | SNV | Missense_Mutation | novel | c.709N>C | p.Tyr237His | p.Y237H | Q9NUN7 | protein_coding | tolerated(0.2) | benign(0.015) | TCGA-AP-A05O-01 | Endometrium | uterine corpus endometrioid carcinoma | Female | >=65 | I/II | Chemotherapy | carboplatin | PD |
| Page: 1 2 3 |
Top |
Related drugs of malignant transformation related genes |
| Identification of chemicals and drugs interact with genes involved in malignant transfromation |
| (DGIdb 4.0) |
| Entrez ID | Symbol | Category | Interaction Types | Drug Claim Name | Drug Name | PMIDs |
| Page: 1 |

Copyright 2023-Present -The University of Texas Health Science Center at Houston |