
|
|||||
|
 | |
| |
| |
| |
| |
| |
|
Gene: ACER2 |
Gene summary for ACER2 |
| Gene information | Species | Human | Gene symbol | ACER2 | Gene ID | 340485 |
| Gene name | alkaline ceramidase 2 | |
| Gene Alias | ALKCDase2 | |
| Cytomap | 9p22.1 | |
| Gene Type | protein-coding | GO ID | GO:0001952 | UniProtAcc | B3KVV5 |
Top |
Malignant transformation analysis |
| Identification of the aberrant gene expression in precancerous and cancerous lesions by comparing the gene expression of stem-like cells in diseased tissues with normal stem cells |
| Entrez ID | Symbol | Replicates | Species | Organ | Tissue | Adj P-value | Log2FC | Malignancy |
| 340485 | ACER2 | Pat01-B | Human | Stomach | GC | 2.99e-02 | 1.11e-01 | 0.5754 |
| 340485 | ACER2 | Pat02-B | Human | Stomach | GC | 4.27e-06 | 1.68e-01 | 0.0368 |
| 340485 | ACER2 | Pat03-B | Human | Stomach | GC | 1.08e-04 | 1.51e-01 | 0.3693 |
| 340485 | ACER2 | Pat04-B | Human | Stomach | GC | 1.45e-22 | 4.85e-01 | -0.1483 |
| 340485 | ACER2 | Pat05-B | Human | Stomach | GC | 8.40e-08 | 2.97e-01 | -0.0353 |
| 340485 | ACER2 | Pat06-B | Human | Stomach | GC | 4.68e-24 | 4.16e-01 | -0.1961 |
| 340485 | ACER2 | Pat08-B | Human | Stomach | GC | 3.44e-03 | 2.18e-01 | 0.0182 |
| 340485 | ACER2 | Pat10-B | Human | Stomach | GC | 2.54e-05 | 3.43e-01 | 0.084 |
| 340485 | ACER2 | Pat11-B | Human | Stomach | GC | 3.11e-20 | 5.55e-01 | -0.182 |
| 340485 | ACER2 | Pat12-B | Human | Stomach | GC | 1.84e-03 | 1.39e-01 | 0.0325 |
| 340485 | ACER2 | Pat13-B | Human | Stomach | GC | 6.98e-06 | 2.46e-01 | 0.0555 |
| 340485 | ACER2 | Pat15-B | Human | Stomach | GC | 2.49e-11 | 3.21e-01 | -0.0778 |
| 340485 | ACER2 | Pat16-B | Human | Stomach | GC | 1.87e-04 | 2.03e-01 | 0.1918 |
| 340485 | ACER2 | Pat18-B | Human | Stomach | GC | 8.97e-17 | 3.96e-01 | -0.0432 |
| 340485 | ACER2 | Pat19-B | Human | Stomach | GC | 3.48e-04 | 1.78e-01 | 0.0826 |
| 340485 | ACER2 | Pat22-B | Human | Stomach | GC | 5.70e-25 | 4.84e-01 | -0.1042 |
| 340485 | ACER2 | Pat24-B | Human | Stomach | GC | 6.84e-09 | 3.08e-01 | -0.1184 |
| 340485 | ACER2 | Pat25-A | Human | Stomach | CAG with IM | 3.75e-22 | 4.38e-01 | -0.1648 |
| 340485 | ACER2 | Pat26-A | Human | Stomach | CSG | 1.55e-13 | 3.33e-01 | -0.2402 |
| 340485 | ACER2 | Pat28-A | Human | Stomach | CSG | 5.96e-09 | 2.51e-01 | -0.2594 |
| Page: 1 2 |
| Tissue | Expression Dynamics | Abbreviation |
| GC | 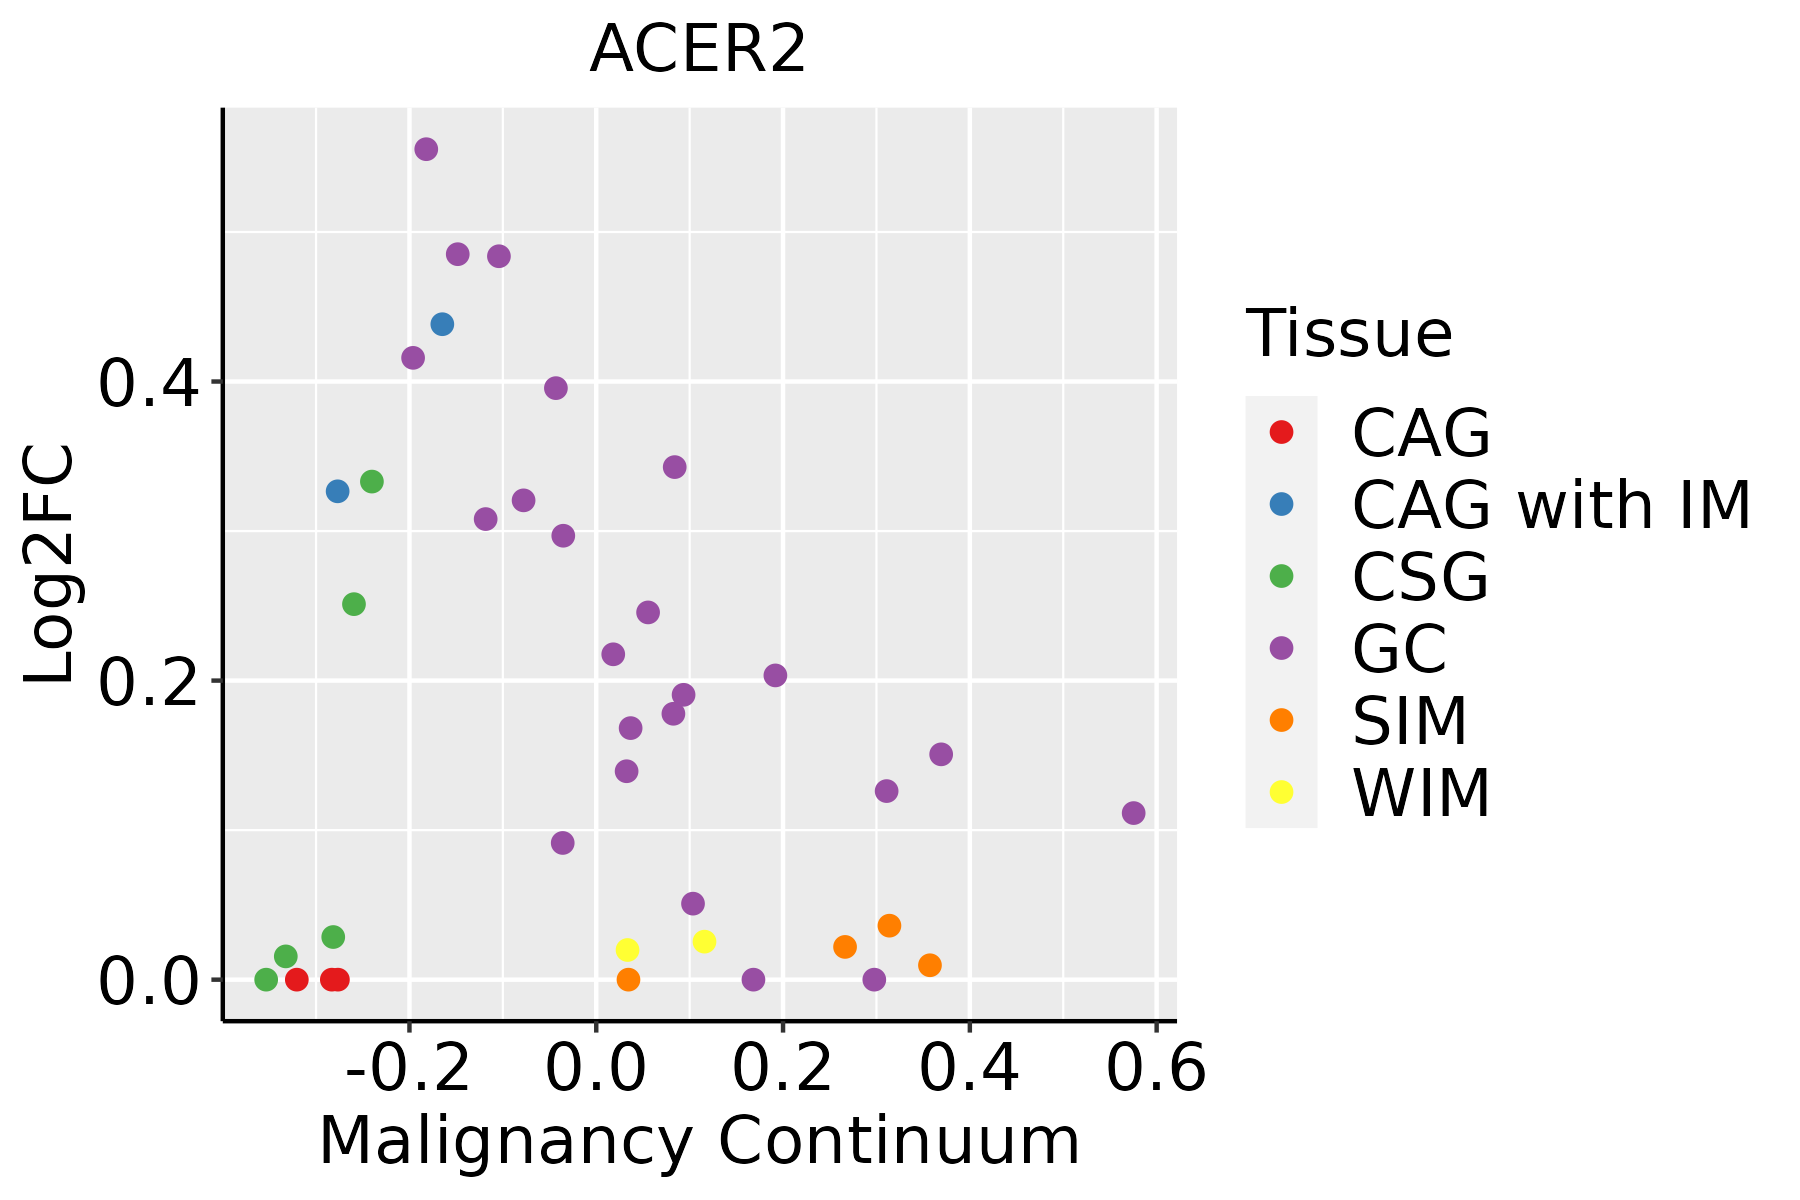 | CAG: Chronic atrophic gastritis |
| CAG with IM: Chronic atrophic gastritis with intestinal metaplasia | ||
| CSG: Chronic superficial gastritis | ||
| GC: Gastric cancer | ||
| SIM: Severe intestinal metaplasia | ||
| WIM: Wild intestinal metaplasia |
| ∗log2FC in expression of this searched gene in stem-like cells from each diseased tissue sample relative to stem-like cells in normal samples in each tissue plotted against the malignancy continuum. Samples are colored based on if they are from different disease stage. |
Top |
Malignant transformation related pathway analysis |
| Find out the enriched GO biological processes and KEGG pathways involved in transition from healthy to precancer to cancer |
| Tissue | Disease Stage | Enriched GO biological Processes |
| Colorectum | AD |  |
| Colorectum | SER |  |
| Colorectum | MSS |  |
| Colorectum | MSI-H |  |
| Colorectum | FAP |  |
| ∗Top 15 enriched GO BP terms are showed in the bar plot of each disease state in each tissue. Each row represents a significant GO biological process which is colored according to the -log10(p.adjust). |
| Page: 1 2 3 4 5 6 7 8 9 |
| GO ID | Tissue | Disease Stage | Description | Gene Ratio | Bg Ratio | pvalue | p.adjust | Count |
| GO:00525476 | Stomach | GC | regulation of peptidase activity | 67/1159 | 461/18723 | 5.35e-11 | 1.10e-08 | 67 |
| GO:00525486 | Stomach | GC | regulation of endopeptidase activity | 63/1159 | 432/18723 | 1.76e-10 | 2.82e-08 | 63 |
| GO:20001166 | Stomach | GC | regulation of cysteine-type endopeptidase activity | 37/1159 | 235/18723 | 1.47e-07 | 8.52e-06 | 37 |
| GO:00442424 | Stomach | GC | cellular lipid catabolic process | 32/1159 | 214/18723 | 3.16e-06 | 1.29e-04 | 32 |
| GO:00432816 | Stomach | GC | regulation of cysteine-type endopeptidase activity involved in apoptotic process | 31/1159 | 209/18723 | 5.31e-06 | 2.11e-04 | 31 |
| GO:00160425 | Stomach | GC | lipid catabolic process | 41/1159 | 320/18723 | 7.84e-06 | 2.80e-04 | 41 |
| GO:00723316 | Stomach | GC | signal transduction by p53 class mediator | 26/1159 | 163/18723 | 7.98e-06 | 2.82e-04 | 26 |
| GO:00458626 | Stomach | GC | positive regulation of proteolysis | 44/1159 | 372/18723 | 2.81e-05 | 7.88e-04 | 44 |
| GO:00060665 | Stomach | GC | alcohol metabolic process | 41/1159 | 353/18723 | 7.85e-05 | 1.68e-03 | 41 |
| GO:00109526 | Stomach | GC | positive regulation of peptidase activity | 27/1159 | 197/18723 | 8.57e-05 | 1.79e-03 | 27 |
| GO:00108106 | Stomach | GC | regulation of cell-substrate adhesion | 28/1159 | 221/18723 | 2.49e-04 | 4.17e-03 | 28 |
| GO:00109506 | Stomach | GC | positive regulation of endopeptidase activity | 24/1159 | 179/18723 | 2.90e-04 | 4.67e-03 | 24 |
| GO:00315895 | Stomach | GC | cell-substrate adhesion | 40/1159 | 363/18723 | 2.91e-04 | 4.68e-03 | 40 |
| GO:00303306 | Stomach | GC | DNA damage response, signal transduction by p53 class mediator | 13/1159 | 72/18723 | 4.25e-04 | 6.35e-03 | 13 |
| GO:20010565 | Stomach | GC | positive regulation of cysteine-type endopeptidase activity | 20/1159 | 148/18723 | 8.11e-04 | 1.02e-02 | 20 |
| GO:00071623 | Stomach | GC | negative regulation of cell adhesion | 32/1159 | 303/18723 | 2.24e-03 | 2.20e-02 | 32 |
| GO:00019525 | Stomach | GC | regulation of cell-matrix adhesion | 17/1159 | 128/18723 | 2.33e-03 | 2.25e-02 | 17 |
| GO:00432805 | Stomach | GC | positive regulation of cysteine-type endopeptidase activity involved in apoptotic process | 17/1159 | 129/18723 | 2.54e-03 | 2.39e-02 | 17 |
| GO:00071605 | Stomach | GC | cell-matrix adhesion | 25/1159 | 233/18723 | 5.24e-03 | 4.11e-02 | 25 |
| GO:005254711 | Stomach | CAG with IM | regulation of peptidase activity | 61/1050 | 461/18723 | 3.60e-10 | 6.00e-08 | 61 |
| Page: 1 2 3 |
| Pathway ID | Tissue | Disease Stage | Description | Gene Ratio | Bg Ratio | pvalue | p.adjust | qvalue | Count |
| Page: 1 |
Top |
Cell-cell communication analysis |
| Identification of potential cell-cell interactions between two cell types and their ligand-receptor pairs for different disease states |
| Ligand | Receptor | LRpair | Pathway | Tissue | Disease Stage |
| Page: 1 |
Top |
Single-cell gene regulatory network inference analysis |
| Find out the significant the regulons (TFs) and the target genes of each regulon across cell types for different disease states |
| TF | Cell Type | Tissue | Disease Stage | Target Gene | RSS | Regulon Activity |
| ∗The dot plots of a searched regulon are shown for all cell subpopulations in each disease state of each tissue based on the regulon specific score inferred using pySCENIC and by calculating the average expression. |
| Page: 1 |
Top |
Somatic mutation of malignant transformation related genes |
| Annotation of somatic variants for genes involved in malignant transformation |
| Hugo Symbol | Variant Class | Variant Classification | dbSNP RS | HGVSc | HGVSp | HGVSp Short | SWISSPROT | BIOTYPE | SIFT | PolyPhen | Tumor Sample Barcode | Tissue | Histology | Sex | Age | Stage | Therapy Types | Drugs | Outcome |
| ACER2 | SNV | Missense_Mutation | rs369508087 | c.194A>G | p.Tyr65Cys | p.Y65C | Q5QJU3 | protein_coding | tolerated(0.11) | probably_damaging(0.969) | TCGA-A8-A085-01 | Breast | breast invasive carcinoma | Male | <65 | I/II | Hormone Therapy | tamoxiphen | SD |
| ACER2 | SNV | Missense_Mutation | c.707N>T | p.Ser236Leu | p.S236L | Q5QJU3 | protein_coding | tolerated(0.16) | benign(0.345) | TCGA-BH-A0HA-01 | Breast | breast invasive carcinoma | Female | <65 | I/II | Unknown | Unknown | SD | |
| ACER2 | SNV | Missense_Mutation | c.819N>C | p.Lys273Asn | p.K273N | Q5QJU3 | protein_coding | deleterious_low_confidence(0) | benign(0.376) | TCGA-D8-A1JA-01 | Breast | breast invasive carcinoma | Female | <65 | III/IV | Chemotherapy | adriamycin | PD | |
| ACER2 | insertion | Nonsense_Mutation | novel | c.329_330insTCTTATTTAATTCTTAGTTAATAAGAATAAGAGAGGAGCTTGGG | p.Arg111LeufsTer3 | p.R111Lfs*3 | Q5QJU3 | protein_coding | TCGA-A8-A06X-01 | Breast | breast invasive carcinoma | Female | >=65 | I/II | Unknown | Unknown | SD | ||
| ACER2 | SNV | Missense_Mutation | novel | c.58T>G | p.Cys20Gly | p.C20G | Q5QJU3 | protein_coding | deleterious(0) | probably_damaging(1) | TCGA-AA-3713-01 | Colorectum | colon adenocarcinoma | Male | >=65 | III/IV | Chemotherapy | 5-fluorouracil | PR |
| ACER2 | SNV | Missense_Mutation | rs149224164 | c.518G>A | p.Arg173His | p.R173H | Q5QJU3 | protein_coding | deleterious(0) | probably_damaging(0.984) | TCGA-AD-6899-01 | Colorectum | colon adenocarcinoma | Male | >=65 | III/IV | Unknown | Unknown | SD |
| ACER2 | SNV | Missense_Mutation | rs767197220 | c.73N>G | p.Thr25Ala | p.T25A | Q5QJU3 | protein_coding | tolerated(0.88) | benign(0.005) | TCGA-AZ-4315-01 | Colorectum | colon adenocarcinoma | Male | <65 | I/II | Unknown | Unknown | SD |
| ACER2 | SNV | Missense_Mutation | rs770384271 | c.235N>A | p.Val79Ile | p.V79I | Q5QJU3 | protein_coding | tolerated(0.14) | benign(0.269) | TCGA-A5-A0G1-01 | Endometrium | uterine corpus endometrioid carcinoma | Female | >=65 | I/II | Unknown | Unknown | SD |
| ACER2 | SNV | Missense_Mutation | novel | c.490N>A | p.Ala164Thr | p.A164T | Q5QJU3 | protein_coding | tolerated(0.62) | benign(0.003) | TCGA-A5-A0G1-01 | Endometrium | uterine corpus endometrioid carcinoma | Female | >=65 | I/II | Unknown | Unknown | SD |
| ACER2 | SNV | Missense_Mutation | novel | c.490N>A | p.Ala164Thr | p.A164T | Q5QJU3 | protein_coding | tolerated(0.62) | benign(0.003) | TCGA-A5-A0GG-01 | Endometrium | uterine corpus endometrioid carcinoma | Female | >=65 | I/II | Unknown | Unknown | SD |
| Page: 1 2 3 |
Top |
Related drugs of malignant transformation related genes |
| Identification of chemicals and drugs interact with genes involved in malignant transfromation |
| (DGIdb 4.0) |
| Entrez ID | Symbol | Category | Interaction Types | Drug Claim Name | Drug Name | PMIDs |
| Page: 1 |

Copyright 2023-Present -The University of Texas Health Science Center at Houston |