
|
|||||
|
 | |
| |
| |
| |
| |
| |
|
Gene: ACBD7 |
Gene summary for ACBD7 |
| Gene information | Species | Human | Gene symbol | ACBD7 | Gene ID | 414149 |
| Gene name | acyl-CoA binding domain containing 7 | |
| Gene Alias | bA455B2.2 | |
| Cytomap | 10p13 | |
| Gene Type | protein-coding | GO ID | GO:0000062 | UniProtAcc | Q8N6N7 |
Top |
Malignant transformation analysis |
| Identification of the aberrant gene expression in precancerous and cancerous lesions by comparing the gene expression of stem-like cells in diseased tissues with normal stem cells |
| Entrez ID | Symbol | Replicates | Species | Organ | Tissue | Adj P-value | Log2FC | Malignancy |
| 414149 | ACBD7 | HCC1 | Human | Liver | HCC | 5.09e-08 | 7.08e-01 | 0.5336 |
| 414149 | ACBD7 | HCC2 | Human | Liver | HCC | 1.25e-18 | 1.15e+00 | 0.5341 |
| 414149 | ACBD7 | HCC5 | Human | Liver | HCC | 9.51e-14 | 9.89e-01 | 0.4932 |
| Page: 1 |
| Tissue | Expression Dynamics | Abbreviation |
| Liver | 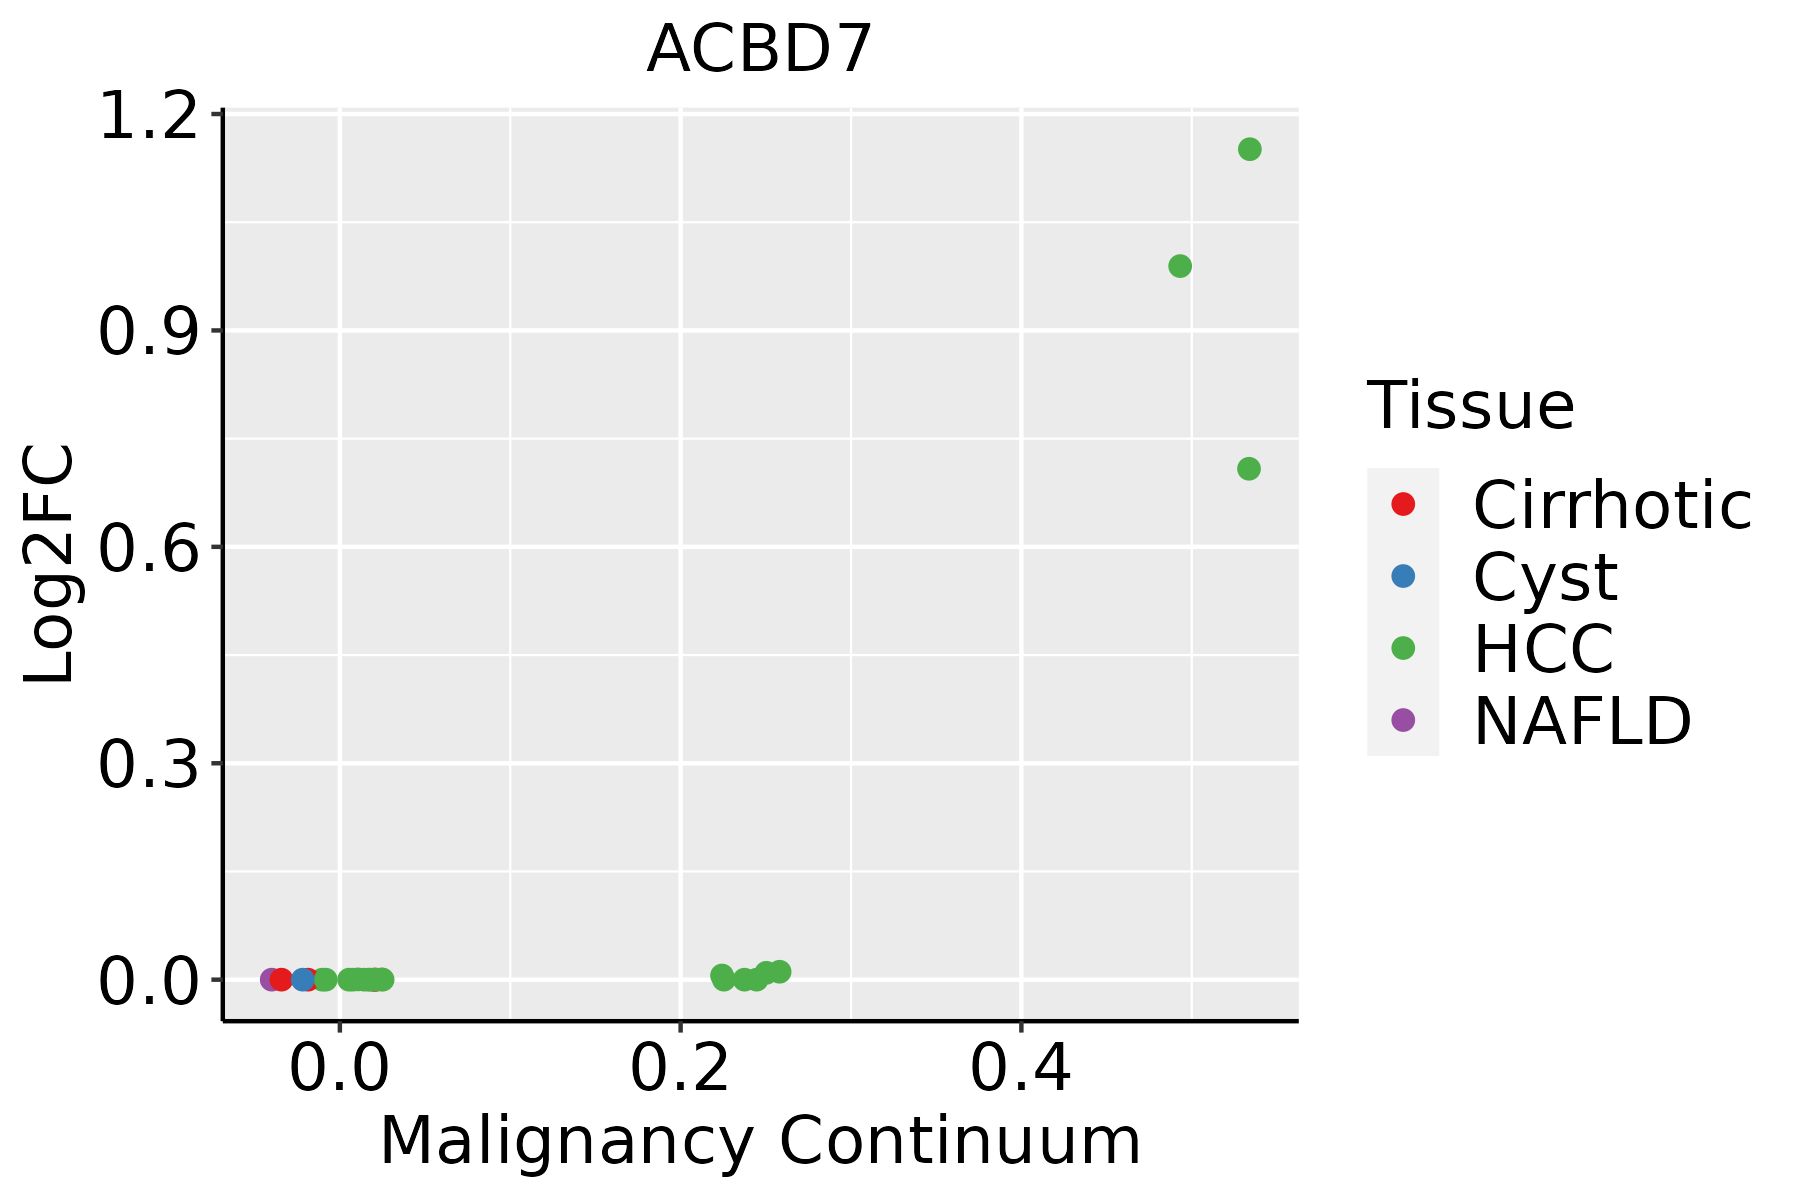 | HCC: Hepatocellular carcinoma |
| NAFLD: Non-alcoholic fatty liver disease |
| ∗log2FC in expression of this searched gene in stem-like cells from each diseased tissue sample relative to stem-like cells in normal samples in each tissue plotted against the malignancy continuum. Samples are colored based on if they are from different disease stage. |
Top |
Malignant transformation related pathway analysis |
| Find out the enriched GO biological processes and KEGG pathways involved in transition from healthy to precancer to cancer |
| Tissue | Disease Stage | Enriched GO biological Processes |
| Colorectum | AD |  |
| Colorectum | SER |  |
| Colorectum | MSS |  |
| Colorectum | MSI-H |  |
| Colorectum | FAP |  |
| ∗Top 15 enriched GO BP terms are showed in the bar plot of each disease state in each tissue. Each row represents a significant GO biological process which is colored according to the -log10(p.adjust). |
| Page: 1 2 3 4 5 6 7 8 9 |
| GO ID | Tissue | Disease Stage | Description | Gene Ratio | Bg Ratio | pvalue | p.adjust | Count |
| Page: 1 |
| Pathway ID | Tissue | Disease Stage | Description | Gene Ratio | Bg Ratio | pvalue | p.adjust | qvalue | Count |
| Page: 1 |
Top |
Cell-cell communication analysis |
| Identification of potential cell-cell interactions between two cell types and their ligand-receptor pairs for different disease states |
| Ligand | Receptor | LRpair | Pathway | Tissue | Disease Stage |
| Page: 1 |
Top |
Single-cell gene regulatory network inference analysis |
| Find out the significant the regulons (TFs) and the target genes of each regulon across cell types for different disease states |
| TF | Cell Type | Tissue | Disease Stage | Target Gene | RSS | Regulon Activity |
| ∗The dot plots of a searched regulon are shown for all cell subpopulations in each disease state of each tissue based on the regulon specific score inferred using pySCENIC and by calculating the average expression. |
| Page: 1 |
Top |
Somatic mutation of malignant transformation related genes |
| Annotation of somatic variants for genes involved in malignant transformation |
| Hugo Symbol | Variant Class | Variant Classification | dbSNP RS | HGVSc | HGVSp | HGVSp Short | SWISSPROT | BIOTYPE | SIFT | PolyPhen | Tumor Sample Barcode | Tissue | Histology | Sex | Age | Stage | Therapy Types | Drugs | Outcome |
| ACBD7 | SNV | Missense_Mutation | c.257N>G | p.Tyr86Cys | p.Y86C | Q8N6N7 | protein_coding | deleterious(0) | probably_damaging(0.964) | TCGA-D5-6928-01 | Colorectum | colon adenocarcinoma | Male | >=65 | I/II | Unknown | Unknown | SD | |
| ACBD7 | SNV | Missense_Mutation | c.179N>T | p.Trp60Leu | p.W60L | Q8N6N7 | protein_coding | deleterious(0) | probably_damaging(0.987) | TCGA-EI-6917-01 | Colorectum | rectum adenocarcinoma | Male | <65 | III/IV | Chemotherapy | 5fluorouracil+oxaciplatina+l-folinian | SD | |
| ACBD7 | SNV | Missense_Mutation | rs774032600 | c.131C>T | p.Ala44Val | p.A44V | Q8N6N7 | protein_coding | deleterious(0.04) | benign(0.219) | TCGA-AP-A056-01 | Endometrium | uterine corpus endometrioid carcinoma | Female | <65 | I/II | Unknown | Unknown | SD |
| ACBD7 | SNV | Missense_Mutation | c.163N>T | p.Ala55Ser | p.A55S | Q8N6N7 | protein_coding | deleterious(0.04) | possibly_damaging(0.859) | TCGA-AX-A0J1-01 | Endometrium | uterine corpus endometrioid carcinoma | Female | >=65 | I/II | Unknown | Unknown | SD | |
| ACBD7 | SNV | Missense_Mutation | c.257N>T | p.Tyr86Phe | p.Y86F | Q8N6N7 | protein_coding | deleterious(0) | possibly_damaging(0.868) | TCGA-D1-A175-01 | Endometrium | uterine corpus endometrioid carcinoma | Female | <65 | I/II | Chemotherapy | paclitaxel | SD | |
| ACBD7 | SNV | Missense_Mutation | novel | c.113N>C | p.Val38Ala | p.V38A | Q8N6N7 | protein_coding | tolerated(0.05) | benign(0.077) | TCGA-D1-A175-01 | Endometrium | uterine corpus endometrioid carcinoma | Female | <65 | I/II | Chemotherapy | paclitaxel | SD |
| ACBD7 | SNV | Missense_Mutation | rs371874832 | c.212N>T | p.Ala71Val | p.A71V | Q8N6N7 | protein_coding | deleterious(0.01) | probably_damaging(0.983) | TCGA-EO-A22U-01 | Endometrium | uterine corpus endometrioid carcinoma | Female | >=65 | I/II | Unknown | Unknown | SD |
| ACBD7 | SNV | Missense_Mutation | rs371874832 | c.212C>T | p.Ala71Val | p.A71V | Q8N6N7 | protein_coding | deleterious(0.01) | probably_damaging(0.983) | TCGA-EO-A3B0-01 | Endometrium | uterine corpus endometrioid carcinoma | Female | <65 | III/IV | Unknown | Unknown | SD |
| ACBD7 | SNV | Missense_Mutation | rs200704311 | c.259N>A | p.Gly87Arg | p.G87R | Q8N6N7 | protein_coding | deleterious(0.02) | probably_damaging(0.996) | TCGA-EY-A1H0-01 | Endometrium | uterine corpus endometrioid carcinoma | Female | <65 | III/IV | Chemotherapy | taxol | SD |
| ACBD7 | SNV | Missense_Mutation | c.256N>G | p.Tyr86Asp | p.Y86D | Q8N6N7 | protein_coding | deleterious(0.01) | benign(0.151) | TCGA-EJ-5502-01 | Prostate | prostate adenocarcinoma | Male | <65 | 7 | Unknown | Unknown | SD |
| Page: 1 2 |
Top |
Related drugs of malignant transformation related genes |
| Identification of chemicals and drugs interact with genes involved in malignant transfromation |
| (DGIdb 4.0) |
| Entrez ID | Symbol | Category | Interaction Types | Drug Claim Name | Drug Name | PMIDs |
| Page: 1 |

Copyright 2023-Present -The University of Texas Health Science Center at Houston |