
|
|||||
|
 | |
| |
| |
| |
| |
| |
|
Gene: ACBD3 |
Gene summary for ACBD3 |
| Gene information | Species | Human | Gene symbol | ACBD3 | Gene ID | 64746 |
| Gene name | acyl-CoA binding domain containing 3 | |
| Gene Alias | GCP60 | |
| Cytomap | 1q42.12 | |
| Gene Type | protein-coding | GO ID | GO:0006629 | UniProtAcc | A0A024R3P9 |
Top |
Malignant transformation analysis |
| Identification of the aberrant gene expression in precancerous and cancerous lesions by comparing the gene expression of stem-like cells in diseased tissues with normal stem cells |
| Entrez ID | Symbol | Replicates | Species | Organ | Tissue | Adj P-value | Log2FC | Malignancy |
| 64746 | ACBD3 | GSM4909281 | Human | Breast | IDC | 1.66e-05 | 2.71e-01 | 0.21 |
| 64746 | ACBD3 | GSM4909285 | Human | Breast | IDC | 1.42e-03 | 2.48e-01 | 0.21 |
| 64746 | ACBD3 | GSM4909287 | Human | Breast | IDC | 3.32e-03 | 2.73e-01 | 0.2057 |
| 64746 | ACBD3 | GSM4909290 | Human | Breast | IDC | 1.80e-07 | 3.81e-01 | 0.2096 |
| 64746 | ACBD3 | GSM4909293 | Human | Breast | IDC | 3.05e-26 | 5.06e-01 | 0.1581 |
| 64746 | ACBD3 | GSM4909295 | Human | Breast | IDC | 1.04e-02 | 3.30e-01 | 0.0898 |
| 64746 | ACBD3 | GSM4909298 | Human | Breast | IDC | 2.93e-07 | 3.07e-01 | 0.1551 |
| 64746 | ACBD3 | GSM4909306 | Human | Breast | IDC | 3.27e-03 | 2.85e-01 | 0.1564 |
| 64746 | ACBD3 | GSM4909308 | Human | Breast | IDC | 2.72e-07 | 3.49e-01 | 0.158 |
| 64746 | ACBD3 | GSM4909311 | Human | Breast | IDC | 7.16e-08 | -9.63e-02 | 0.1534 |
| 64746 | ACBD3 | GSM4909312 | Human | Breast | IDC | 3.95e-02 | 9.77e-02 | 0.1552 |
| 64746 | ACBD3 | GSM4909315 | Human | Breast | IDC | 2.49e-05 | 3.15e-01 | 0.21 |
| 64746 | ACBD3 | GSM4909317 | Human | Breast | IDC | 1.61e-10 | 3.92e-01 | 0.1355 |
| 64746 | ACBD3 | GSM4909319 | Human | Breast | IDC | 2.51e-12 | -1.47e-02 | 0.1563 |
| 64746 | ACBD3 | GSM4909320 | Human | Breast | IDC | 1.23e-02 | 2.15e-01 | 0.1575 |
| 64746 | ACBD3 | GSM4909321 | Human | Breast | IDC | 4.18e-04 | 1.03e-02 | 0.1559 |
| 64746 | ACBD3 | NCCBC14 | Human | Breast | DCIS | 1.72e-16 | 6.13e-01 | 0.2021 |
| 64746 | ACBD3 | P1 | Human | Breast | IDC | 3.83e-02 | 4.61e-02 | 0.1527 |
| 64746 | ACBD3 | P2 | Human | Breast | IDC | 6.98e-04 | 3.65e-01 | 0.21 |
| 64746 | ACBD3 | DCIS2 | Human | Breast | DCIS | 2.70e-69 | 4.17e-01 | 0.0085 |
| Page: 1 2 3 4 5 6 7 8 9 |
| Tissue | Expression Dynamics | Abbreviation |
| Breast | 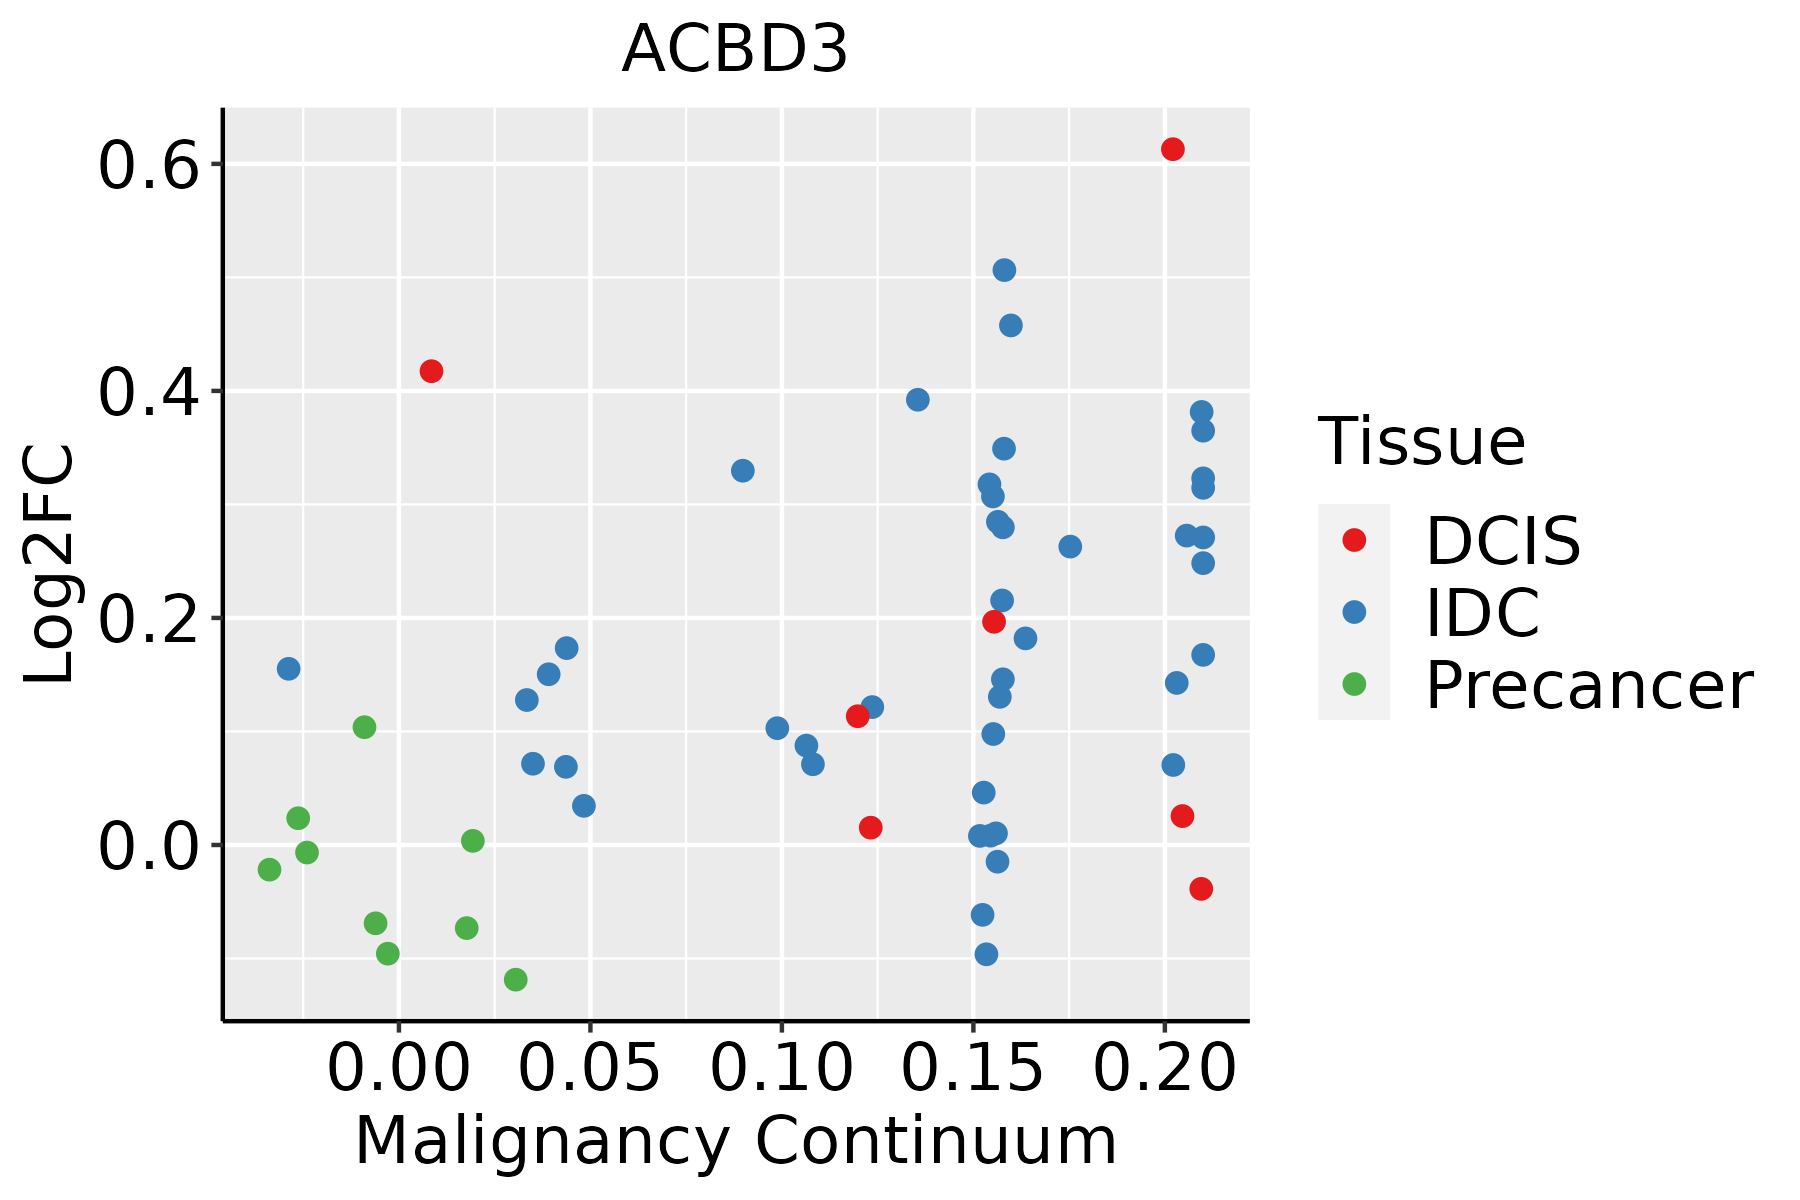 | IDC: Invasive ductal carcinoma |
| DCIS: Ductal carcinoma in situ | ||
| Precancer(BRCA1-mut): Precancerous lesion from BRCA1 mutation carriers | ||
| Cervix |  | CC: Cervix cancer |
| HSIL_HPV: HPV-infected high-grade squamous intraepithelial lesions | ||
| N_HPV: HPV-infected normal cervix | ||
| Esophagus | 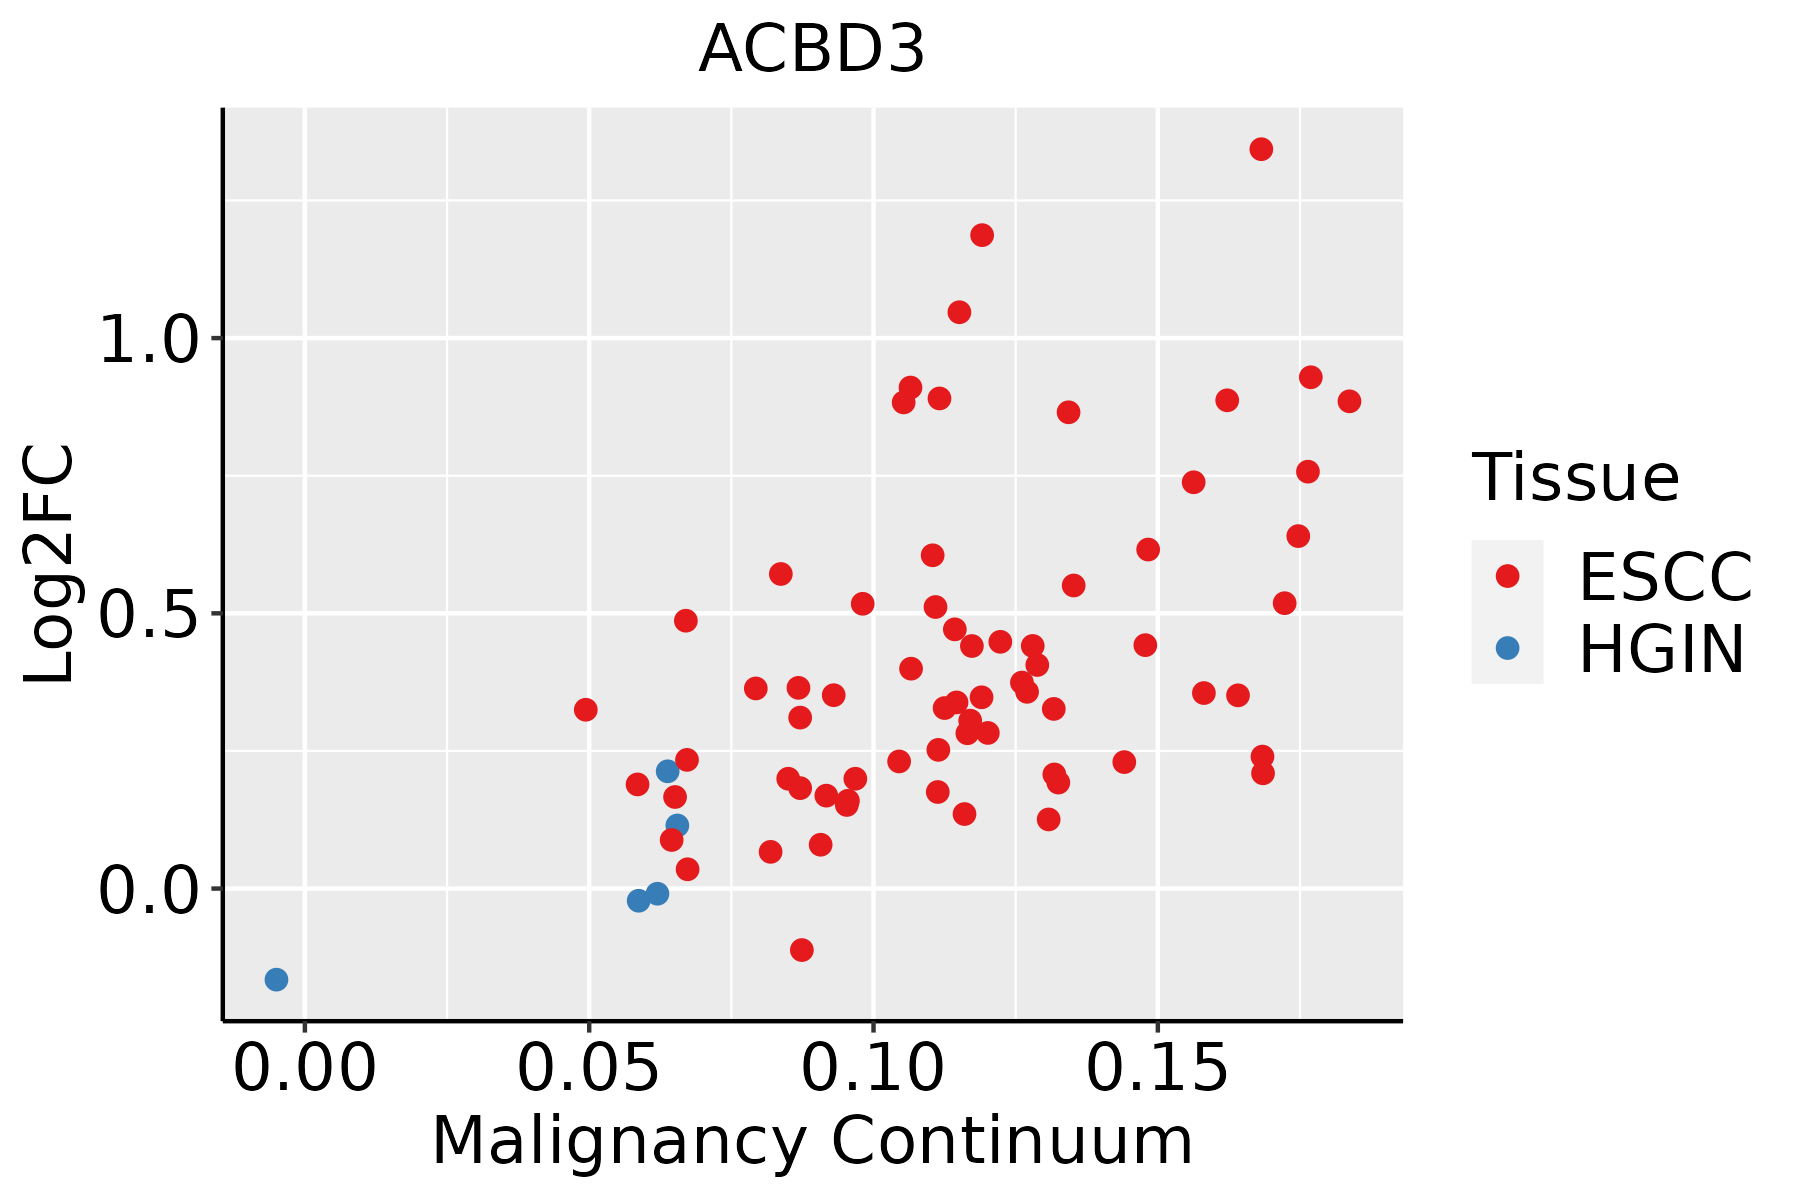 | ESCC: Esophageal squamous cell carcinoma |
| HGIN: High-grade intraepithelial neoplasias | ||
| LGIN: Low-grade intraepithelial neoplasias | ||
| Liver |  | HCC: Hepatocellular carcinoma |
| NAFLD: Non-alcoholic fatty liver disease | ||
| Lung | 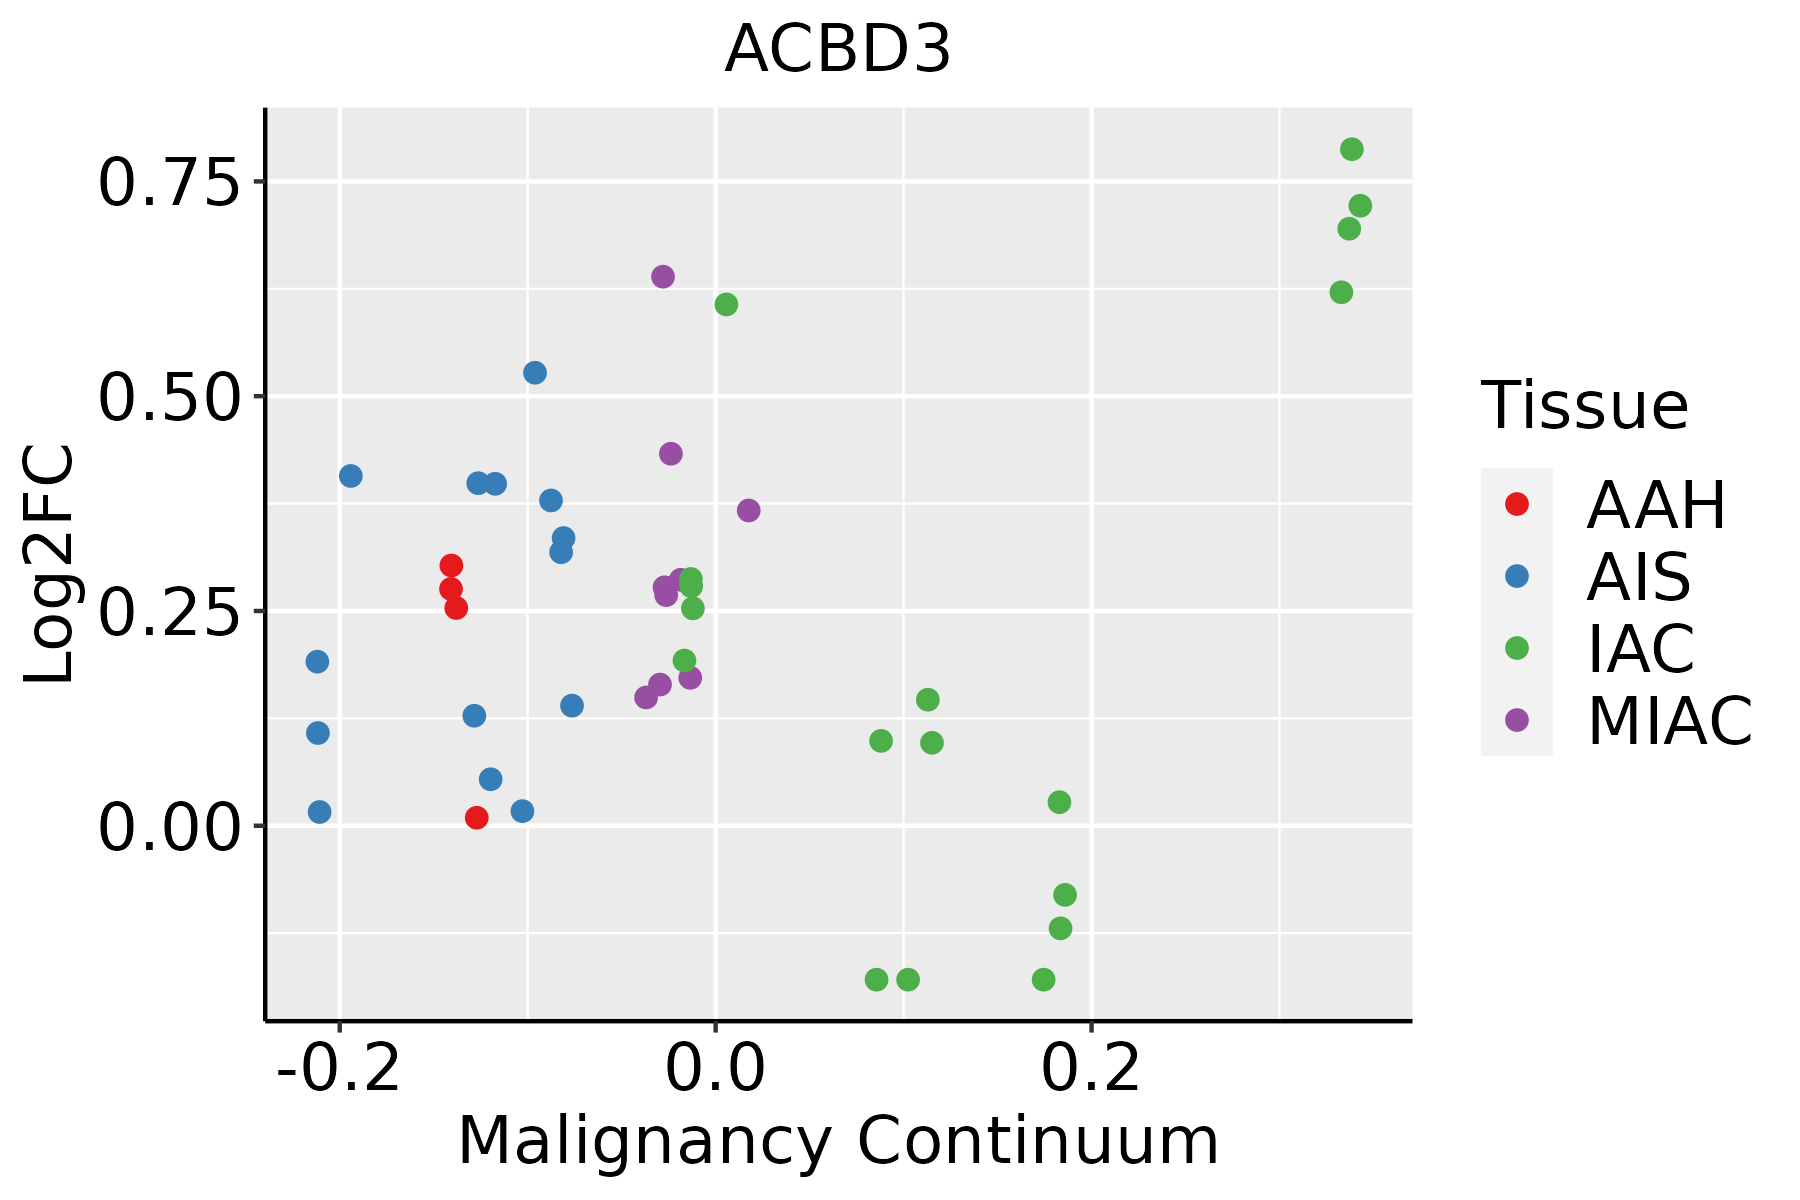 | AAH: Atypical adenomatous hyperplasia |
| AIS: Adenocarcinoma in situ | ||
| IAC: Invasive lung adenocarcinoma | ||
| MIA: Minimally invasive adenocarcinoma | ||
| Oral Cavity |  | EOLP: Erosive Oral lichen planus |
| LP: leukoplakia | ||
| NEOLP: Non-erosive oral lichen planus | ||
| OSCC: Oral squamous cell carcinoma | ||
| Prostate | 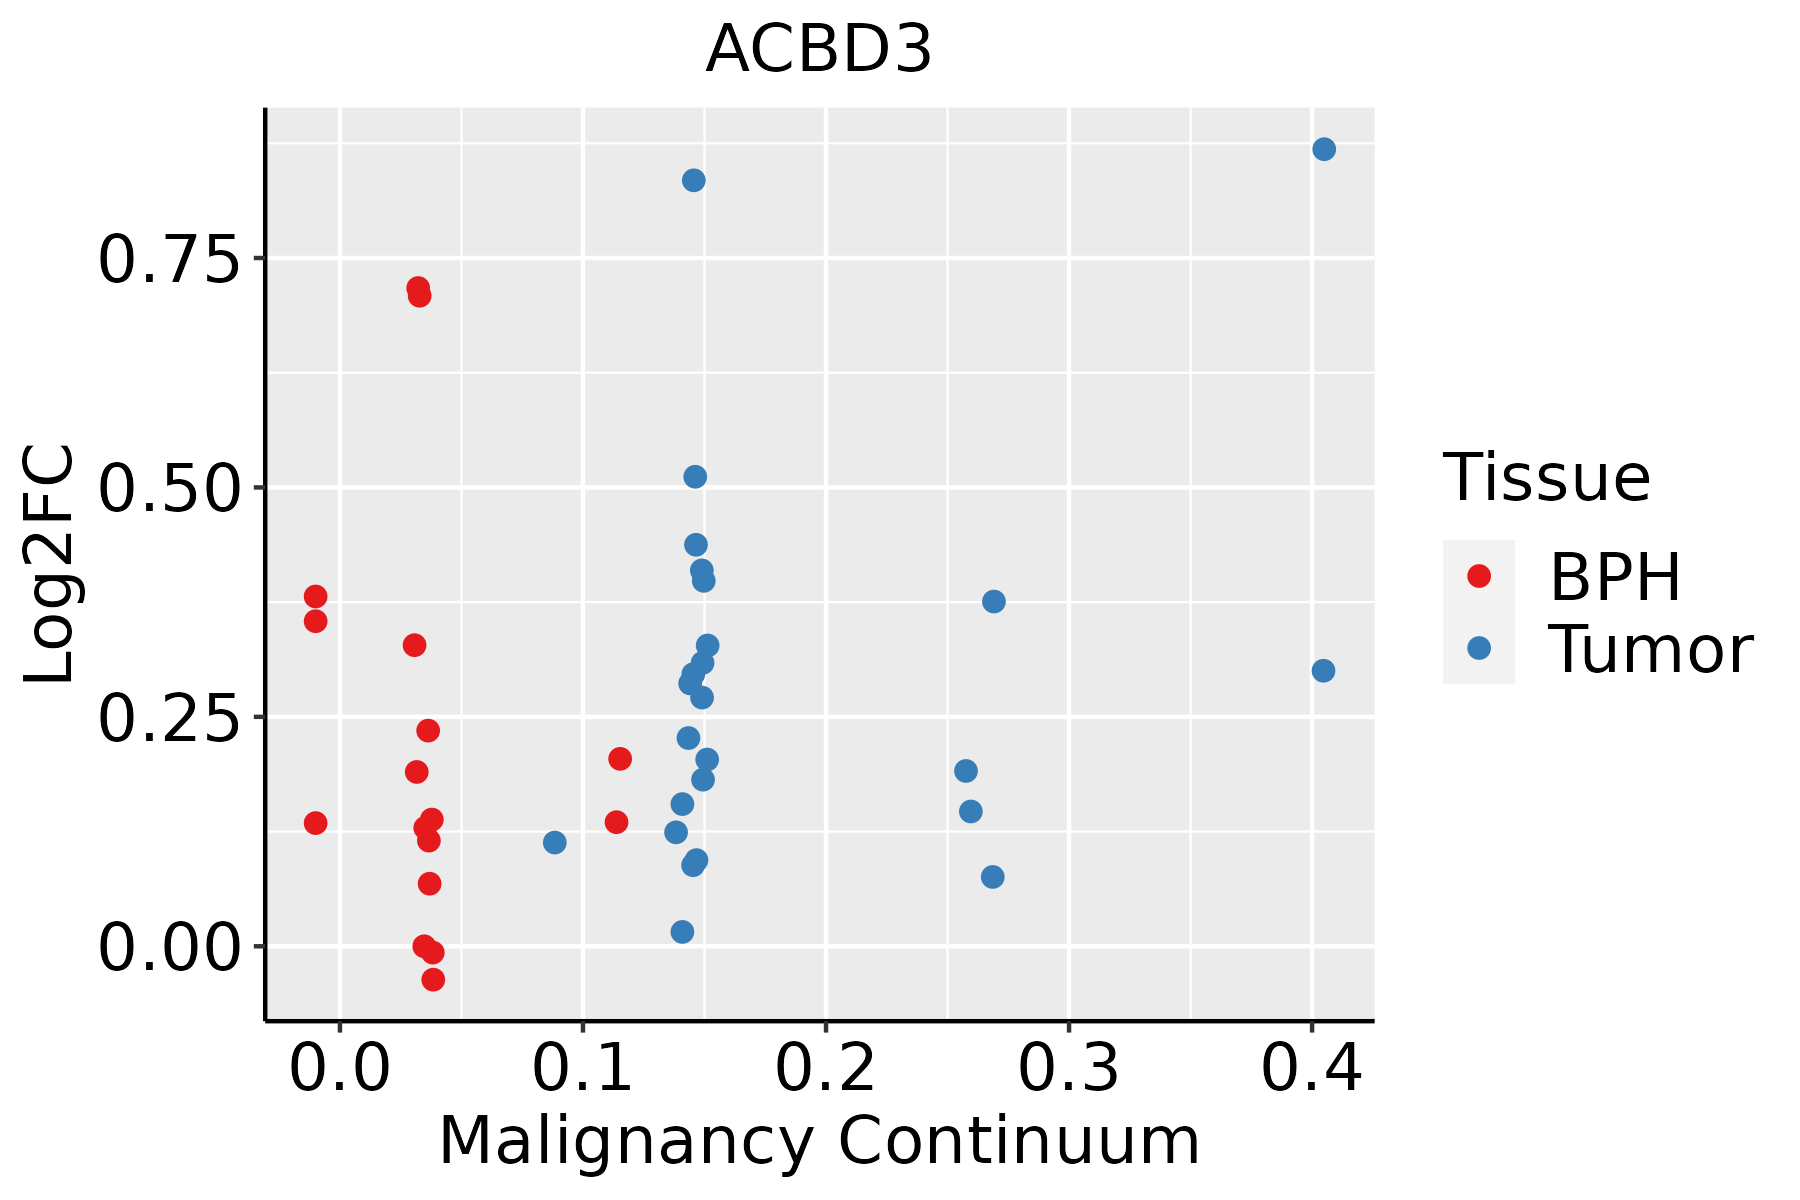 | BPH: Benign Prostatic Hyperplasia |
| Skin | 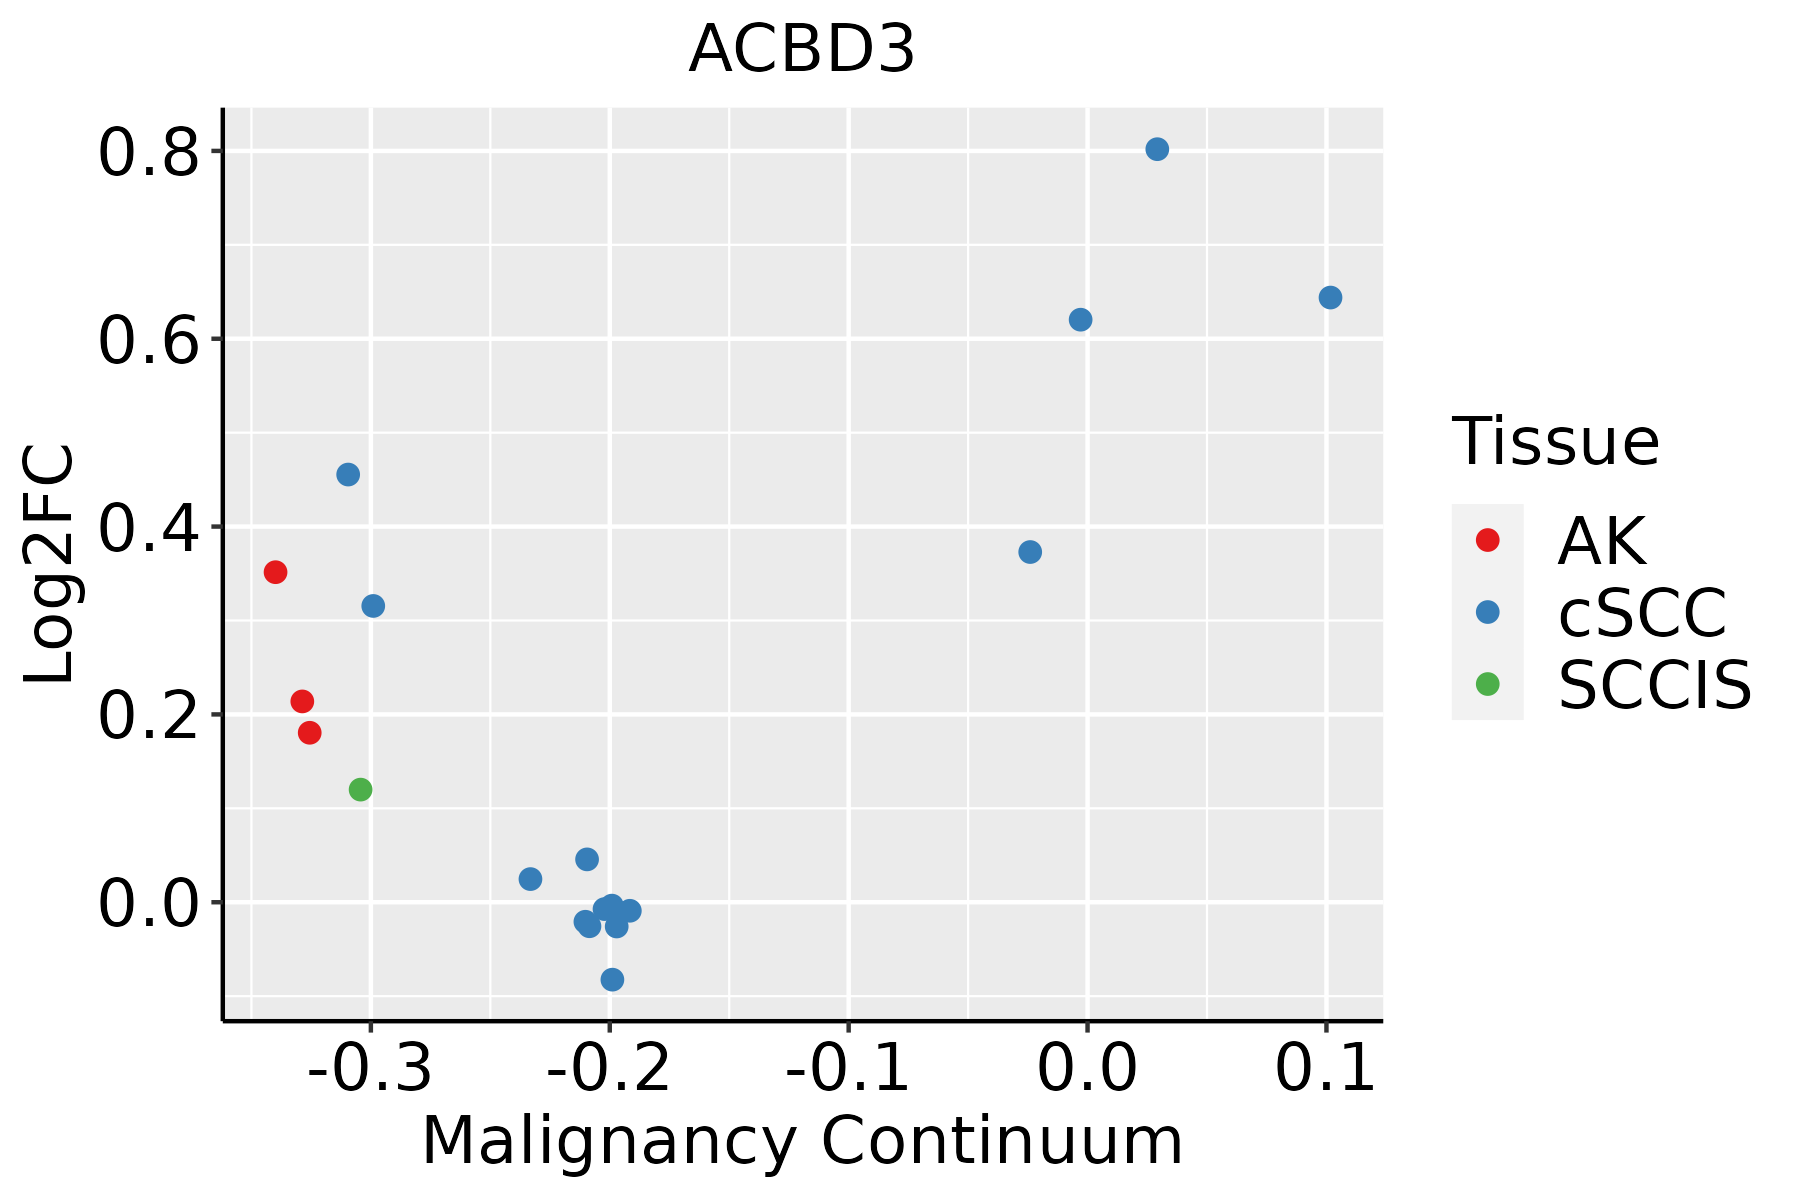 | AK: Actinic keratosis |
| cSCC: Cutaneous squamous cell carcinoma | ||
| SCCIS:squamous cell carcinoma in situ | ||
| Thyroid | 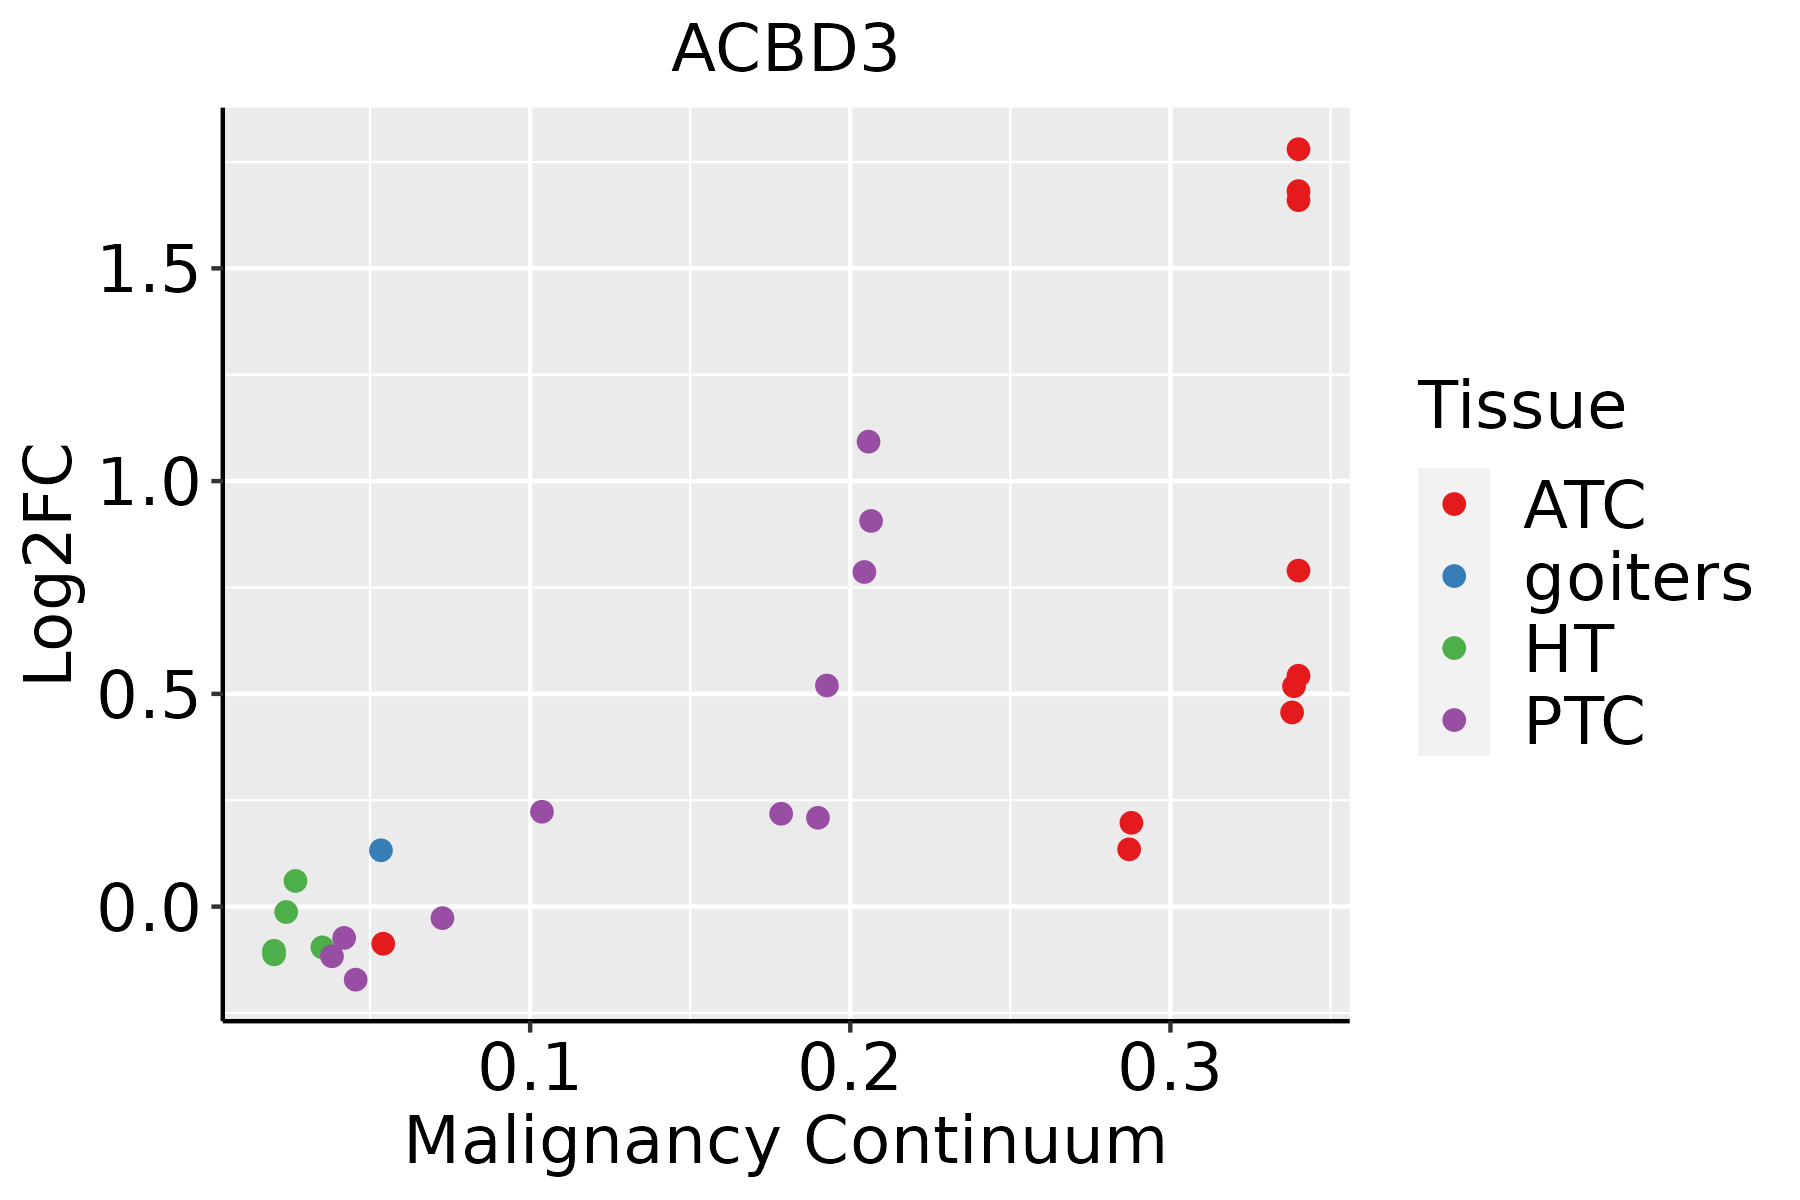 | ATC: Anaplastic thyroid cancer |
| HT: Hashimoto's thyroiditis | ||
| PTC: Papillary thyroid cancer |
| ∗log2FC in expression of this searched gene in stem-like cells from each diseased tissue sample relative to stem-like cells in normal samples in each tissue plotted against the malignancy continuum. Samples are colored based on if they are from different disease stage. |
Top |
Malignant transformation related pathway analysis |
| Find out the enriched GO biological processes and KEGG pathways involved in transition from healthy to precancer to cancer |
| Tissue | Disease Stage | Enriched GO biological Processes |
| Colorectum | AD |  |
| Colorectum | SER |  |
| Colorectum | MSS |  |
| Colorectum | MSI-H |  |
| Colorectum | FAP |  |
| ∗Top 15 enriched GO BP terms are showed in the bar plot of each disease state in each tissue. Each row represents a significant GO biological process which is colored according to the -log10(p.adjust). |
| Page: 1 2 3 4 5 6 7 8 9 |
| GO ID | Tissue | Disease Stage | Description | Gene Ratio | Bg Ratio | pvalue | p.adjust | Count |
| GO:00066944 | Breast | IDC | steroid biosynthetic process | 25/1434 | 173/18723 | 1.56e-03 | 1.56e-02 | 25 |
| GO:000669411 | Breast | DCIS | steroid biosynthetic process | 23/1390 | 173/18723 | 4.63e-03 | 3.52e-02 | 23 |
| GO:00066946 | Esophagus | ESCC | steroid biosynthetic process | 98/8552 | 173/18723 | 2.34e-03 | 1.03e-02 | 98 |
| GO:000820211 | Liver | Cirrhotic | steroid metabolic process | 143/4634 | 319/18723 | 2.79e-15 | 3.18e-13 | 143 |
| GO:00066941 | Liver | Cirrhotic | steroid biosynthetic process | 77/4634 | 173/18723 | 1.02e-08 | 3.91e-07 | 77 |
| GO:00082022 | Liver | HCC | steroid metabolic process | 188/7958 | 319/18723 | 1.96e-09 | 5.63e-08 | 188 |
| GO:00066942 | Liver | HCC | steroid biosynthetic process | 104/7958 | 173/18723 | 2.13e-06 | 2.91e-05 | 104 |
| GO:00066945 | Oral cavity | OSCC | steroid biosynthetic process | 89/7305 | 173/18723 | 5.77e-04 | 3.30e-03 | 89 |
| GO:00082024 | Oral cavity | OSCC | steroid metabolic process | 146/7305 | 319/18723 | 7.78e-03 | 2.85e-02 | 146 |
| GO:000669412 | Oral cavity | LP | steroid biosynthetic process | 58/4623 | 173/18723 | 5.44e-03 | 3.31e-02 | 58 |
| Page: 1 |
| Pathway ID | Tissue | Disease Stage | Description | Gene Ratio | Bg Ratio | pvalue | p.adjust | qvalue | Count |
| hsa0513243 | Breast | DCIS | Salmonella infection | 55/846 | 249/8465 | 8.71e-09 | 1.87e-07 | 1.38e-07 | 55 |
| hsa0513253 | Breast | DCIS | Salmonella infection | 55/846 | 249/8465 | 8.71e-09 | 1.87e-07 | 1.38e-07 | 55 |
| hsa0513222 | Liver | Cirrhotic | Salmonella infection | 121/2530 | 249/8465 | 2.47e-10 | 5.13e-09 | 3.16e-09 | 121 |
| hsa0513232 | Liver | Cirrhotic | Salmonella infection | 121/2530 | 249/8465 | 2.47e-10 | 5.13e-09 | 3.16e-09 | 121 |
| hsa0513242 | Liver | HCC | Salmonella infection | 178/4020 | 249/8465 | 5.90e-15 | 1.98e-13 | 1.10e-13 | 178 |
| hsa0513252 | Liver | HCC | Salmonella infection | 178/4020 | 249/8465 | 5.90e-15 | 1.98e-13 | 1.10e-13 | 178 |
| hsa0513216 | Lung | IAC | Salmonella infection | 52/1053 | 249/8465 | 9.46e-05 | 1.28e-03 | 8.50e-04 | 52 |
| hsa0513217 | Lung | IAC | Salmonella infection | 52/1053 | 249/8465 | 9.46e-05 | 1.28e-03 | 8.50e-04 | 52 |
| hsa0513223 | Lung | AIS | Salmonella infection | 50/961 | 249/8465 | 3.47e-05 | 5.62e-04 | 3.59e-04 | 50 |
| hsa0513233 | Lung | AIS | Salmonella infection | 50/961 | 249/8465 | 3.47e-05 | 5.62e-04 | 3.59e-04 | 50 |
| hsa0513230 | Oral cavity | OSCC | Salmonella infection | 174/3704 | 249/8465 | 2.67e-17 | 1.49e-15 | 7.58e-16 | 174 |
| hsa05132114 | Oral cavity | OSCC | Salmonella infection | 174/3704 | 249/8465 | 2.67e-17 | 1.49e-15 | 7.58e-16 | 174 |
| hsa05132210 | Oral cavity | LP | Salmonella infection | 128/2418 | 249/8465 | 1.17e-14 | 2.79e-13 | 1.80e-13 | 128 |
| hsa0513238 | Oral cavity | LP | Salmonella infection | 128/2418 | 249/8465 | 1.17e-14 | 2.79e-13 | 1.80e-13 | 128 |
| hsa0513245 | Oral cavity | EOLP | Salmonella infection | 78/1218 | 249/8465 | 3.66e-12 | 2.37e-10 | 1.40e-10 | 78 |
| hsa0513255 | Oral cavity | EOLP | Salmonella infection | 78/1218 | 249/8465 | 3.66e-12 | 2.37e-10 | 1.40e-10 | 78 |
| hsa0513228 | Prostate | BPH | Salmonella infection | 99/1718 | 249/8465 | 7.26e-13 | 1.50e-11 | 9.27e-12 | 99 |
| hsa05132113 | Prostate | BPH | Salmonella infection | 99/1718 | 249/8465 | 7.26e-13 | 1.50e-11 | 9.27e-12 | 99 |
| Page: 1 |
Top |
Cell-cell communication analysis |
| Identification of potential cell-cell interactions between two cell types and their ligand-receptor pairs for different disease states |
| Ligand | Receptor | LRpair | Pathway | Tissue | Disease Stage |
| Page: 1 |
Top |
Single-cell gene regulatory network inference analysis |
| Find out the significant the regulons (TFs) and the target genes of each regulon across cell types for different disease states |
| TF | Cell Type | Tissue | Disease Stage | Target Gene | RSS | Regulon Activity |
| ∗The dot plots of a searched regulon are shown for all cell subpopulations in each disease state of each tissue based on the regulon specific score inferred using pySCENIC and by calculating the average expression. |
| Page: 1 |
Top |
Somatic mutation of malignant transformation related genes |
| Annotation of somatic variants for genes involved in malignant transformation |
| Hugo Symbol | Variant Class | Variant Classification | dbSNP RS | HGVSc | HGVSp | HGVSp Short | SWISSPROT | BIOTYPE | SIFT | PolyPhen | Tumor Sample Barcode | Tissue | Histology | Sex | Age | Stage | Therapy Types | Drugs | Outcome |
| ACBD3 | SNV | Missense_Mutation | c.1042N>C | p.Glu348Gln | p.E348Q | Q9H3P7 | protein_coding | tolerated(0.13) | possibly_damaging(0.643) | TCGA-A8-A0A7-01 | Breast | breast invasive carcinoma | Female | <65 | I/II | Unknown | Unknown | SD | |
| ACBD3 | SNV | Missense_Mutation | c.676G>A | p.Glu226Lys | p.E226K | Q9H3P7 | protein_coding | tolerated(0.09) | possibly_damaging(0.899) | TCGA-AC-A23H-01 | Breast | breast invasive carcinoma | Female | >=65 | I/II | Unknown | Unknown | PD | |
| ACBD3 | SNV | Missense_Mutation | c.1568G>C | p.Arg523Thr | p.R523T | Q9H3P7 | protein_coding | deleterious(0) | probably_damaging(0.983) | TCGA-D8-A1JN-01 | Breast | breast invasive carcinoma | Female | >=65 | III/IV | Hormone Therapy | anastrozolum | SD | |
| ACBD3 | SNV | Missense_Mutation | novel | c.634G>C | p.Glu212Gln | p.E212Q | Q9H3P7 | protein_coding | tolerated(0.05) | probably_damaging(0.932) | TCGA-PE-A5DE-01 | Breast | breast invasive carcinoma | Female | <65 | I/II | Chemotherapy | taxotere | CR |
| ACBD3 | deletion | Frame_Shift_Del | novel | c.327delA | p.Lys109AsnfsTer2 | p.K109Nfs*2 | Q9H3P7 | protein_coding | TCGA-D8-A27V-01 | Breast | breast invasive carcinoma | Female | <65 | I/II | Hormone Therapy | tamoxiphen | SD | ||
| ACBD3 | SNV | Missense_Mutation | novel | c.580N>C | p.Glu194Gln | p.E194Q | Q9H3P7 | protein_coding | tolerated(0.1) | probably_damaging(0.932) | TCGA-C5-A8XK-01 | Cervix | cervical & endocervical cancer | Female | <65 | I/II | Chemotherapy | cisplatin | SD |
| ACBD3 | SNV | Missense_Mutation | rs752822487 | c.1333G>A | p.Val445Met | p.V445M | Q9H3P7 | protein_coding | deleterious(0) | probably_damaging(0.986) | TCGA-AA-3710-01 | Colorectum | colon adenocarcinoma | Female | >=65 | I/II | Unknown | Unknown | SD |
| ACBD3 | SNV | Missense_Mutation | novel | c.332N>G | p.Lys111Arg | p.K111R | Q9H3P7 | protein_coding | tolerated(0.46) | benign(0.027) | TCGA-AA-3877-01 | Colorectum | colon adenocarcinoma | Female | >=65 | I/II | Unknown | Unknown | SD |
| ACBD3 | SNV | Missense_Mutation | c.373A>C | p.Asn125His | p.N125H | Q9H3P7 | protein_coding | deleterious(0) | probably_damaging(0.985) | TCGA-AA-A00N-01 | Colorectum | colon adenocarcinoma | Male | >=65 | I/II | Unknown | Unknown | PD | |
| ACBD3 | SNV | Missense_Mutation | novel | c.1529N>G | p.Asn510Ser | p.N510S | Q9H3P7 | protein_coding | deleterious(0) | probably_damaging(0.999) | TCGA-G4-6588-01 | Colorectum | colon adenocarcinoma | Female | <65 | I/II | Unknown | Unknown | SD |
| Page: 1 2 3 4 5 |
Top |
Related drugs of malignant transformation related genes |
| Identification of chemicals and drugs interact with genes involved in malignant transfromation |
| (DGIdb 4.0) |
| Entrez ID | Symbol | Category | Interaction Types | Drug Claim Name | Drug Name | PMIDs |
| Page: 1 |

Copyright 2023-Present -The University of Texas Health Science Center at Houston |