
|
|||||
|
 | |
| |
| |
| |
| |
| |
|
Gene: ACAP1 |
Gene summary for ACAP1 |
| Gene information | Species | Human | Gene symbol | ACAP1 | Gene ID | 9744 |
| Gene name | ArfGAP with coiled-coil, ankyrin repeat and PH domains 1 | |
| Gene Alias | CENTB1 | |
| Cytomap | 17p13.1 | |
| Gene Type | protein-coding | GO ID | GO:0006810 | UniProtAcc | Q15027 |
Top |
Malignant transformation analysis |
| Identification of the aberrant gene expression in precancerous and cancerous lesions by comparing the gene expression of stem-like cells in diseased tissues with normal stem cells |
| Entrez ID | Symbol | Replicates | Species | Organ | Tissue | Adj P-value | Log2FC | Malignancy |
| 9744 | ACAP1 | LZE4T | Human | Esophagus | ESCC | 5.66e-05 | 2.50e-01 | 0.0811 |
| 9744 | ACAP1 | LZE7T | Human | Esophagus | ESCC | 1.27e-07 | 4.46e-01 | 0.0667 |
| 9744 | ACAP1 | LZE6T | Human | Esophagus | ESCC | 7.16e-16 | 7.21e-01 | 0.0845 |
| 9744 | ACAP1 | P5T-E | Human | Esophagus | ESCC | 2.69e-05 | 1.23e-01 | 0.1327 |
| 9744 | ACAP1 | P10T-E | Human | Esophagus | ESCC | 1.69e-05 | 8.98e-02 | 0.116 |
| 9744 | ACAP1 | P22T-E | Human | Esophagus | ESCC | 1.26e-03 | 8.92e-02 | 0.1236 |
| 9744 | ACAP1 | P32T-E | Human | Esophagus | ESCC | 2.65e-02 | 6.91e-02 | 0.1666 |
| 9744 | ACAP1 | P36T-E | Human | Esophagus | ESCC | 6.10e-03 | 7.76e-02 | 0.1187 |
| 9744 | ACAP1 | P37T-E | Human | Esophagus | ESCC | 1.50e-02 | 8.32e-02 | 0.1371 |
| 9744 | ACAP1 | P49T-E | Human | Esophagus | ESCC | 5.18e-05 | 5.15e-01 | 0.1768 |
| 9744 | ACAP1 | P107T-E | Human | Esophagus | ESCC | 3.04e-07 | 1.10e-01 | 0.171 |
| 9744 | ACAP1 | P130T-E | Human | Esophagus | ESCC | 1.09e-22 | 4.46e-01 | 0.1676 |
| 9744 | ACAP1 | C04 | Human | Oral cavity | OSCC | 3.05e-04 | 1.09e-01 | 0.2633 |
| 9744 | ACAP1 | C21 | Human | Oral cavity | OSCC | 5.80e-08 | 2.86e-01 | 0.2678 |
| 9744 | ACAP1 | C30 | Human | Oral cavity | OSCC | 9.59e-09 | 5.78e-01 | 0.3055 |
| 9744 | ACAP1 | C38 | Human | Oral cavity | OSCC | 5.66e-08 | 7.10e-01 | 0.172 |
| 9744 | ACAP1 | C46 | Human | Oral cavity | OSCC | 1.80e-03 | 4.59e-02 | 0.1673 |
| 9744 | ACAP1 | C51 | Human | Oral cavity | OSCC | 2.93e-06 | 2.59e-01 | 0.2674 |
| 9744 | ACAP1 | C57 | Human | Oral cavity | OSCC | 4.67e-06 | 2.15e-01 | 0.1679 |
| 9744 | ACAP1 | C06 | Human | Oral cavity | OSCC | 4.79e-03 | 5.82e-01 | 0.2699 |
| Page: 1 2 |
| Tissue | Expression Dynamics | Abbreviation |
| Esophagus | 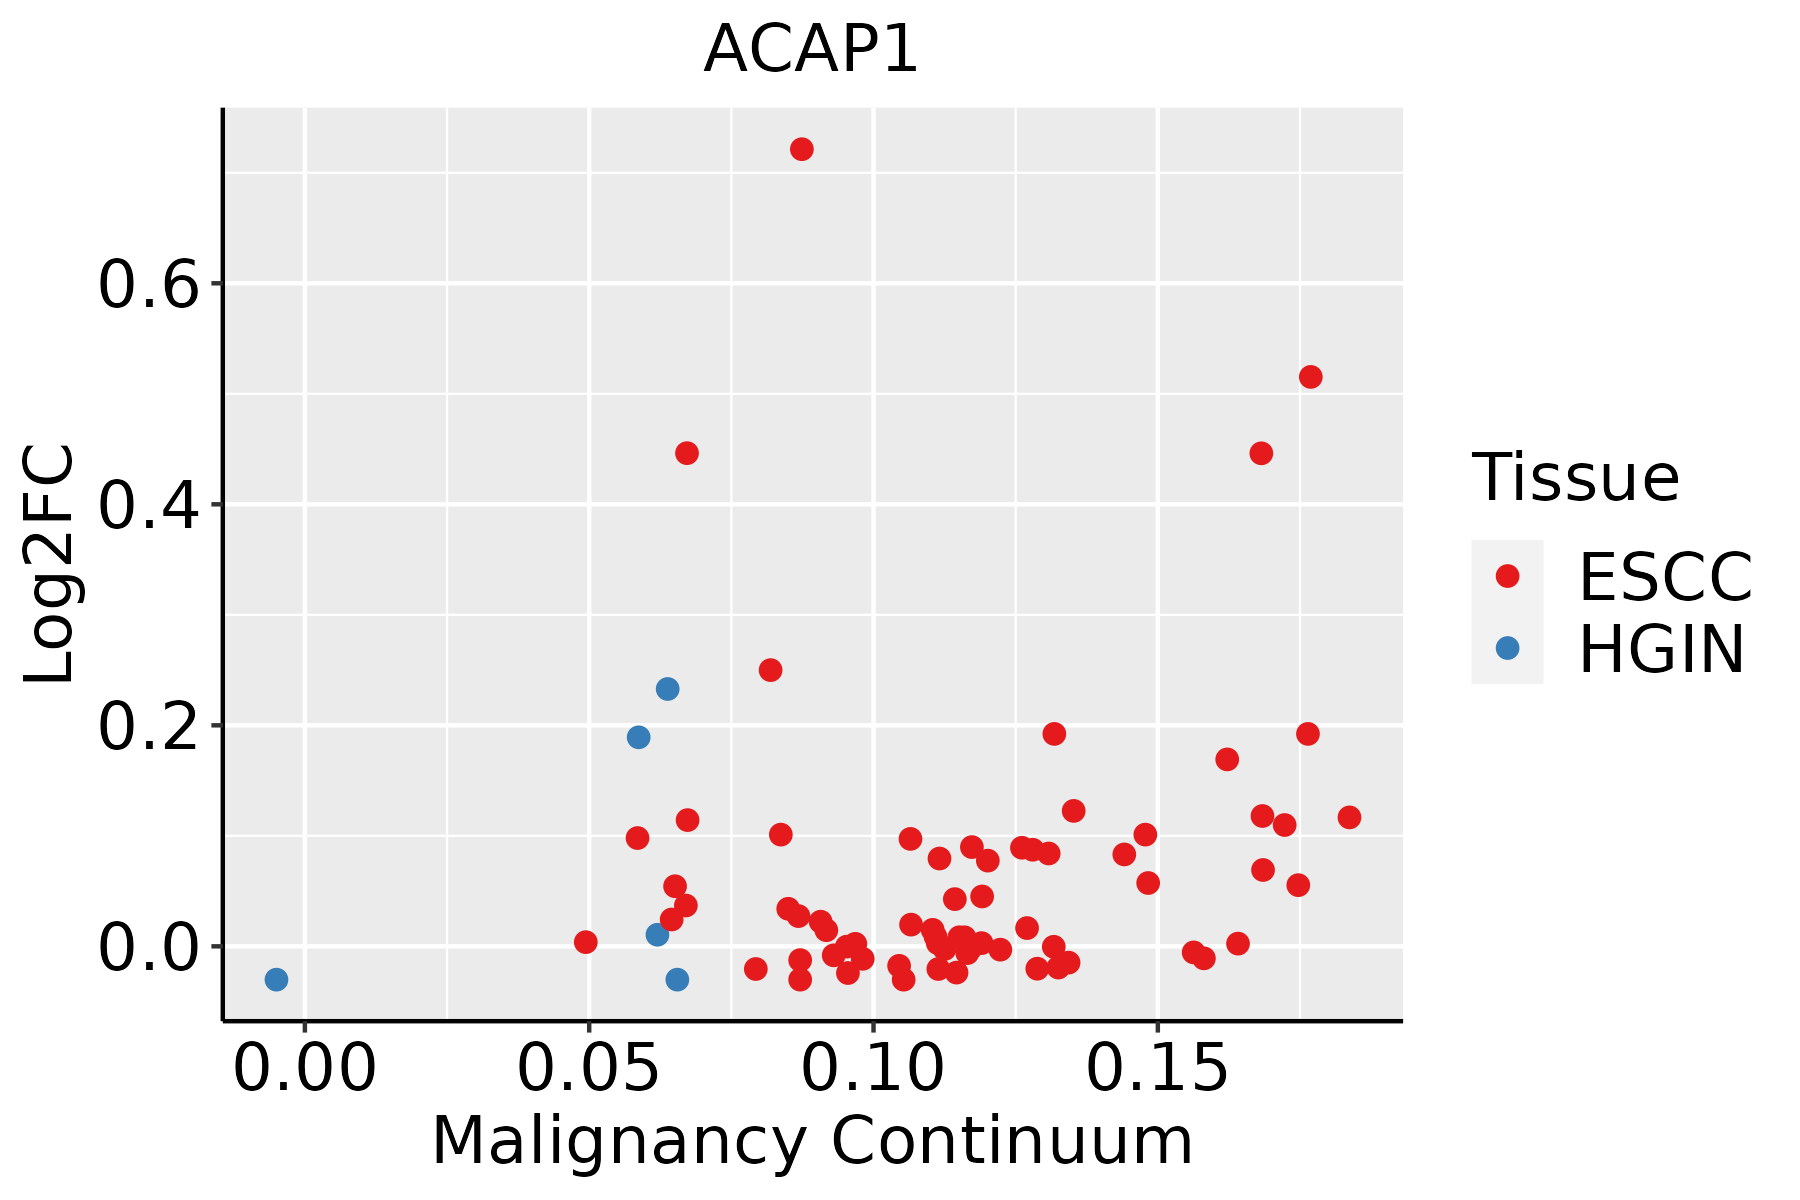 | ESCC: Esophageal squamous cell carcinoma |
| HGIN: High-grade intraepithelial neoplasias | ||
| LGIN: Low-grade intraepithelial neoplasias | ||
| Oral Cavity | 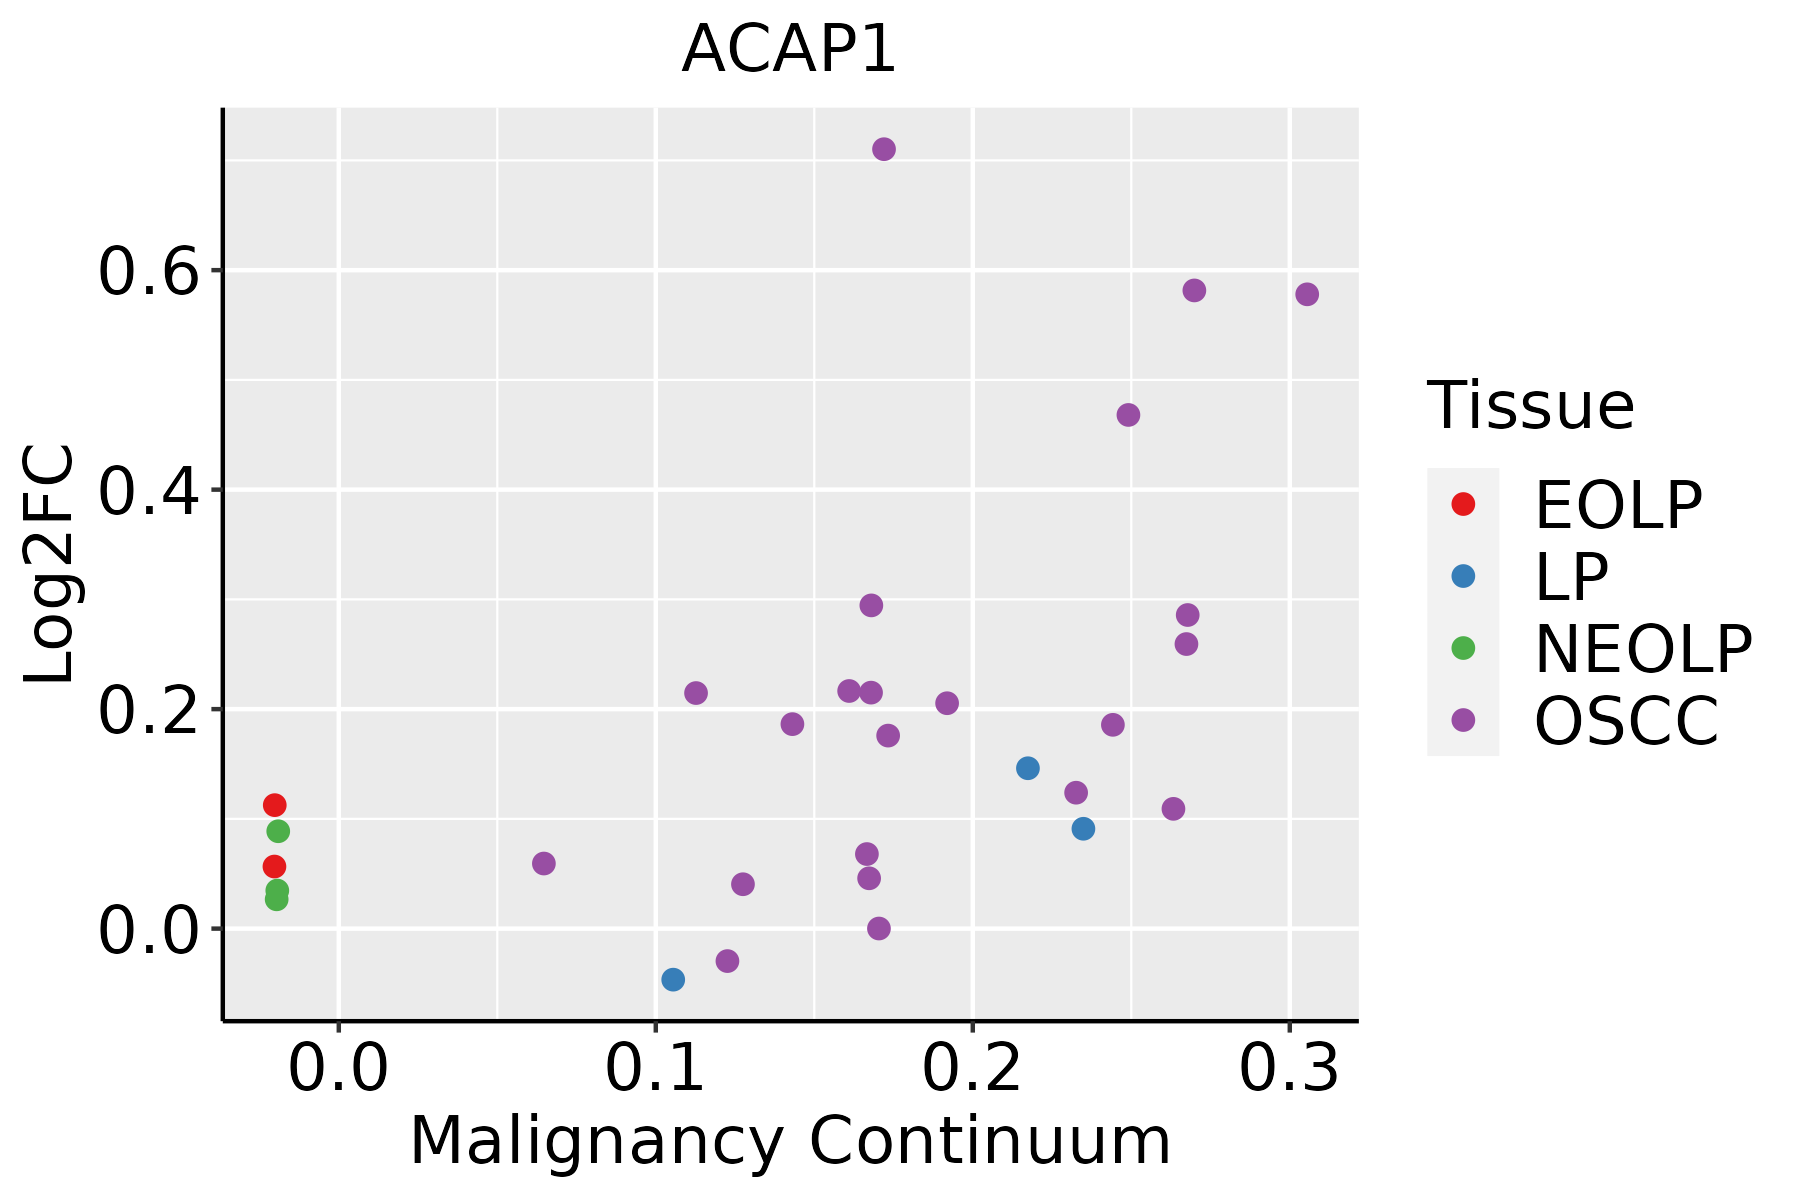 | EOLP: Erosive Oral lichen planus |
| LP: leukoplakia | ||
| NEOLP: Non-erosive oral lichen planus | ||
| OSCC: Oral squamous cell carcinoma | ||
| Thyroid | 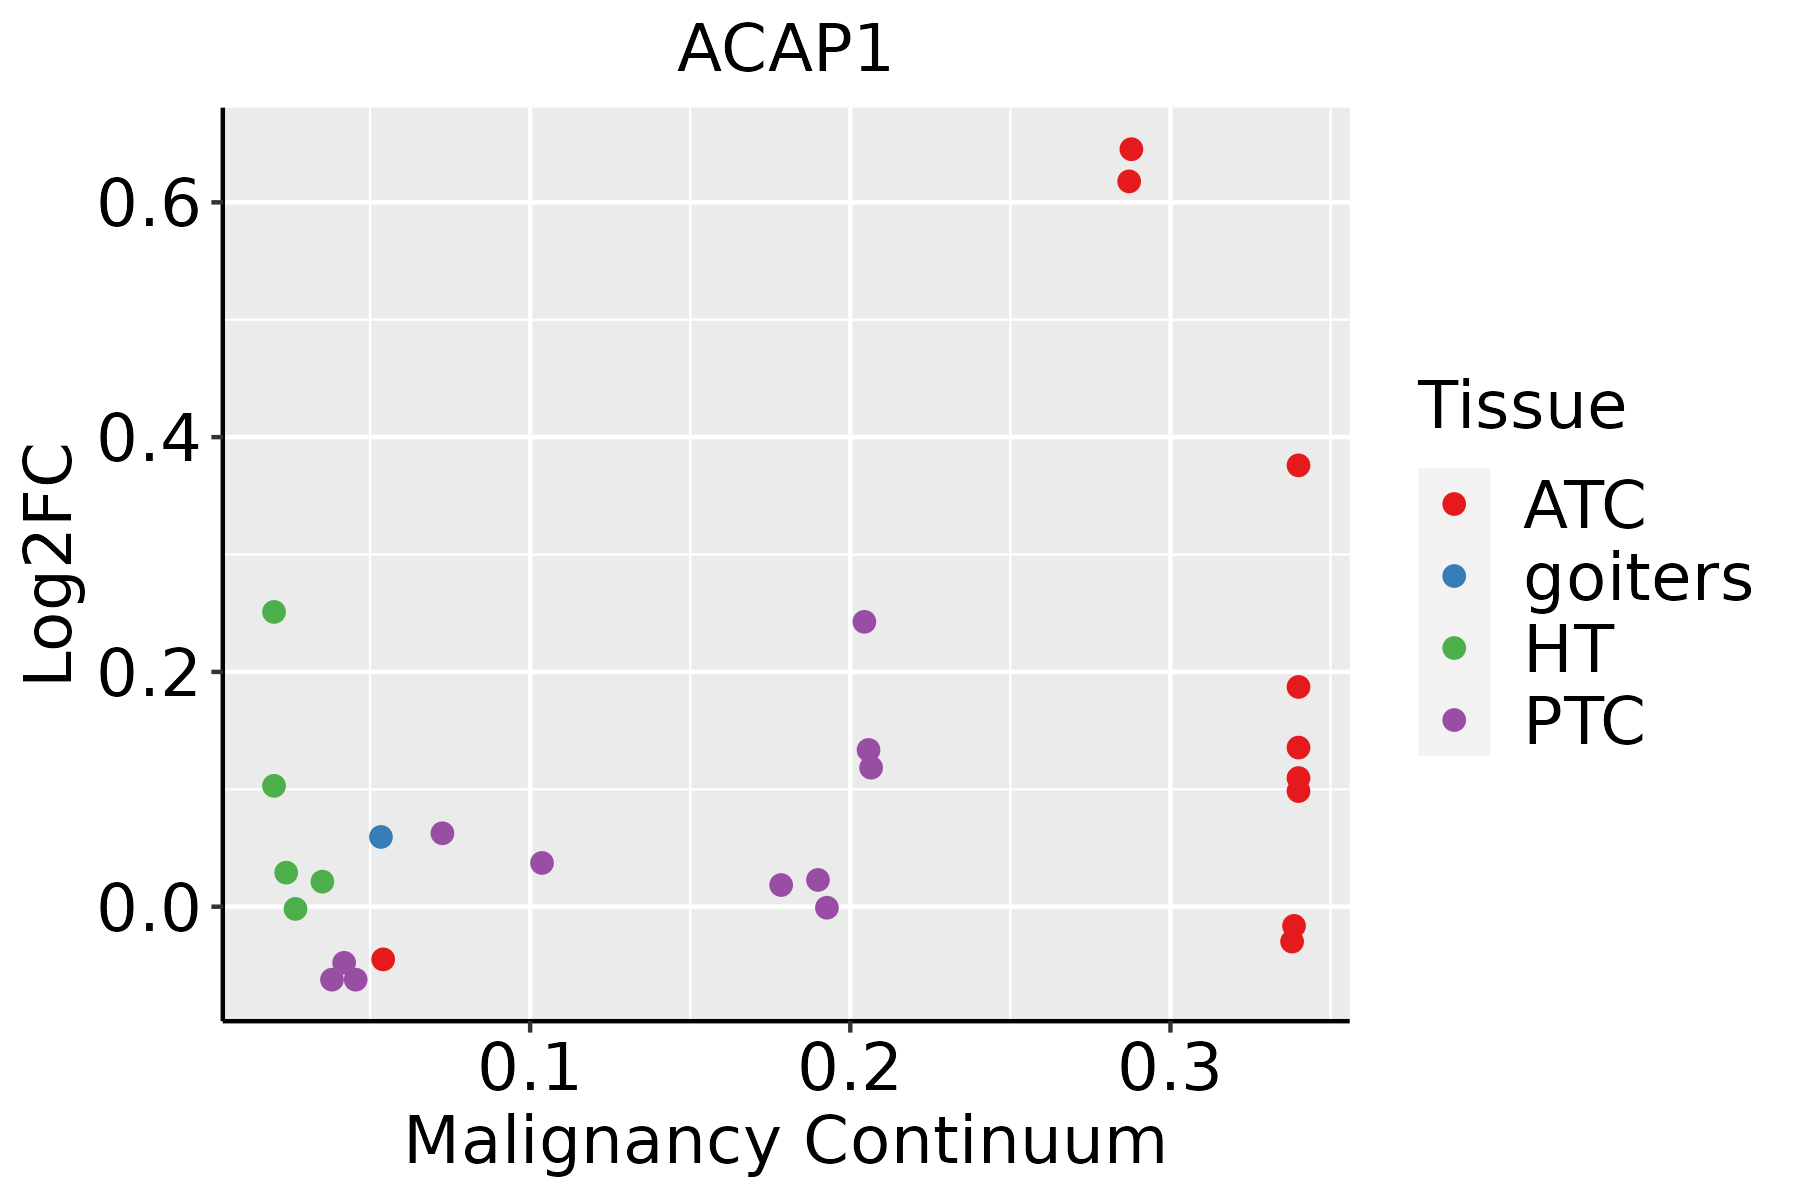 | ATC: Anaplastic thyroid cancer |
| HT: Hashimoto's thyroiditis | ||
| PTC: Papillary thyroid cancer |
| ∗log2FC in expression of this searched gene in stem-like cells from each diseased tissue sample relative to stem-like cells in normal samples in each tissue plotted against the malignancy continuum. Samples are colored based on if they are from different disease stage. |
Top |
Malignant transformation related pathway analysis |
| Find out the enriched GO biological processes and KEGG pathways involved in transition from healthy to precancer to cancer |
| Tissue | Disease Stage | Enriched GO biological Processes |
| Colorectum | AD |  |
| Colorectum | SER |  |
| Colorectum | MSS |  |
| Colorectum | MSI-H |  |
| Colorectum | FAP |  |
| ∗Top 15 enriched GO BP terms are showed in the bar plot of each disease state in each tissue. Each row represents a significant GO biological process which is colored according to the -log10(p.adjust). |
| Page: 1 2 3 4 5 6 7 8 9 |
| GO ID | Tissue | Disease Stage | Description | Gene Ratio | Bg Ratio | pvalue | p.adjust | Count |
| Page: 1 |
| Pathway ID | Tissue | Disease Stage | Description | Gene Ratio | Bg Ratio | pvalue | p.adjust | qvalue | Count |
| hsa04144210 | Esophagus | ESCC | Endocytosis | 186/4205 | 251/8465 | 9.74e-16 | 4.66e-14 | 2.39e-14 | 186 |
| hsa0414437 | Esophagus | ESCC | Endocytosis | 186/4205 | 251/8465 | 9.74e-16 | 4.66e-14 | 2.39e-14 | 186 |
| Page: 1 |
Top |
Cell-cell communication analysis |
| Identification of potential cell-cell interactions between two cell types and their ligand-receptor pairs for different disease states |
| Ligand | Receptor | LRpair | Pathway | Tissue | Disease Stage |
| Page: 1 |
Top |
Single-cell gene regulatory network inference analysis |
| Find out the significant the regulons (TFs) and the target genes of each regulon across cell types for different disease states |
| TF | Cell Type | Tissue | Disease Stage | Target Gene | RSS | Regulon Activity |
| ∗The dot plots of a searched regulon are shown for all cell subpopulations in each disease state of each tissue based on the regulon specific score inferred using pySCENIC and by calculating the average expression. |
| Page: 1 |
Top |
Somatic mutation of malignant transformation related genes |
| Annotation of somatic variants for genes involved in malignant transformation |
| Hugo Symbol | Variant Class | Variant Classification | dbSNP RS | HGVSc | HGVSp | HGVSp Short | SWISSPROT | BIOTYPE | SIFT | PolyPhen | Tumor Sample Barcode | Tissue | Histology | Sex | Age | Stage | Therapy Types | Drugs | Outcome |
| ACAP1 | SNV | Missense_Mutation | novel | c.1557N>G | p.Phe519Leu | p.F519L | Q15027 | protein_coding | deleterious(0.03) | probably_damaging(0.992) | TCGA-3C-AALI-01 | Breast | breast invasive carcinoma | Female | <65 | I/II | Unspecific | Poly E | Complete Response |
| ACAP1 | SNV | Missense_Mutation | novel | c.1285N>A | p.Glu429Lys | p.E429K | Q15027 | protein_coding | tolerated(0.05) | possibly_damaging(0.829) | TCGA-A7-A56D-01 | Breast | breast invasive carcinoma | Female | >=65 | I/II | Hormone Therapy | arimidex | SD |
| ACAP1 | SNV | Missense_Mutation | rs184747187 | c.362N>A | p.Arg121Gln | p.R121Q | Q15027 | protein_coding | deleterious(0.01) | benign(0.115) | TCGA-AN-A0AK-01 | Breast | breast invasive carcinoma | Female | >=65 | I/II | Unknown | Unknown | SD |
| ACAP1 | SNV | Missense_Mutation | c.541G>C | p.Glu181Gln | p.E181Q | Q15027 | protein_coding | tolerated(1) | benign(0.001) | TCGA-C8-A275-01 | Breast | breast invasive carcinoma | Female | <65 | I/II | Unknown | Unknown | SD | |
| ACAP1 | SNV | Missense_Mutation | novel | c.955C>T | p.Leu319Phe | p.L319F | Q15027 | protein_coding | tolerated(0.12) | possibly_damaging(0.855) | TCGA-EW-A3U0-01 | Breast | breast invasive carcinoma | Female | <65 | III/IV | Chemotherapy | cisplatin | CR |
| ACAP1 | insertion | Nonsense_Mutation | novel | c.181_182insATAAATAAACTCTATAGATCCTACTTTGATTTTACATTT | p.Val61delinsAspLysTerThrLeuTerIleLeuLeuTerPheTyrIlePhe | p.V61delinsDK*TL*ILL*FYIF | Q15027 | protein_coding | TCGA-AN-A0FN-01 | Breast | breast invasive carcinoma | Female | <65 | I/II | Unknown | Unknown | SD | ||
| ACAP1 | SNV | Missense_Mutation | c.1688C>T | p.Ser563Phe | p.S563F | Q15027 | protein_coding | tolerated(0.1) | benign(0.365) | TCGA-DS-A0VK-01 | Cervix | cervical & endocervical cancer | Female | <65 | I/II | Chemotherapy | carboplatin | PD | |
| ACAP1 | SNV | Missense_Mutation | c.1836C>G | p.Ile612Met | p.I612M | Q15027 | protein_coding | tolerated(0.11) | probably_damaging(0.991) | TCGA-DS-A0VK-01 | Cervix | cervical & endocervical cancer | Female | <65 | I/II | Chemotherapy | carboplatin | PD | |
| ACAP1 | SNV | Missense_Mutation | novel | c.2005C>G | p.Arg669Gly | p.R669G | Q15027 | protein_coding | tolerated(0.38) | benign(0.297) | TCGA-DS-A0VN-01 | Cervix | cervical & endocervical cancer | Female | <65 | I/II | Chemotherapy | cisplatin | SD |
| ACAP1 | insertion | Frame_Shift_Ins | novel | c.611_612insCT | p.Gln204HisfsTer8 | p.Q204Hfs*8 | Q15027 | protein_coding | TCGA-DS-A1OB-01 | Cervix | cervical & endocervical cancer | Female | <65 | I/II | Chemotherapy | carboplatin | PD |
| Page: 1 2 3 4 5 6 7 8 |
Top |
Related drugs of malignant transformation related genes |
| Identification of chemicals and drugs interact with genes involved in malignant transfromation |
| (DGIdb 4.0) |
| Entrez ID | Symbol | Category | Interaction Types | Drug Claim Name | Drug Name | PMIDs |
| Page: 1 |

Copyright 2023-Present -The University of Texas Health Science Center at Houston |