
|
|||||
|
 | |
| |
| |
| |
| |
| |
|
Gene: ACADSB |
Gene summary for ACADSB |
| Gene information | Species | Human | Gene symbol | ACADSB | Gene ID | 36 |
| Gene name | acyl-CoA dehydrogenase short/branched chain | |
| Gene Alias | 2-MEBCAD | |
| Cytomap | 10q26.13 | |
| Gene Type | protein-coding | GO ID | GO:0006082 | UniProtAcc | P45954 |
Top |
Malignant transformation analysis |
| Identification of the aberrant gene expression in precancerous and cancerous lesions by comparing the gene expression of stem-like cells in diseased tissues with normal stem cells |
| Entrez ID | Symbol | Replicates | Species | Organ | Tissue | Adj P-value | Log2FC | Malignancy |
| 36 | ACADSB | NAFLD1 | Human | Liver | NAFLD | 7.22e-05 | 5.50e-01 | -0.04 |
| 36 | ACADSB | S43 | Human | Liver | Cirrhotic | 1.22e-02 | -5.00e-02 | -0.0187 |
| 36 | ACADSB | HCC1_Meng | Human | Liver | HCC | 2.87e-43 | 1.93e-02 | 0.0246 |
| 36 | ACADSB | HCC2_Meng | Human | Liver | HCC | 1.49e-07 | -7.07e-02 | 0.0107 |
| 36 | ACADSB | HCC1 | Human | Liver | HCC | 1.52e-26 | 5.17e+00 | 0.5336 |
| 36 | ACADSB | HCC2 | Human | Liver | HCC | 7.15e-59 | 5.81e+00 | 0.5341 |
| 36 | ACADSB | Pt13.b | Human | Liver | HCC | 3.23e-02 | 7.03e-03 | 0.0251 |
| 36 | ACADSB | Pt14.b | Human | Liver | HCC | 8.80e-06 | 3.84e-01 | 0.018 |
| 36 | ACADSB | S029 | Human | Liver | HCC | 6.24e-05 | 3.92e-01 | 0.2581 |
| Page: 1 |
| Tissue | Expression Dynamics | Abbreviation |
| Liver | 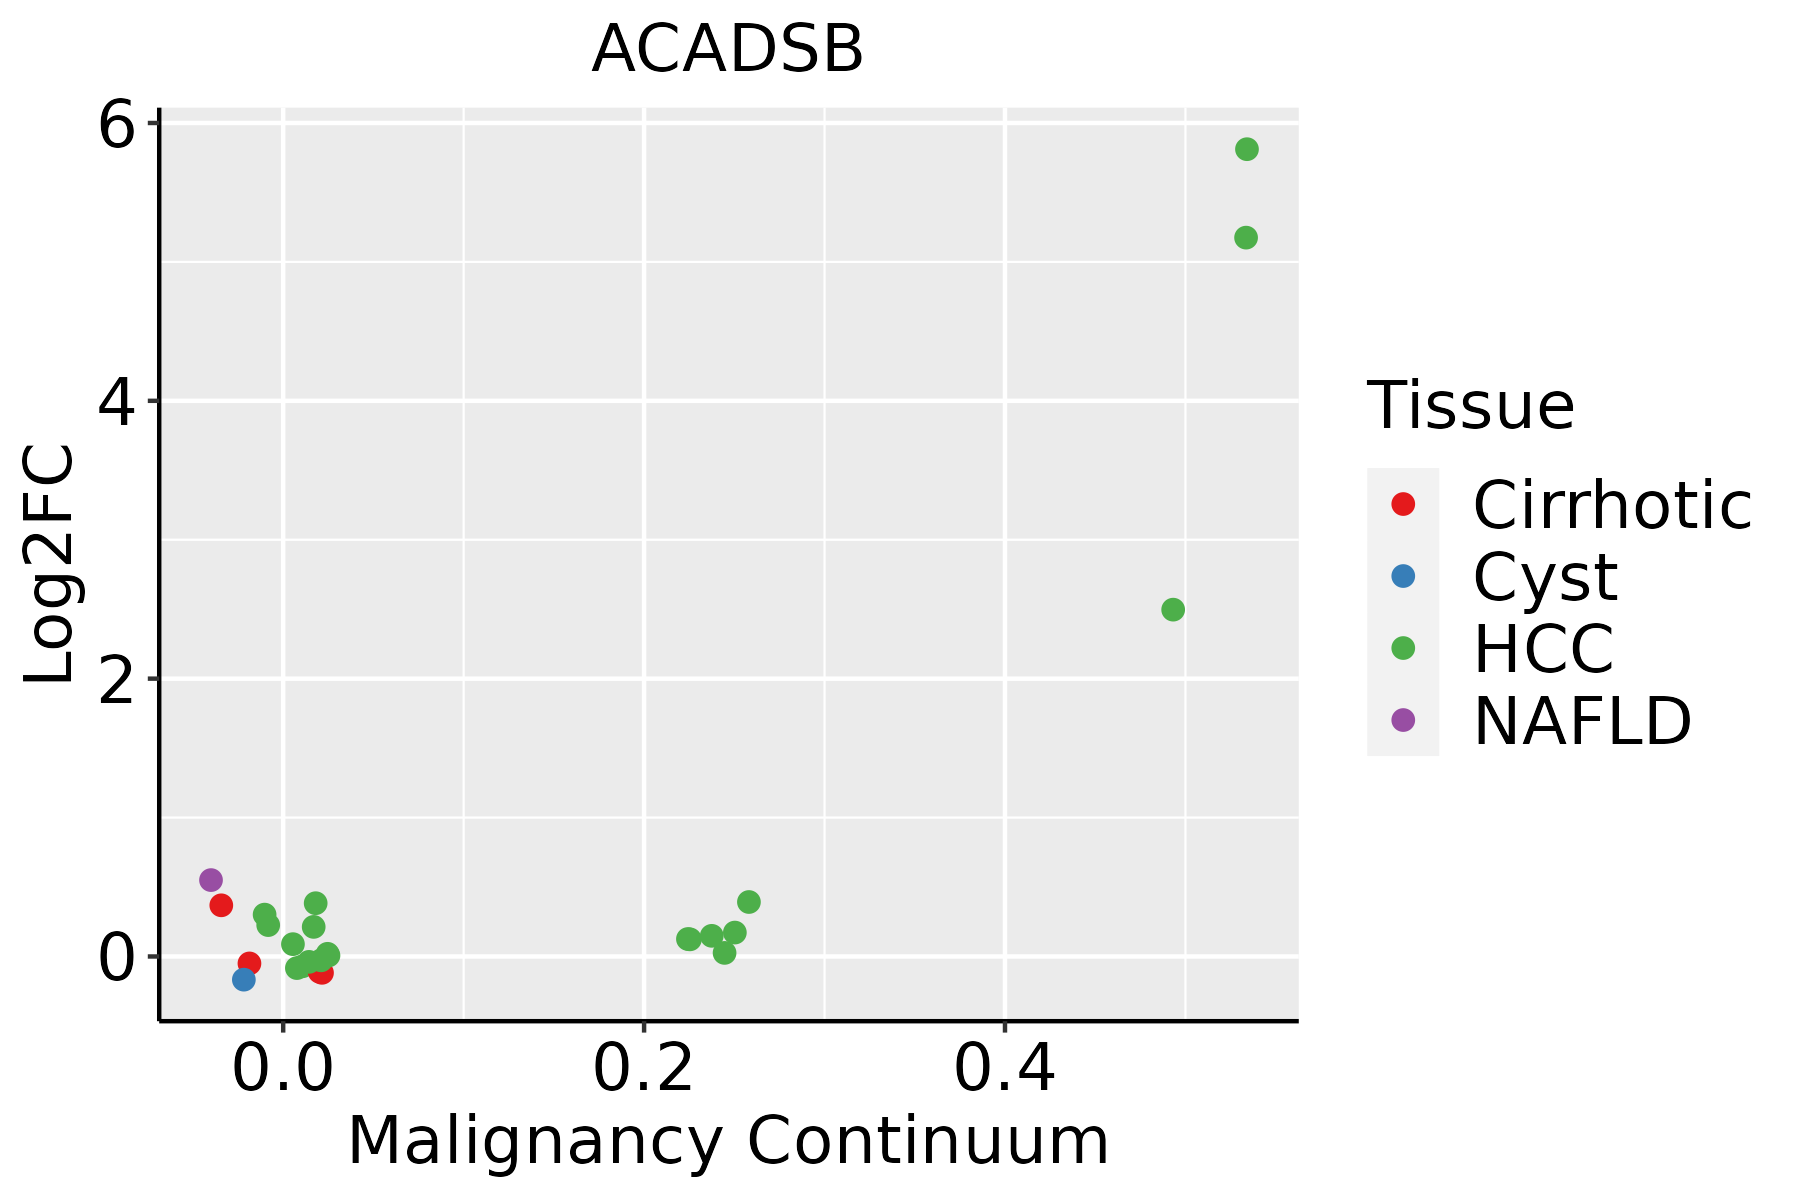 | HCC: Hepatocellular carcinoma |
| NAFLD: Non-alcoholic fatty liver disease |
| ∗log2FC in expression of this searched gene in stem-like cells from each diseased tissue sample relative to stem-like cells in normal samples in each tissue plotted against the malignancy continuum. Samples are colored based on if they are from different disease stage. |
Top |
Malignant transformation related pathway analysis |
| Find out the enriched GO biological processes and KEGG pathways involved in transition from healthy to precancer to cancer |
| Tissue | Disease Stage | Enriched GO biological Processes |
| Colorectum | AD |  |
| Colorectum | SER |  |
| Colorectum | MSS |  |
| Colorectum | MSI-H |  |
| Colorectum | FAP |  |
| ∗Top 15 enriched GO BP terms are showed in the bar plot of each disease state in each tissue. Each row represents a significant GO biological process which is colored according to the -log10(p.adjust). |
| Page: 1 2 3 4 5 6 7 8 9 |
| GO ID | Tissue | Disease Stage | Description | Gene Ratio | Bg Ratio | pvalue | p.adjust | Count |
| GO:00463953 | Liver | NAFLD | carboxylic acid catabolic process | 73/1882 | 236/18723 | 4.16e-19 | 1.22e-15 | 73 |
| GO:00160544 | Liver | NAFLD | organic acid catabolic process | 73/1882 | 240/18723 | 1.20e-18 | 2.34e-15 | 73 |
| GO:00442825 | Liver | NAFLD | small molecule catabolic process | 91/1882 | 376/18723 | 8.96e-16 | 1.31e-12 | 91 |
| GO:00066316 | Liver | NAFLD | fatty acid metabolic process | 92/1882 | 390/18723 | 3.38e-15 | 3.29e-12 | 92 |
| GO:0009063 | Liver | NAFLD | cellular amino acid catabolic process | 36/1882 | 110/18723 | 6.56e-11 | 1.99e-08 | 36 |
| GO:00065203 | Liver | NAFLD | cellular amino acid metabolic process | 63/1882 | 284/18723 | 1.14e-09 | 2.17e-07 | 63 |
| GO:19016053 | Liver | NAFLD | alpha-amino acid metabolic process | 46/1882 | 195/18723 | 2.74e-08 | 2.86e-06 | 46 |
| GO:1901606 | Liver | NAFLD | alpha-amino acid catabolic process | 25/1882 | 87/18723 | 8.67e-07 | 4.60e-05 | 25 |
| GO:00090813 | Liver | NAFLD | branched-chain amino acid metabolic process | 8/1882 | 19/18723 | 2.81e-04 | 4.51e-03 | 8 |
| GO:00090834 | Liver | NAFLD | branched-chain amino acid catabolic process | 7/1882 | 15/18723 | 3.18e-04 | 4.95e-03 | 7 |
| GO:000663112 | Liver | Cirrhotic | fatty acid metabolic process | 165/4634 | 390/18723 | 1.29e-14 | 1.26e-12 | 165 |
| GO:004428211 | Liver | Cirrhotic | small molecule catabolic process | 151/4634 | 376/18723 | 2.20e-11 | 1.34e-09 | 151 |
| GO:001605411 | Liver | Cirrhotic | organic acid catabolic process | 104/4634 | 240/18723 | 1.91e-10 | 9.53e-09 | 104 |
| GO:004639511 | Liver | Cirrhotic | carboxylic acid catabolic process | 102/4634 | 236/18723 | 3.41e-10 | 1.63e-08 | 102 |
| GO:19016051 | Liver | Cirrhotic | alpha-amino acid metabolic process | 82/4634 | 195/18723 | 7.72e-08 | 2.30e-06 | 82 |
| GO:00090631 | Liver | Cirrhotic | cellular amino acid catabolic process | 49/4634 | 110/18723 | 4.47e-06 | 7.42e-05 | 49 |
| GO:000652011 | Liver | Cirrhotic | cellular amino acid metabolic process | 103/4634 | 284/18723 | 8.88e-06 | 1.30e-04 | 103 |
| GO:000908111 | Liver | Cirrhotic | branched-chain amino acid metabolic process | 14/4634 | 19/18723 | 1.00e-05 | 1.45e-04 | 14 |
| GO:000908311 | Liver | Cirrhotic | branched-chain amino acid catabolic process | 11/4634 | 15/18723 | 1.04e-04 | 1.07e-03 | 11 |
| GO:19016061 | Liver | Cirrhotic | alpha-amino acid catabolic process | 36/4634 | 87/18723 | 4.69e-04 | 3.78e-03 | 36 |
| Page: 1 2 |
| Pathway ID | Tissue | Disease Stage | Description | Gene Ratio | Bg Ratio | pvalue | p.adjust | qvalue | Count |
| hsa002806 | Liver | NAFLD | Valine, leucine and isoleucine degradation | 20/1043 | 48/8465 | 3.03e-07 | 1.65e-05 | 1.33e-05 | 20 |
| hsa012126 | Liver | NAFLD | Fatty acid metabolism | 17/1043 | 57/8465 | 3.43e-04 | 5.93e-03 | 4.78e-03 | 17 |
| hsa000718 | Liver | NAFLD | Fatty acid degradation | 13/1043 | 43/8465 | 1.46e-03 | 1.71e-02 | 1.38e-02 | 13 |
| hsa0028011 | Liver | NAFLD | Valine, leucine and isoleucine degradation | 20/1043 | 48/8465 | 3.03e-07 | 1.65e-05 | 1.33e-05 | 20 |
| hsa0121211 | Liver | NAFLD | Fatty acid metabolism | 17/1043 | 57/8465 | 3.43e-04 | 5.93e-03 | 4.78e-03 | 17 |
| hsa0007111 | Liver | NAFLD | Fatty acid degradation | 13/1043 | 43/8465 | 1.46e-03 | 1.71e-02 | 1.38e-02 | 13 |
| hsa0028021 | Liver | Cirrhotic | Valine, leucine and isoleucine degradation | 32/2530 | 48/8465 | 1.45e-07 | 2.02e-06 | 1.24e-06 | 32 |
| hsa0007121 | Liver | Cirrhotic | Fatty acid degradation | 29/2530 | 43/8465 | 3.87e-07 | 4.95e-06 | 3.05e-06 | 29 |
| hsa012122 | Liver | Cirrhotic | Fatty acid metabolism | 32/2530 | 57/8465 | 3.12e-05 | 2.47e-04 | 1.52e-04 | 32 |
| hsa0028031 | Liver | Cirrhotic | Valine, leucine and isoleucine degradation | 32/2530 | 48/8465 | 1.45e-07 | 2.02e-06 | 1.24e-06 | 32 |
| hsa0007131 | Liver | Cirrhotic | Fatty acid degradation | 29/2530 | 43/8465 | 3.87e-07 | 4.95e-06 | 3.05e-06 | 29 |
| hsa012123 | Liver | Cirrhotic | Fatty acid metabolism | 32/2530 | 57/8465 | 3.12e-05 | 2.47e-04 | 1.52e-04 | 32 |
| hsa0028041 | Liver | HCC | Valine, leucine and isoleucine degradation | 41/4020 | 48/8465 | 4.84e-08 | 7.05e-07 | 3.92e-07 | 41 |
| hsa012124 | Liver | HCC | Fatty acid metabolism | 45/4020 | 57/8465 | 1.05e-06 | 1.10e-05 | 6.09e-06 | 45 |
| hsa0007141 | Liver | HCC | Fatty acid degradation | 33/4020 | 43/8465 | 8.41e-05 | 4.27e-04 | 2.37e-04 | 33 |
| hsa0028051 | Liver | HCC | Valine, leucine and isoleucine degradation | 41/4020 | 48/8465 | 4.84e-08 | 7.05e-07 | 3.92e-07 | 41 |
| hsa012125 | Liver | HCC | Fatty acid metabolism | 45/4020 | 57/8465 | 1.05e-06 | 1.10e-05 | 6.09e-06 | 45 |
| hsa0007151 | Liver | HCC | Fatty acid degradation | 33/4020 | 43/8465 | 8.41e-05 | 4.27e-04 | 2.37e-04 | 33 |
| Page: 1 |
Top |
Cell-cell communication analysis |
| Identification of potential cell-cell interactions between two cell types and their ligand-receptor pairs for different disease states |
| Ligand | Receptor | LRpair | Pathway | Tissue | Disease Stage |
| Page: 1 |
Top |
Single-cell gene regulatory network inference analysis |
| Find out the significant the regulons (TFs) and the target genes of each regulon across cell types for different disease states |
| TF | Cell Type | Tissue | Disease Stage | Target Gene | RSS | Regulon Activity |
| ∗The dot plots of a searched regulon are shown for all cell subpopulations in each disease state of each tissue based on the regulon specific score inferred using pySCENIC and by calculating the average expression. |
| Page: 1 |
Top |
Somatic mutation of malignant transformation related genes |
| Annotation of somatic variants for genes involved in malignant transformation |
| Hugo Symbol | Variant Class | Variant Classification | dbSNP RS | HGVSc | HGVSp | HGVSp Short | SWISSPROT | BIOTYPE | SIFT | PolyPhen | Tumor Sample Barcode | Tissue | Histology | Sex | Age | Stage | Therapy Types | Drugs | Outcome |
| ACADSB | SNV | Missense_Mutation | c.690N>T | p.Lys230Asn | p.K230N | P45954 | protein_coding | deleterious(0) | possibly_damaging(0.872) | TCGA-A8-A09Z-01 | Breast | breast invasive carcinoma | Female | >=65 | I/II | Unknown | Unknown | SD | |
| ACADSB | SNV | Missense_Mutation | c.17N>C | p.Val6Ala | p.V6A | P45954 | protein_coding | tolerated_low_confidence(0.47) | benign(0) | TCGA-AR-A0TR-01 | Breast | breast invasive carcinoma | Female | >=65 | I/II | Hormone Therapy | tamoxiphen | SD | |
| ACADSB | SNV | Missense_Mutation | rs761098384 | c.733N>T | p.His245Tyr | p.H245Y | P45954 | protein_coding | deleterious(0.03) | benign(0.107) | TCGA-C8-A12T-01 | Breast | breast invasive carcinoma | Female | <65 | I/II | Unknown | Unknown | SD |
| ACADSB | SNV | Missense_Mutation | c.349T>C | p.Ser117Pro | p.S117P | P45954 | protein_coding | tolerated(0.06) | probably_damaging(0.957) | TCGA-GM-A2DB-01 | Breast | breast invasive carcinoma | Female | <65 | I/II | Chemotherapy | taxol | CR | |
| ACADSB | insertion | Frame_Shift_Ins | novel | c.1269_1270insTCTTACCTCGTCCTTCAAAAAAAATTGTTCTATATTTTTAAAAA | p.Ile424SerfsTer85 | p.I424Sfs*85 | P45954 | protein_coding | TCGA-AN-A0AR-01 | Breast | breast invasive carcinoma | Female | <65 | I/II | Unknown | Unknown | SD | ||
| ACADSB | SNV | Missense_Mutation | rs772084235 | c.1145N>T | p.Thr382Met | p.T382M | P45954 | protein_coding | deleterious(0) | probably_damaging(0.995) | TCGA-AA-3864-01 | Colorectum | colon adenocarcinoma | Male | >=65 | I/II | Unknown | Unknown | SD |
| ACADSB | SNV | Missense_Mutation | novel | c.591T>G | p.Asp197Glu | p.D197E | P45954 | protein_coding | deleterious(0.04) | benign(0.018) | TCGA-AA-3947-01 | Colorectum | colon adenocarcinoma | Female | <65 | I/II | Unknown | Unknown | SD |
| ACADSB | SNV | Missense_Mutation | c.520N>G | p.Phe174Val | p.F174V | P45954 | protein_coding | deleterious(0.02) | possibly_damaging(0.718) | TCGA-AA-3984-01 | Colorectum | colon adenocarcinoma | Female | <65 | I/II | Unknown | Unknown | SD | |
| ACADSB | SNV | Missense_Mutation | novel | c.1048N>G | p.Thr350Ala | p.T350A | P45954 | protein_coding | deleterious(0.03) | benign(0.211) | TCGA-AA-3984-01 | Colorectum | colon adenocarcinoma | Female | <65 | I/II | Unknown | Unknown | SD |
| ACADSB | SNV | Missense_Mutation | novel | c.811C>T | p.Pro271Ser | p.P271S | P45954 | protein_coding | deleterious(0.02) | benign(0.04) | TCGA-AA-A024-01 | Colorectum | colon adenocarcinoma | Male | >=65 | I/II | Unknown | Unknown | SD |
| Page: 1 2 3 4 5 |
Top |
Related drugs of malignant transformation related genes |
| Identification of chemicals and drugs interact with genes involved in malignant transfromation |
| (DGIdb 4.0) |
| Entrez ID | Symbol | Category | Interaction Types | Drug Claim Name | Drug Name | PMIDs |
| 36 | ACADSB | ENZYME | VALPROIC ACID |
| Page: 1 |

Copyright 2023-Present -The University of Texas Health Science Center at Houston |