
|
|||||
|
 | |
| |
| |
| |
| |
| |
|
Gene: ACADS |
Gene summary for ACADS |
| Gene information | Species | Human | Gene symbol | ACADS | Gene ID | 35 |
| Gene name | acyl-CoA dehydrogenase short chain | |
| Gene Alias | ACAD3 | |
| Cytomap | 12q24.31 | |
| Gene Type | protein-coding | GO ID | GO:0006082 | UniProtAcc | E5KSD5 |
Top |
Malignant transformation analysis |
| Identification of the aberrant gene expression in precancerous and cancerous lesions by comparing the gene expression of stem-like cells in diseased tissues with normal stem cells |
| Entrez ID | Symbol | Replicates | Species | Organ | Tissue | Adj P-value | Log2FC | Malignancy |
| 35 | ACADS | HTA11_347_2000001011 | Human | Colorectum | AD | 9.38e-11 | 4.22e-01 | -0.1954 |
| 35 | ACADS | HTA11_83_2000001011 | Human | Colorectum | SER | 2.28e-06 | 5.93e-01 | -0.1526 |
| 35 | ACADS | HTA11_696_2000001011 | Human | Colorectum | AD | 1.55e-12 | 4.19e-01 | -0.1464 |
| 35 | ACADS | HTA11_866_2000001011 | Human | Colorectum | AD | 3.55e-05 | 2.94e-01 | -0.1001 |
| 35 | ACADS | HTA11_1391_2000001011 | Human | Colorectum | AD | 9.65e-06 | 3.62e-01 | -0.059 |
| 35 | ACADS | HTA11_10623_2000001011 | Human | Colorectum | AD | 2.37e-04 | 5.64e-01 | -0.0177 |
| 35 | ACADS | A015-C-203 | Human | Colorectum | FAP | 1.27e-03 | 1.46e-01 | -0.1294 |
| 35 | ACADS | A002-C-205 | Human | Colorectum | FAP | 1.17e-03 | -1.43e-01 | -0.1236 |
| 35 | ACADS | A015-C-104 | Human | Colorectum | FAP | 6.04e-03 | 6.92e-02 | -0.1899 |
| 35 | ACADS | A002-C-116 | Human | Colorectum | FAP | 9.33e-06 | -2.01e-01 | -0.0452 |
| 35 | ACADS | LZE4T | Human | Esophagus | ESCC | 7.24e-04 | 8.20e-02 | 0.0811 |
| 35 | ACADS | LZE7T | Human | Esophagus | ESCC | 7.02e-09 | 2.21e-01 | 0.0667 |
| 35 | ACADS | LZE8T | Human | Esophagus | ESCC | 2.79e-07 | 1.39e-01 | 0.067 |
| 35 | ACADS | LZE20T | Human | Esophagus | ESCC | 2.05e-07 | 1.36e-01 | 0.0662 |
| 35 | ACADS | LZE24T | Human | Esophagus | ESCC | 2.72e-15 | 3.20e-01 | 0.0596 |
| 35 | ACADS | P1T-E | Human | Esophagus | ESCC | 1.31e-13 | 3.37e-01 | 0.0875 |
| 35 | ACADS | P2T-E | Human | Esophagus | ESCC | 1.21e-24 | 4.24e-01 | 0.1177 |
| 35 | ACADS | P4T-E | Human | Esophagus | ESCC | 4.29e-20 | 4.58e-01 | 0.1323 |
| 35 | ACADS | P5T-E | Human | Esophagus | ESCC | 1.07e-10 | 2.30e-01 | 0.1327 |
| 35 | ACADS | P8T-E | Human | Esophagus | ESCC | 2.95e-22 | 4.09e-01 | 0.0889 |
| Page: 1 2 3 4 5 6 |
| Tissue | Expression Dynamics | Abbreviation |
| Colorectum (GSE201348) |  | FAP: Familial adenomatous polyposis |
| CRC: Colorectal cancer | ||
| Colorectum (HTA11) |  | AD: Adenomas |
| SER: Sessile serrated lesions | ||
| MSI-H: Microsatellite-high colorectal cancer | ||
| MSS: Microsatellite stable colorectal cancer | ||
| Esophagus |  | ESCC: Esophageal squamous cell carcinoma |
| HGIN: High-grade intraepithelial neoplasias | ||
| LGIN: Low-grade intraepithelial neoplasias | ||
| GC |  | CAG: Chronic atrophic gastritis |
| CAG with IM: Chronic atrophic gastritis with intestinal metaplasia | ||
| CSG: Chronic superficial gastritis | ||
| GC: Gastric cancer | ||
| SIM: Severe intestinal metaplasia | ||
| WIM: Wild intestinal metaplasia | ||
| Liver |  | HCC: Hepatocellular carcinoma |
| NAFLD: Non-alcoholic fatty liver disease | ||
| Oral Cavity | 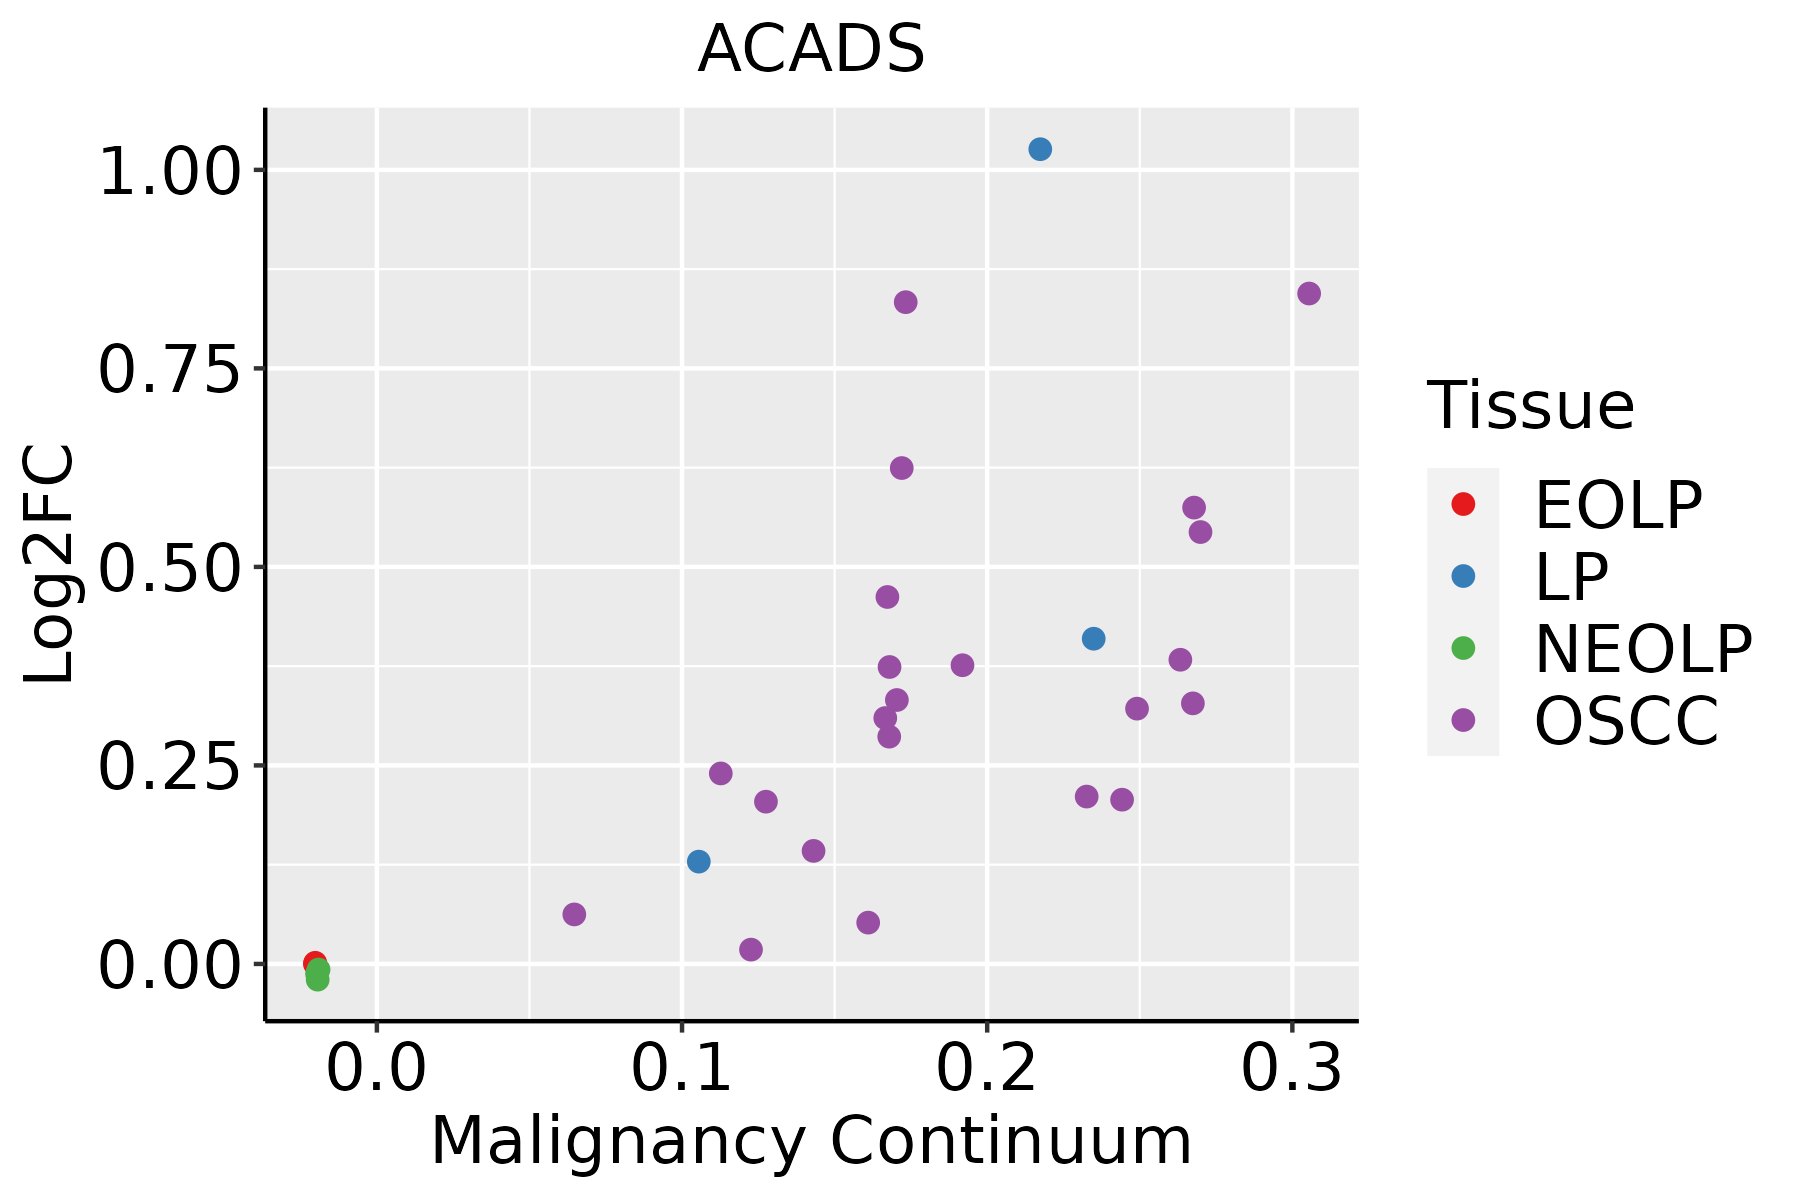 | EOLP: Erosive Oral lichen planus |
| LP: leukoplakia | ||
| NEOLP: Non-erosive oral lichen planus | ||
| OSCC: Oral squamous cell carcinoma |
| ∗log2FC in expression of this searched gene in stem-like cells from each diseased tissue sample relative to stem-like cells in normal samples in each tissue plotted against the malignancy continuum. Samples are colored based on if they are from different disease stage. |
Top |
Malignant transformation related pathway analysis |
| Find out the enriched GO biological processes and KEGG pathways involved in transition from healthy to precancer to cancer |
| Tissue | Disease Stage | Enriched GO biological Processes |
| Colorectum | AD |  |
| Colorectum | SER |  |
| Colorectum | MSS |  |
| Colorectum | MSI-H |  |
| Colorectum | FAP |  |
| ∗Top 15 enriched GO BP terms are showed in the bar plot of each disease state in each tissue. Each row represents a significant GO biological process which is colored according to the -log10(p.adjust). |
| Page: 1 2 3 4 5 6 7 8 9 |
| GO ID | Tissue | Disease Stage | Description | Gene Ratio | Bg Ratio | pvalue | p.adjust | Count |
| GO:0044282 | Colorectum | AD | small molecule catabolic process | 118/3918 | 376/18723 | 1.05e-06 | 3.55e-05 | 118 |
| GO:0006635 | Colorectum | AD | fatty acid beta-oxidation | 33/3918 | 74/18723 | 3.98e-06 | 1.09e-04 | 33 |
| GO:0009062 | Colorectum | AD | fatty acid catabolic process | 41/3918 | 100/18723 | 4.02e-06 | 1.09e-04 | 41 |
| GO:0019395 | Colorectum | AD | fatty acid oxidation | 40/3918 | 103/18723 | 2.43e-05 | 4.69e-04 | 40 |
| GO:0016042 | Colorectum | AD | lipid catabolic process | 97/3918 | 320/18723 | 4.31e-05 | 7.56e-04 | 97 |
| GO:0006631 | Colorectum | AD | fatty acid metabolic process | 114/3918 | 390/18723 | 5.58e-05 | 9.44e-04 | 114 |
| GO:0072329 | Colorectum | AD | monocarboxylic acid catabolic process | 44/3918 | 122/18723 | 8.05e-05 | 1.28e-03 | 44 |
| GO:0034440 | Colorectum | AD | lipid oxidation | 40/3918 | 108/18723 | 8.52e-05 | 1.32e-03 | 40 |
| GO:0030258 | Colorectum | AD | lipid modification | 67/3918 | 212/18723 | 1.66e-04 | 2.27e-03 | 67 |
| GO:0016054 | Colorectum | AD | organic acid catabolic process | 73/3918 | 240/18723 | 3.20e-04 | 3.81e-03 | 73 |
| GO:0044242 | Colorectum | AD | cellular lipid catabolic process | 66/3918 | 214/18723 | 3.96e-04 | 4.50e-03 | 66 |
| GO:0046395 | Colorectum | AD | carboxylic acid catabolic process | 70/3918 | 236/18723 | 9.06e-04 | 8.71e-03 | 70 |
| GO:0046459 | Colorectum | AD | short-chain fatty acid metabolic process | 8/3918 | 15/18723 | 5.67e-03 | 3.64e-02 | 8 |
| GO:00160421 | Colorectum | SER | lipid catabolic process | 77/2897 | 320/18723 | 3.52e-05 | 9.18e-04 | 77 |
| GO:00442821 | Colorectum | SER | small molecule catabolic process | 87/2897 | 376/18723 | 5.31e-05 | 1.27e-03 | 87 |
| GO:00090621 | Colorectum | SER | fatty acid catabolic process | 31/2897 | 100/18723 | 7.09e-05 | 1.61e-03 | 31 |
| GO:00066351 | Colorectum | SER | fatty acid beta-oxidation | 24/2897 | 74/18723 | 2.09e-04 | 3.77e-03 | 24 |
| GO:00723291 | Colorectum | SER | monocarboxylic acid catabolic process | 34/2897 | 122/18723 | 3.27e-04 | 5.22e-03 | 34 |
| GO:00193951 | Colorectum | SER | fatty acid oxidation | 29/2897 | 103/18723 | 7.24e-04 | 9.44e-03 | 29 |
| GO:00442421 | Colorectum | SER | cellular lipid catabolic process | 51/2897 | 214/18723 | 8.60e-04 | 1.05e-02 | 51 |
| Page: 1 2 3 4 5 6 7 |
| Pathway ID | Tissue | Disease Stage | Description | Gene Ratio | Bg Ratio | pvalue | p.adjust | qvalue | Count |
| hsa01200 | Colorectum | AD | Carbon metabolism | 55/2092 | 115/8465 | 5.53e-08 | 8.42e-07 | 5.37e-07 | 55 |
| hsa00280 | Colorectum | AD | Valine, leucine and isoleucine degradation | 25/2092 | 48/8465 | 3.97e-05 | 3.41e-04 | 2.18e-04 | 25 |
| hsa00640 | Colorectum | AD | Propanoate metabolism | 18/2092 | 32/8465 | 1.33e-04 | 1.11e-03 | 7.08e-04 | 18 |
| hsa00071 | Colorectum | AD | Fatty acid degradation | 20/2092 | 43/8465 | 1.50e-03 | 8.69e-03 | 5.54e-03 | 20 |
| hsa012001 | Colorectum | AD | Carbon metabolism | 55/2092 | 115/8465 | 5.53e-08 | 8.42e-07 | 5.37e-07 | 55 |
| hsa002801 | Colorectum | AD | Valine, leucine and isoleucine degradation | 25/2092 | 48/8465 | 3.97e-05 | 3.41e-04 | 2.18e-04 | 25 |
| hsa006401 | Colorectum | AD | Propanoate metabolism | 18/2092 | 32/8465 | 1.33e-04 | 1.11e-03 | 7.08e-04 | 18 |
| hsa000711 | Colorectum | AD | Fatty acid degradation | 20/2092 | 43/8465 | 1.50e-03 | 8.69e-03 | 5.54e-03 | 20 |
| hsa012002 | Colorectum | SER | Carbon metabolism | 40/1580 | 115/8465 | 2.77e-05 | 3.41e-04 | 2.47e-04 | 40 |
| hsa006402 | Colorectum | SER | Propanoate metabolism | 13/1580 | 32/8465 | 3.20e-03 | 2.12e-02 | 1.54e-02 | 13 |
| hsa000712 | Colorectum | SER | Fatty acid degradation | 15/1580 | 43/8465 | 8.60e-03 | 4.26e-02 | 3.09e-02 | 15 |
| hsa012003 | Colorectum | SER | Carbon metabolism | 40/1580 | 115/8465 | 2.77e-05 | 3.41e-04 | 2.47e-04 | 40 |
| hsa006403 | Colorectum | SER | Propanoate metabolism | 13/1580 | 32/8465 | 3.20e-03 | 2.12e-02 | 1.54e-02 | 13 |
| hsa000713 | Colorectum | SER | Fatty acid degradation | 15/1580 | 43/8465 | 8.60e-03 | 4.26e-02 | 3.09e-02 | 15 |
| hsa012006 | Colorectum | FAP | Carbon metabolism | 38/1404 | 115/8465 | 1.04e-05 | 1.44e-04 | 8.76e-05 | 38 |
| hsa006406 | Colorectum | FAP | Propanoate metabolism | 15/1404 | 32/8465 | 6.21e-05 | 6.10e-04 | 3.71e-04 | 15 |
| hsa002804 | Colorectum | FAP | Valine, leucine and isoleucine degradation | 18/1404 | 48/8465 | 3.94e-04 | 3.06e-03 | 1.86e-03 | 18 |
| hsa000716 | Colorectum | FAP | Fatty acid degradation | 15/1404 | 43/8465 | 2.73e-03 | 1.23e-02 | 7.50e-03 | 15 |
| hsa012007 | Colorectum | FAP | Carbon metabolism | 38/1404 | 115/8465 | 1.04e-05 | 1.44e-04 | 8.76e-05 | 38 |
| hsa006407 | Colorectum | FAP | Propanoate metabolism | 15/1404 | 32/8465 | 6.21e-05 | 6.10e-04 | 3.71e-04 | 15 |
| Page: 1 2 3 |
Top |
Cell-cell communication analysis |
| Identification of potential cell-cell interactions between two cell types and their ligand-receptor pairs for different disease states |
| Ligand | Receptor | LRpair | Pathway | Tissue | Disease Stage |
| Page: 1 |
Top |
Single-cell gene regulatory network inference analysis |
| Find out the significant the regulons (TFs) and the target genes of each regulon across cell types for different disease states |
| TF | Cell Type | Tissue | Disease Stage | Target Gene | RSS | Regulon Activity |
| ∗The dot plots of a searched regulon are shown for all cell subpopulations in each disease state of each tissue based on the regulon specific score inferred using pySCENIC and by calculating the average expression. |
| Page: 1 |
Top |
Somatic mutation of malignant transformation related genes |
| Annotation of somatic variants for genes involved in malignant transformation |
| Hugo Symbol | Variant Class | Variant Classification | dbSNP RS | HGVSc | HGVSp | HGVSp Short | SWISSPROT | BIOTYPE | SIFT | PolyPhen | Tumor Sample Barcode | Tissue | Histology | Sex | Age | Stage | Therapy Types | Drugs | Outcome |
| ACADS | SNV | Missense_Mutation | novel | c.1117N>T | p.Val373Leu | p.V373L | P16219 | protein_coding | tolerated(0.05) | benign(0.299) | TCGA-BH-A5J0-01 | Breast | breast invasive carcinoma | Female | <65 | I/II | Unknown | Unknown | SD |
| ACADS | SNV | Missense_Mutation | rs142476255 | c.215N>G | p.Lys72Arg | p.K72R | P16219 | protein_coding | tolerated(0.27) | benign(0.003) | TCGA-LQ-A4E4-01 | Breast | breast invasive carcinoma | Female | >=65 | III/IV | Hormone Therapy | anastrozole | PD |
| ACADS | SNV | Missense_Mutation | rs756016434 | c.517N>A | p.Glu173Lys | p.E173K | P16219 | protein_coding | tolerated(0.3) | benign(0.021) | TCGA-IR-A3LK-01 | Cervix | cervical & endocervical cancer | Female | >=65 | I/II | Chemotherapy | cisplatin | PD |
| ACADS | SNV | Missense_Mutation | novel | c.1121C>G | p.Thr374Arg | p.T374R | P16219 | protein_coding | tolerated(0.82) | benign(0.005) | TCGA-JW-A5VL-01 | Cervix | cervical & endocervical cancer | Female | <65 | I/II | Unknown | Unknown | SD |
| ACADS | SNV | Missense_Mutation | rs148588313 | c.656N>T | p.Thr219Met | p.T219M | P16219 | protein_coding | tolerated(0.14) | benign(0.183) | TCGA-5M-AAT6-01 | Colorectum | colon adenocarcinoma | Female | <65 | III/IV | Unknown | Unknown | PD |
| ACADS | SNV | Missense_Mutation | c.233N>A | p.Gly78Glu | p.G78E | P16219 | protein_coding | deleterious(0.02) | probably_damaging(0.985) | TCGA-D5-6928-01 | Colorectum | colon adenocarcinoma | Male | >=65 | I/II | Unknown | Unknown | SD | |
| ACADS | SNV | Missense_Mutation | c.719N>G | p.Asn240Ser | p.N240S | P16219 | protein_coding | tolerated(0.25) | benign(0) | TCGA-G4-6304-01 | Colorectum | colon adenocarcinoma | Female | >=65 | I/II | Chemotherapy | fluorouracil | PD | |
| ACADS | SNV | Missense_Mutation | rs199633532 | c.989G>A | p.Arg330His | p.R330H | P16219 | protein_coding | deleterious(0.03) | benign(0.111) | TCGA-AF-2693-01 | Colorectum | rectum adenocarcinoma | Male | >=65 | I/II | Unknown | Unknown | SD |
| ACADS | SNV | Missense_Mutation | novel | c.159G>C | p.Leu53Phe | p.L53F | P16219 | protein_coding | deleterious(0.01) | possibly_damaging(0.764) | TCGA-AG-A00Y-01 | Colorectum | rectum adenocarcinoma | Male | >=65 | I/II | Unknown | Unknown | PD |
| ACADS | SNV | Missense_Mutation | rs183161718 | c.1130N>T | p.Pro377Leu | p.P377L | P16219 | protein_coding | deleterious(0) | probably_damaging(0.911) | TCGA-AH-6903-01 | Colorectum | rectum adenocarcinoma | Male | <65 | III/IV | Chemotherapy | 5-fu | CR |
| Page: 1 2 3 4 |
Top |
Related drugs of malignant transformation related genes |
| Identification of chemicals and drugs interact with genes involved in malignant transfromation |
| (DGIdb 4.0) |
| Entrez ID | Symbol | Category | Interaction Types | Drug Claim Name | Drug Name | PMIDs |
| Page: 1 |

Copyright 2023-Present -The University of Texas Health Science Center at Houston |