
|
|||||
|
 | |
| |
| |
| |
| |
| |
|
Gene: ACADM |
Gene summary for ACADM |
| Gene information | Species | Human | Gene symbol | ACADM | Gene ID | 34 |
| Gene name | acyl-CoA dehydrogenase medium chain | |
| Gene Alias | ACAD1 | |
| Cytomap | 1p31.1 | |
| Gene Type | protein-coding | GO ID | GO:0000271 | UniProtAcc | A0A0S2Z366 |
Top |
Malignant transformation analysis |
| Identification of the aberrant gene expression in precancerous and cancerous lesions by comparing the gene expression of stem-like cells in diseased tissues with normal stem cells |
| Entrez ID | Symbol | Replicates | Species | Organ | Tissue | Adj P-value | Log2FC | Malignancy |
| 34 | ACADM | LZE2T | Human | Esophagus | ESCC | 2.15e-03 | 3.15e-01 | 0.082 |
| 34 | ACADM | LZE4T | Human | Esophagus | ESCC | 1.52e-11 | 2.03e-01 | 0.0811 |
| 34 | ACADM | LZE7T | Human | Esophagus | ESCC | 1.45e-05 | 5.09e-01 | 0.0667 |
| 34 | ACADM | LZE8T | Human | Esophagus | ESCC | 4.40e-05 | 7.16e-02 | 0.067 |
| 34 | ACADM | LZE20T | Human | Esophagus | ESCC | 8.98e-09 | 2.49e-01 | 0.0662 |
| 34 | ACADM | LZE22D1 | Human | Esophagus | HGIN | 1.60e-02 | 2.43e-01 | 0.0595 |
| 34 | ACADM | LZE22T | Human | Esophagus | ESCC | 2.80e-10 | 7.61e-01 | 0.068 |
| 34 | ACADM | LZE24T | Human | Esophagus | ESCC | 2.38e-13 | 4.05e-01 | 0.0596 |
| 34 | ACADM | LZE6T | Human | Esophagus | ESCC | 5.13e-07 | 1.89e-01 | 0.0845 |
| 34 | ACADM | P1T-E | Human | Esophagus | ESCC | 4.20e-08 | 5.99e-01 | 0.0875 |
| 34 | ACADM | P2T-E | Human | Esophagus | ESCC | 7.88e-41 | 6.69e-01 | 0.1177 |
| 34 | ACADM | P4T-E | Human | Esophagus | ESCC | 6.05e-21 | 4.49e-01 | 0.1323 |
| 34 | ACADM | P5T-E | Human | Esophagus | ESCC | 5.05e-15 | 2.71e-01 | 0.1327 |
| 34 | ACADM | P8T-E | Human | Esophagus | ESCC | 3.60e-14 | 2.74e-01 | 0.0889 |
| 34 | ACADM | P9T-E | Human | Esophagus | ESCC | 1.58e-13 | 1.09e-01 | 0.1131 |
| 34 | ACADM | P10T-E | Human | Esophagus | ESCC | 4.84e-37 | 7.17e-01 | 0.116 |
| 34 | ACADM | P11T-E | Human | Esophagus | ESCC | 6.39e-16 | 4.23e-01 | 0.1426 |
| 34 | ACADM | P12T-E | Human | Esophagus | ESCC | 6.79e-31 | 3.29e-01 | 0.1122 |
| 34 | ACADM | P15T-E | Human | Esophagus | ESCC | 5.47e-18 | 3.53e-01 | 0.1149 |
| 34 | ACADM | P16T-E | Human | Esophagus | ESCC | 3.86e-18 | 3.41e-01 | 0.1153 |
| Page: 1 2 3 4 5 6 |
| Tissue | Expression Dynamics | Abbreviation |
| Esophagus | 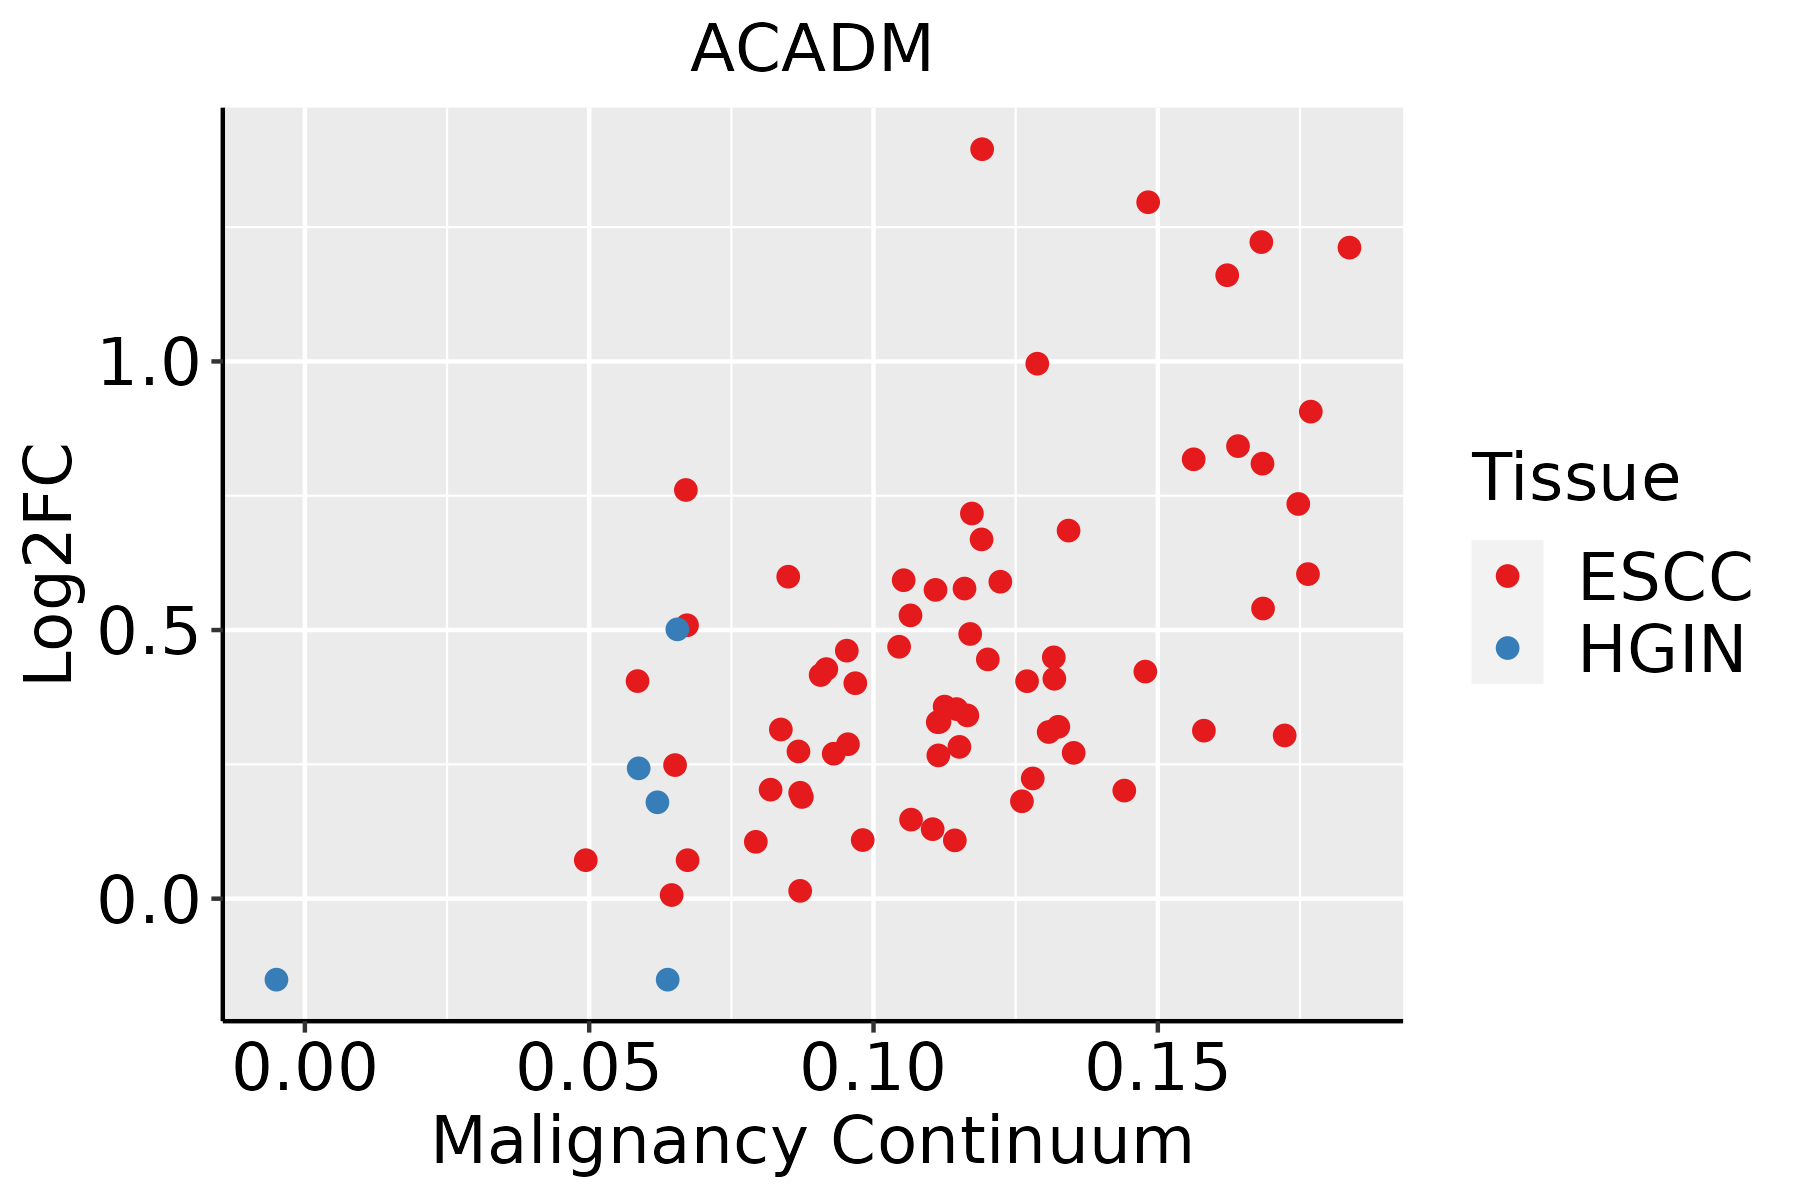 | ESCC: Esophageal squamous cell carcinoma |
| HGIN: High-grade intraepithelial neoplasias | ||
| LGIN: Low-grade intraepithelial neoplasias | ||
| Liver | 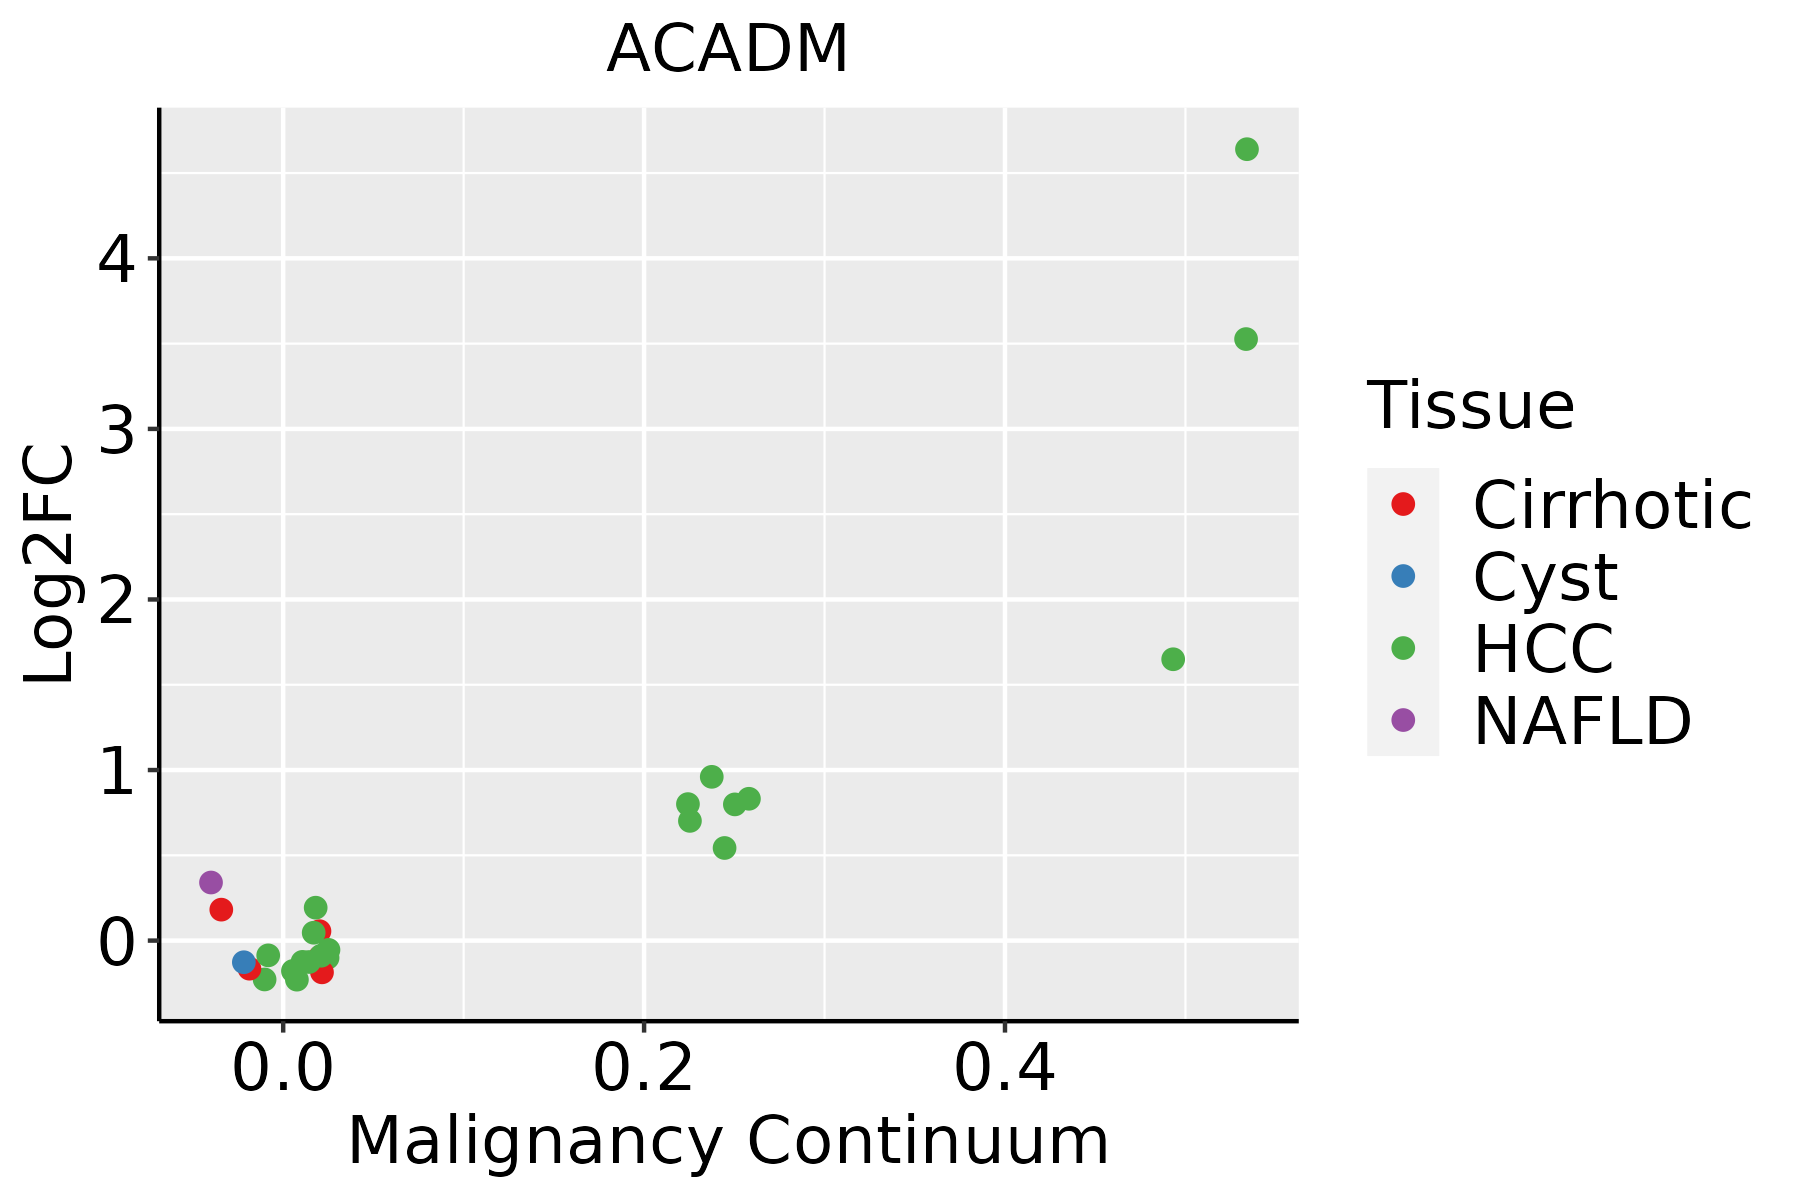 | HCC: Hepatocellular carcinoma |
| NAFLD: Non-alcoholic fatty liver disease | ||
| Oral Cavity | 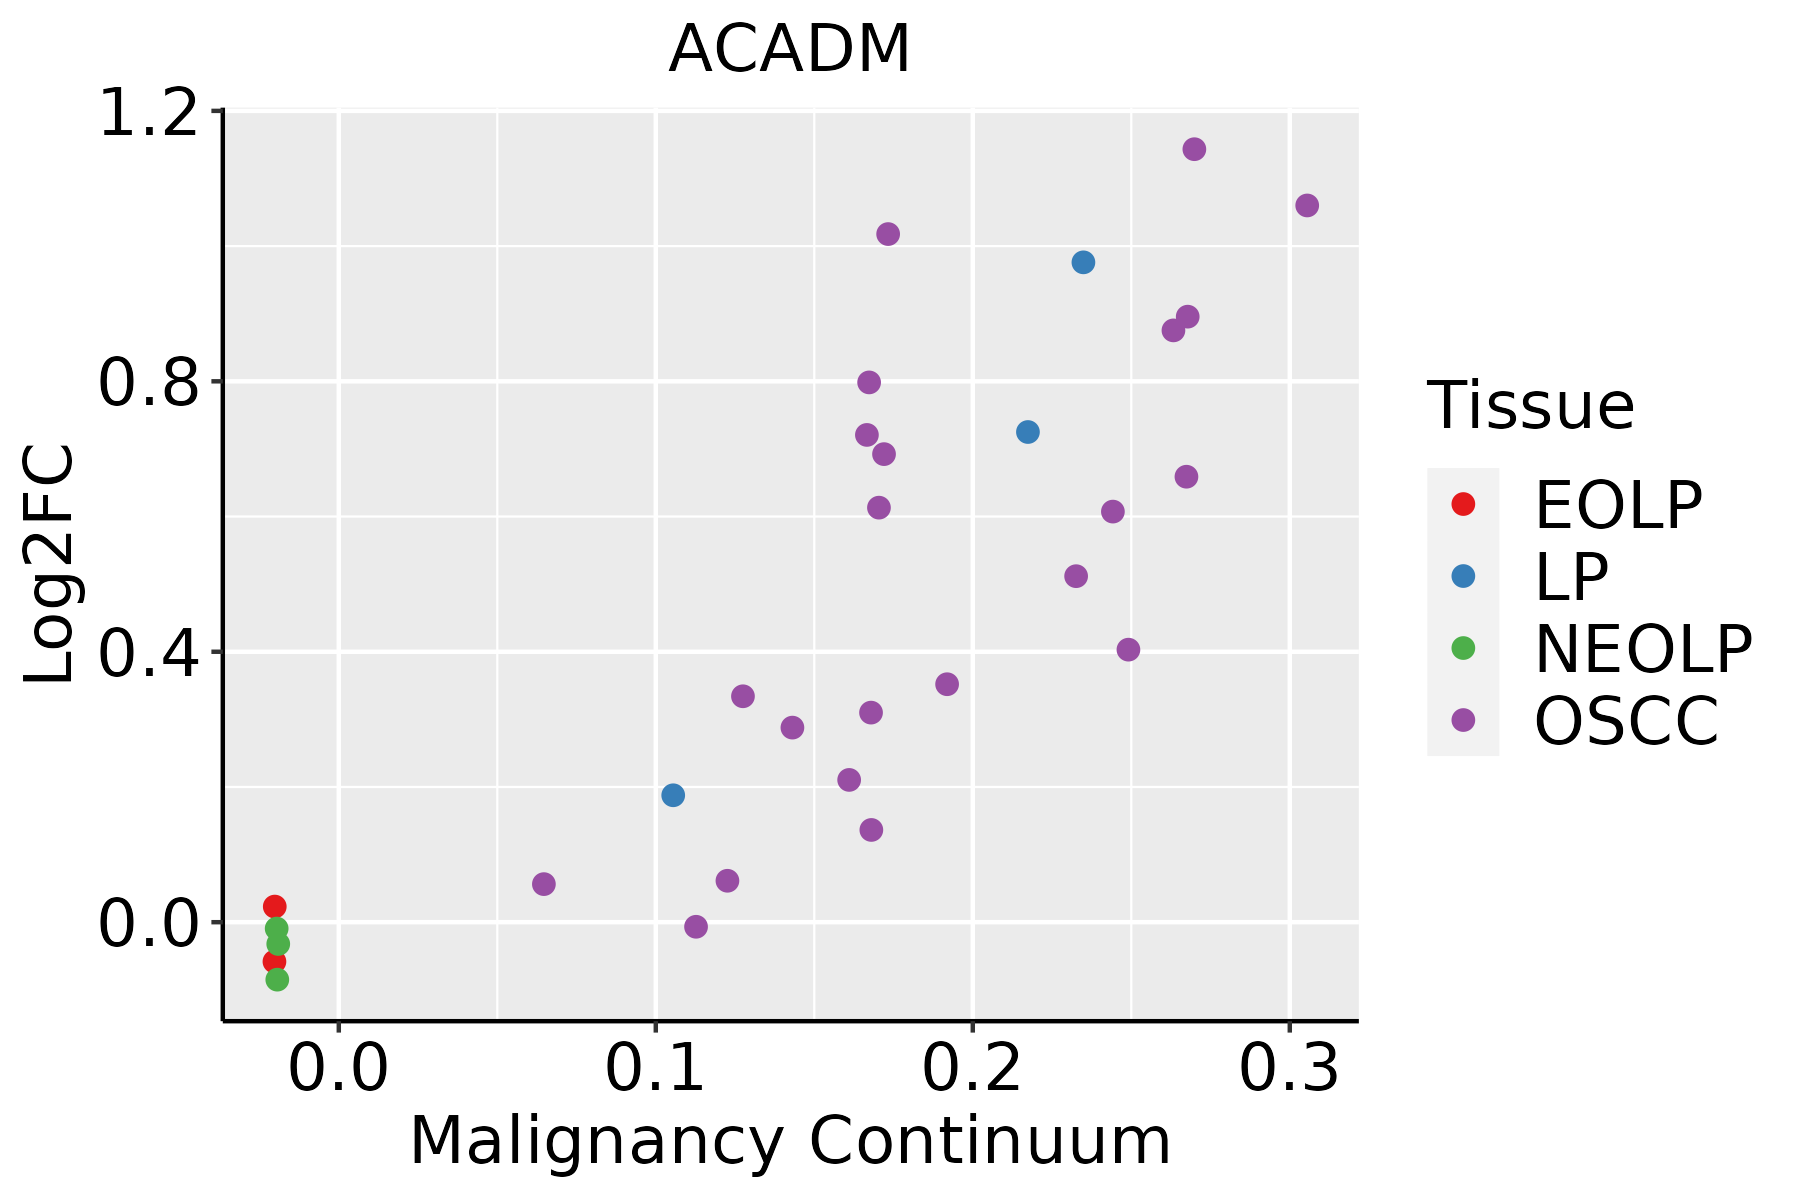 | EOLP: Erosive Oral lichen planus |
| LP: leukoplakia | ||
| NEOLP: Non-erosive oral lichen planus | ||
| OSCC: Oral squamous cell carcinoma | ||
| Skin | 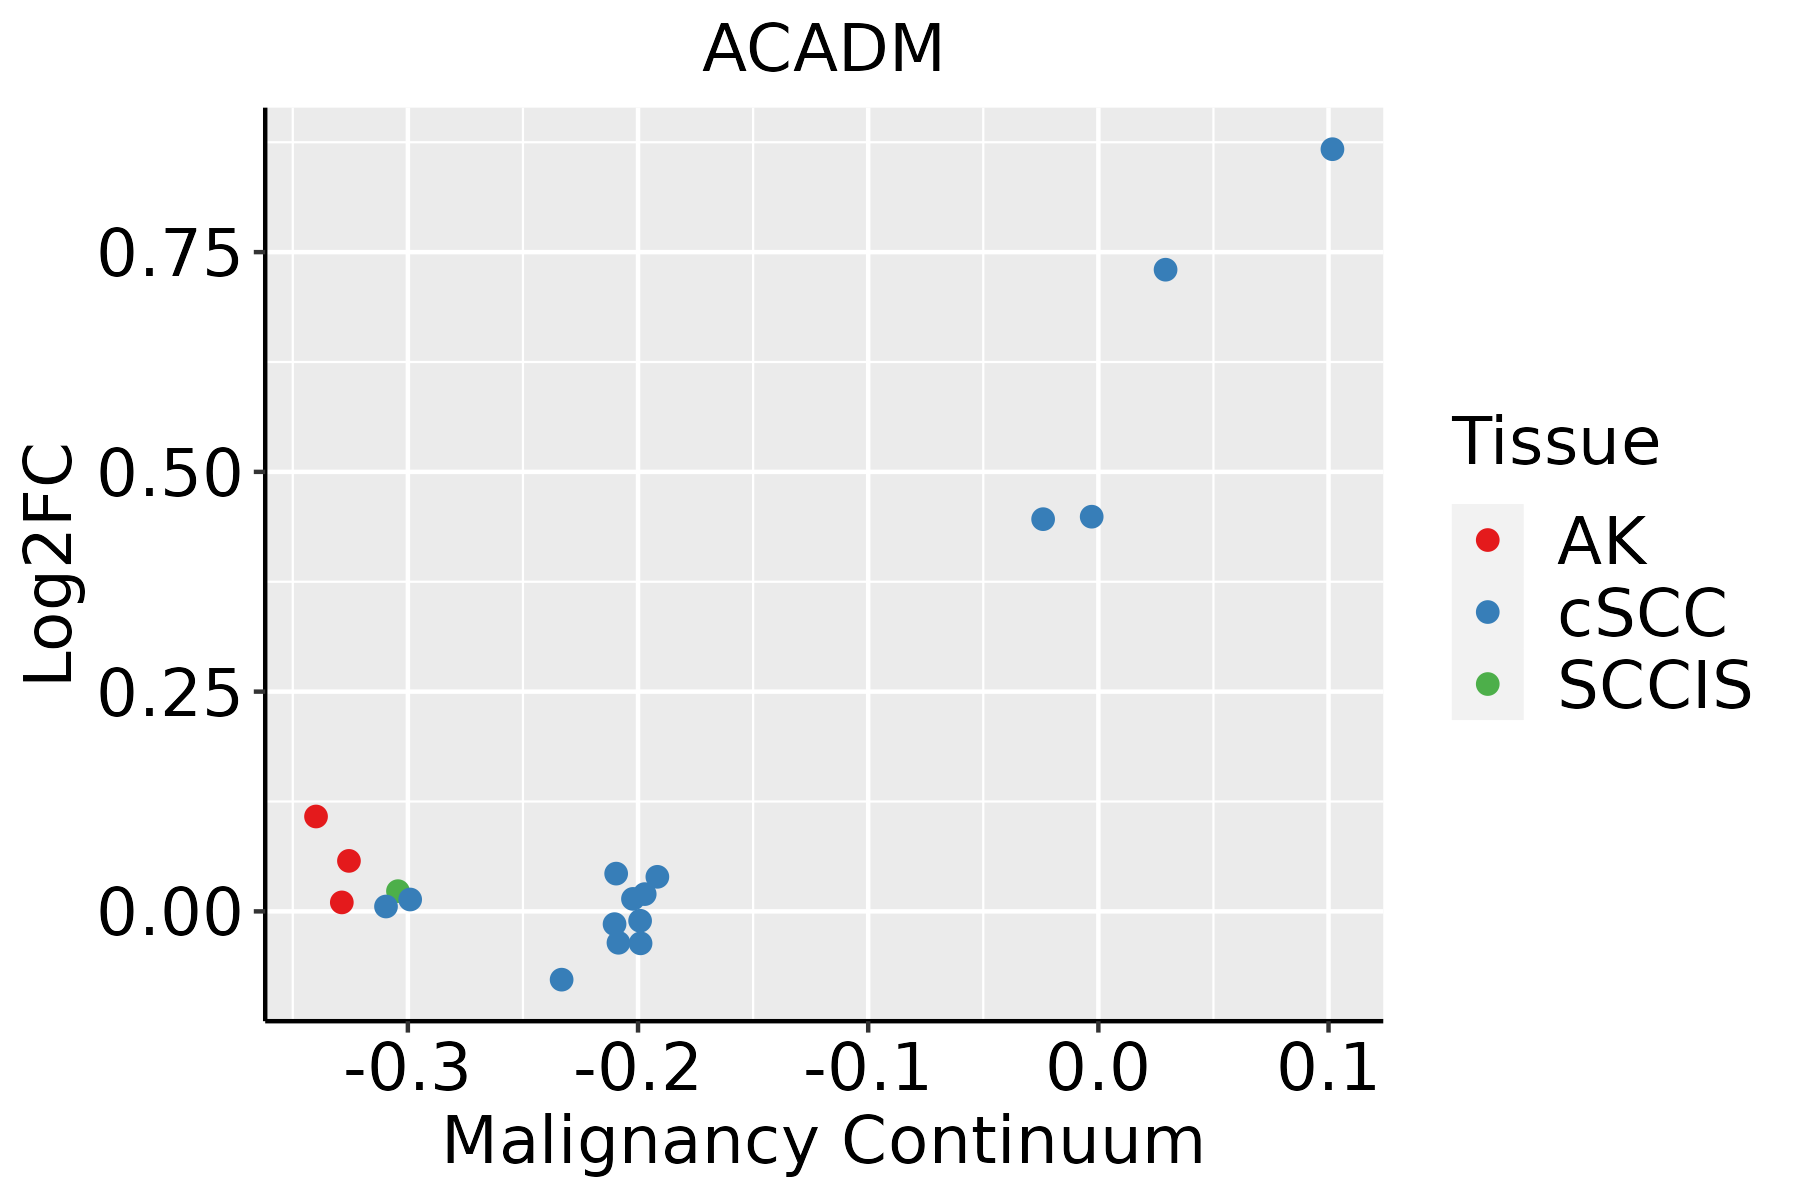 | AK: Actinic keratosis |
| cSCC: Cutaneous squamous cell carcinoma | ||
| SCCIS:squamous cell carcinoma in situ | ||
| Thyroid | 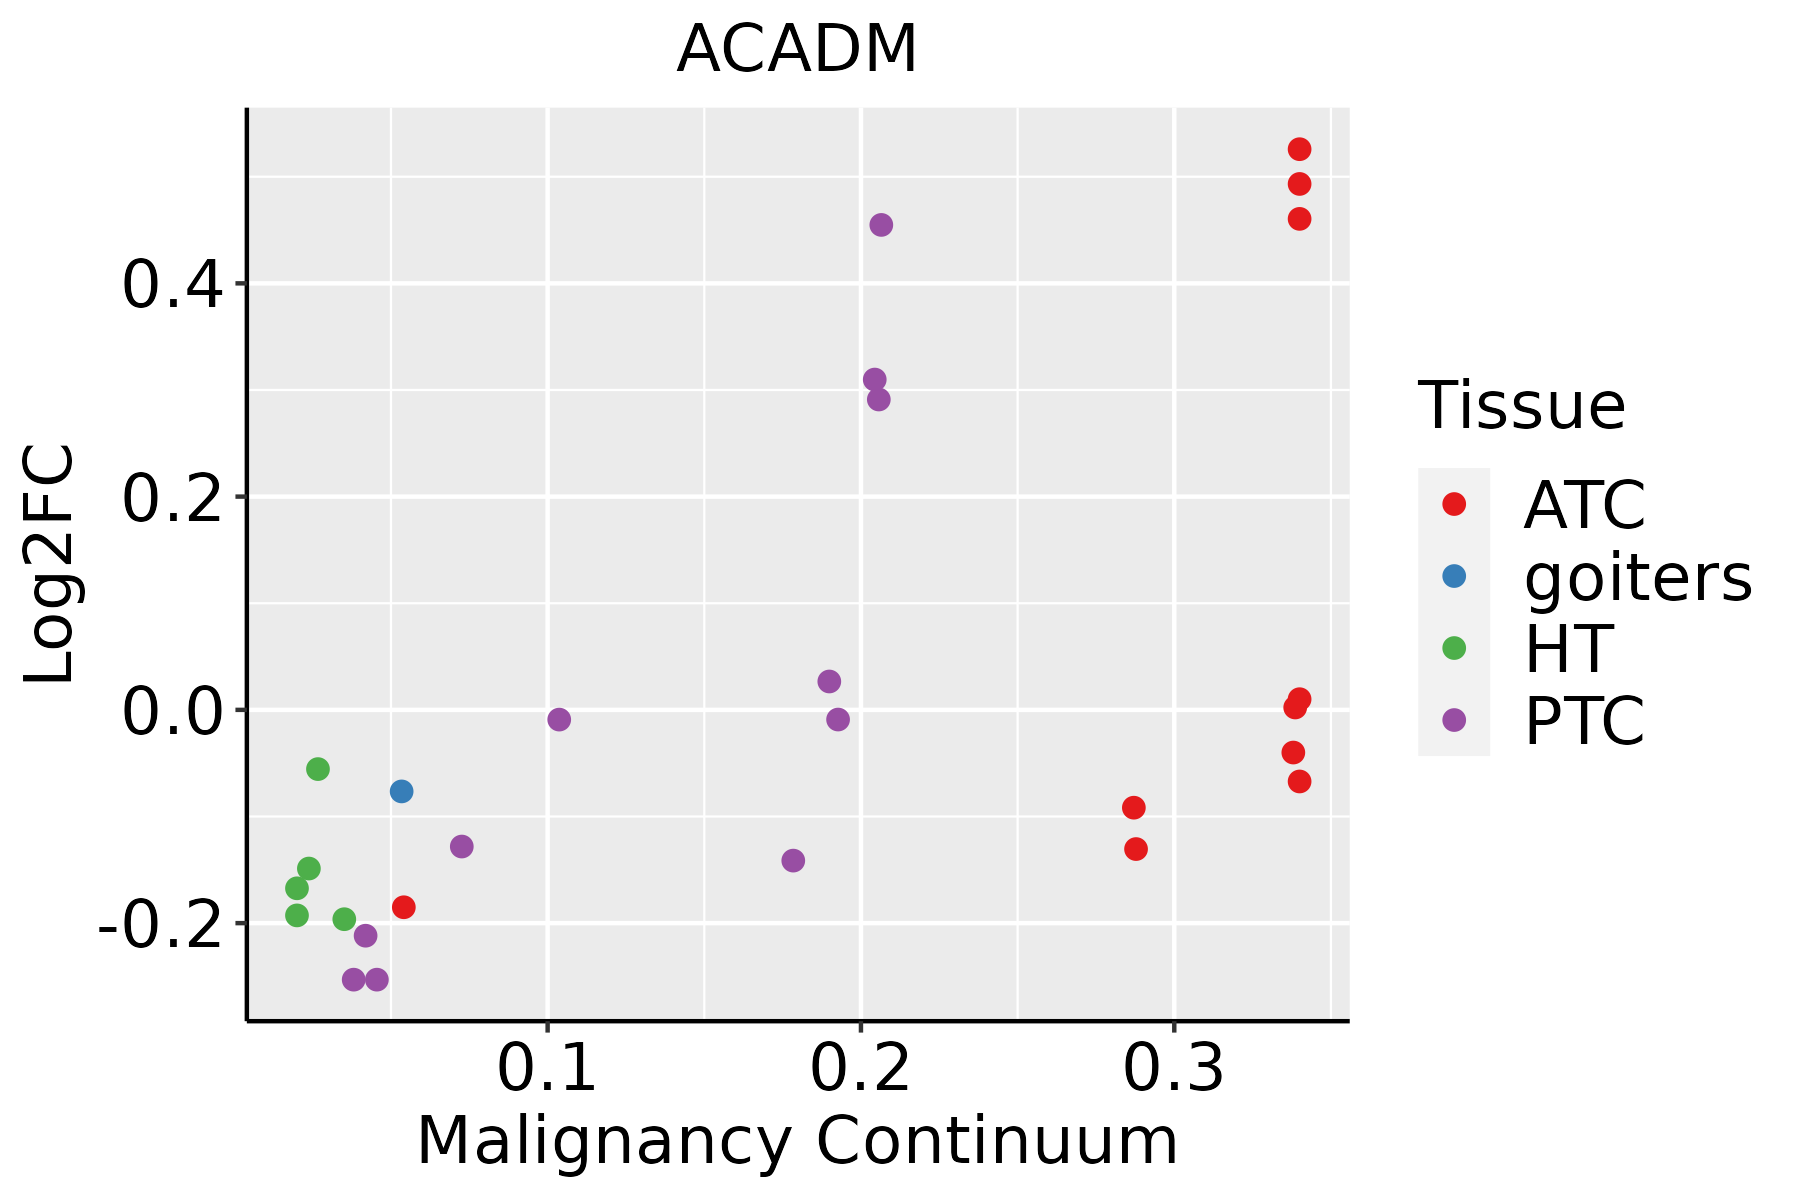 | ATC: Anaplastic thyroid cancer |
| HT: Hashimoto's thyroiditis | ||
| PTC: Papillary thyroid cancer |
| ∗log2FC in expression of this searched gene in stem-like cells from each diseased tissue sample relative to stem-like cells in normal samples in each tissue plotted against the malignancy continuum. Samples are colored based on if they are from different disease stage. |
Top |
Malignant transformation related pathway analysis |
| Find out the enriched GO biological processes and KEGG pathways involved in transition from healthy to precancer to cancer |
| Tissue | Disease Stage | Enriched GO biological Processes |
| Colorectum | AD |  |
| Colorectum | SER |  |
| Colorectum | MSS |  |
| Colorectum | MSI-H |  |
| Colorectum | FAP |  |
| ∗Top 15 enriched GO BP terms are showed in the bar plot of each disease state in each tissue. Each row represents a significant GO biological process which is colored according to the -log10(p.adjust). |
| Page: 1 2 3 4 5 6 7 8 9 |
| GO ID | Tissue | Disease Stage | Description | Gene Ratio | Bg Ratio | pvalue | p.adjust | Count |
| GO:000609120 | Esophagus | HGIN | generation of precursor metabolites and energy | 145/2587 | 490/18723 | 3.41e-20 | 2.04e-17 | 145 |
| GO:001598020 | Esophagus | HGIN | energy derivation by oxidation of organic compounds | 105/2587 | 318/18723 | 1.16e-18 | 4.99e-16 | 105 |
| GO:004873225 | Esophagus | HGIN | gland development | 88/2587 | 436/18723 | 1.34e-04 | 2.71e-03 | 88 |
| GO:006100820 | Esophagus | HGIN | hepaticobiliary system development | 37/2587 | 150/18723 | 2.58e-04 | 4.53e-03 | 37 |
| GO:000926618 | Esophagus | HGIN | response to temperature stimulus | 42/2587 | 178/18723 | 2.91e-04 | 4.98e-03 | 42 |
| GO:000188920 | Esophagus | HGIN | liver development | 36/2587 | 147/18723 | 3.61e-04 | 5.68e-03 | 36 |
| GO:003166726 | Esophagus | HGIN | response to nutrient levels | 89/2587 | 474/18723 | 1.41e-03 | 1.64e-02 | 89 |
| GO:00605379 | Esophagus | HGIN | muscle tissue development | 76/2587 | 403/18723 | 2.67e-03 | 2.63e-02 | 76 |
| GO:00147068 | Esophagus | HGIN | striated muscle tissue development | 72/2587 | 384/18723 | 3.94e-03 | 3.56e-02 | 72 |
| GO:004259418 | Esophagus | HGIN | response to starvation | 41/2587 | 197/18723 | 4.34e-03 | 3.84e-02 | 41 |
| GO:0006091110 | Esophagus | ESCC | generation of precursor metabolites and energy | 331/8552 | 490/18723 | 3.86e-23 | 8.45e-21 | 331 |
| GO:0015980110 | Esophagus | ESCC | energy derivation by oxidation of organic compounds | 220/8552 | 318/18723 | 1.20e-17 | 1.09e-15 | 220 |
| GO:0048732111 | Esophagus | ESCC | gland development | 269/8552 | 436/18723 | 7.81e-12 | 2.95e-10 | 269 |
| GO:0031667111 | Esophagus | ESCC | response to nutrient levels | 289/8552 | 474/18723 | 9.25e-12 | 3.47e-10 | 289 |
| GO:004259419 | Esophagus | ESCC | response to starvation | 133/8552 | 197/18723 | 4.31e-10 | 1.14e-08 | 133 |
| GO:00059969 | Esophagus | ESCC | monosaccharide metabolic process | 159/8552 | 257/18723 | 1.11e-07 | 1.81e-06 | 159 |
| GO:00193189 | Esophagus | ESCC | hexose metabolic process | 147/8552 | 237/18723 | 2.63e-07 | 3.94e-06 | 147 |
| GO:0061008110 | Esophagus | ESCC | hepaticobiliary system development | 98/8552 | 150/18723 | 8.91e-07 | 1.15e-05 | 98 |
| GO:0001889110 | Esophagus | ESCC | liver development | 96/8552 | 147/18723 | 1.18e-06 | 1.47e-05 | 96 |
| GO:00097919 | Esophagus | ESCC | post-embryonic development | 56/8552 | 80/18723 | 9.08e-06 | 8.71e-05 | 56 |
| Page: 1 2 3 4 5 6 7 8 9 10 11 12 13 14 |
| Pathway ID | Tissue | Disease Stage | Description | Gene Ratio | Bg Ratio | pvalue | p.adjust | qvalue | Count |
| hsa012129 | Esophagus | ESCC | Fatty acid metabolism | 41/4205 | 57/8465 | 5.13e-04 | 1.75e-03 | 8.98e-04 | 41 |
| hsa002809 | Esophagus | ESCC | Valine, leucine and isoleucine degradation | 34/4205 | 48/8465 | 2.34e-03 | 6.54e-03 | 3.35e-03 | 34 |
| hsa0121214 | Esophagus | ESCC | Fatty acid metabolism | 41/4205 | 57/8465 | 5.13e-04 | 1.75e-03 | 8.98e-04 | 41 |
| hsa0028014 | Esophagus | ESCC | Valine, leucine and isoleucine degradation | 34/4205 | 48/8465 | 2.34e-03 | 6.54e-03 | 3.35e-03 | 34 |
| hsa002806 | Liver | NAFLD | Valine, leucine and isoleucine degradation | 20/1043 | 48/8465 | 3.03e-07 | 1.65e-05 | 1.33e-05 | 20 |
| hsa033206 | Liver | NAFLD | PPAR signaling pathway | 25/1043 | 75/8465 | 1.61e-06 | 6.62e-05 | 5.33e-05 | 25 |
| hsa012126 | Liver | NAFLD | Fatty acid metabolism | 17/1043 | 57/8465 | 3.43e-04 | 5.93e-03 | 4.78e-03 | 17 |
| hsa000718 | Liver | NAFLD | Fatty acid degradation | 13/1043 | 43/8465 | 1.46e-03 | 1.71e-02 | 1.38e-02 | 13 |
| hsa0028011 | Liver | NAFLD | Valine, leucine and isoleucine degradation | 20/1043 | 48/8465 | 3.03e-07 | 1.65e-05 | 1.33e-05 | 20 |
| hsa0332011 | Liver | NAFLD | PPAR signaling pathway | 25/1043 | 75/8465 | 1.61e-06 | 6.62e-05 | 5.33e-05 | 25 |
| hsa0121211 | Liver | NAFLD | Fatty acid metabolism | 17/1043 | 57/8465 | 3.43e-04 | 5.93e-03 | 4.78e-03 | 17 |
| hsa0007111 | Liver | NAFLD | Fatty acid degradation | 13/1043 | 43/8465 | 1.46e-03 | 1.71e-02 | 1.38e-02 | 13 |
| hsa0028021 | Liver | Cirrhotic | Valine, leucine and isoleucine degradation | 32/2530 | 48/8465 | 1.45e-07 | 2.02e-06 | 1.24e-06 | 32 |
| hsa0007121 | Liver | Cirrhotic | Fatty acid degradation | 29/2530 | 43/8465 | 3.87e-07 | 4.95e-06 | 3.05e-06 | 29 |
| hsa012122 | Liver | Cirrhotic | Fatty acid metabolism | 32/2530 | 57/8465 | 3.12e-05 | 2.47e-04 | 1.52e-04 | 32 |
| hsa04936 | Liver | Cirrhotic | Alcoholic liver disease | 60/2530 | 142/8465 | 1.07e-03 | 5.85e-03 | 3.61e-03 | 60 |
| hsa0332021 | Liver | Cirrhotic | PPAR signaling pathway | 32/2530 | 75/8465 | 1.24e-02 | 3.92e-02 | 2.42e-02 | 32 |
| hsa0028031 | Liver | Cirrhotic | Valine, leucine and isoleucine degradation | 32/2530 | 48/8465 | 1.45e-07 | 2.02e-06 | 1.24e-06 | 32 |
| hsa0007131 | Liver | Cirrhotic | Fatty acid degradation | 29/2530 | 43/8465 | 3.87e-07 | 4.95e-06 | 3.05e-06 | 29 |
| hsa012123 | Liver | Cirrhotic | Fatty acid metabolism | 32/2530 | 57/8465 | 3.12e-05 | 2.47e-04 | 1.52e-04 | 32 |
| Page: 1 2 |
Top |
Cell-cell communication analysis |
| Identification of potential cell-cell interactions between two cell types and their ligand-receptor pairs for different disease states |
| Ligand | Receptor | LRpair | Pathway | Tissue | Disease Stage |
| Page: 1 |
Top |
Single-cell gene regulatory network inference analysis |
| Find out the significant the regulons (TFs) and the target genes of each regulon across cell types for different disease states |
| TF | Cell Type | Tissue | Disease Stage | Target Gene | RSS | Regulon Activity |
| ∗The dot plots of a searched regulon are shown for all cell subpopulations in each disease state of each tissue based on the regulon specific score inferred using pySCENIC and by calculating the average expression. |
| Page: 1 |
Top |
Somatic mutation of malignant transformation related genes |
| Annotation of somatic variants for genes involved in malignant transformation |
| Hugo Symbol | Variant Class | Variant Classification | dbSNP RS | HGVSc | HGVSp | HGVSp Short | SWISSPROT | BIOTYPE | SIFT | PolyPhen | Tumor Sample Barcode | Tissue | Histology | Sex | Age | Stage | Therapy Types | Drugs | Outcome |
| ACADM | insertion | Nonsense_Mutation | novel | c.81_82insTCACGGTTGTGATCCTAGCACCTTGGGAGGCCTCGGCGGGTTG | p.Asn28SerfsTer4 | p.N28Sfs*4 | protein_coding | TCGA-A8-A07R-01 | Breast | breast invasive carcinoma | Female | >=65 | III/IV | Ancillary | zoledronic | SD | |||
| ACADM | SNV | Missense_Mutation | novel | c.884T>G | p.Val295Gly | p.V295G | protein_coding | deleterious(0) | possibly_damaging(0.866) | TCGA-2W-A8YY-01 | Cervix | cervical & endocervical cancer | Female | <65 | I/II | Chemotherapy | cisplatin | CR | |
| ACADM | SNV | Missense_Mutation | c.561N>C | p.Leu187Phe | p.L187F | protein_coding | tolerated(0.08) | benign(0.031) | TCGA-JW-A5VL-01 | Cervix | cervical & endocervical cancer | Female | <65 | I/II | Unknown | Unknown | SD | ||
| ACADM | SNV | Missense_Mutation | c.143N>G | p.Phe48Cys | p.F48C | protein_coding | deleterious(0) | probably_damaging(0.957) | TCGA-AA-3984-01 | Colorectum | colon adenocarcinoma | Female | <65 | I/II | Unknown | Unknown | SD | ||
| ACADM | SNV | Missense_Mutation | c.274N>A | p.Pro92Thr | p.P92T | protein_coding | deleterious(0) | probably_damaging(0.994) | TCGA-AA-A010-01 | Colorectum | colon adenocarcinoma | Female | <65 | I/II | Chemotherapy | folinic | CR | ||
| ACADM | SNV | Missense_Mutation | rs373715782 | c.715C>T | p.Arg239Cys | p.R239C | protein_coding | deleterious(0) | probably_damaging(0.973) | TCGA-DM-A1HB-01 | Colorectum | colon adenocarcinoma | Male | >=65 | III/IV | Unknown | Unknown | SD | |
| ACADM | SNV | Missense_Mutation | c.143T>G | p.Phe48Cys | p.F48C | protein_coding | deleterious(0) | probably_damaging(0.957) | TCGA-AG-3892-01 | Colorectum | rectum adenocarcinoma | Female | <65 | I/II | Unknown | Unknown | SD | ||
| ACADM | SNV | Missense_Mutation | novel | c.279G>T | p.Glu93Asp | p.E93D | protein_coding | deleterious(0.01) | benign(0.371) | TCGA-AG-A002-01 | Colorectum | rectum adenocarcinoma | Male | <65 | I/II | Unknown | Unknown | SD | |
| ACADM | SNV | Missense_Mutation | c.769G>A | p.Val257Met | p.V257M | protein_coding | deleterious(0) | probably_damaging(0.994) | TCGA-AG-A01N-01 | Colorectum | rectum adenocarcinoma | Female | >=65 | III/IV | Chemotherapy | capecitabine | SD | ||
| ACADM | SNV | Missense_Mutation | c.479N>T | p.Ser160Phe | p.S160F | protein_coding | tolerated(0.13) | benign(0.053) | TCGA-EI-6917-01 | Colorectum | rectum adenocarcinoma | Male | <65 | III/IV | Chemotherapy | 5fluorouracil+oxaciplatina+l-folinian | SD |
| Page: 1 2 3 4 5 6 |
Top |
Related drugs of malignant transformation related genes |
| Identification of chemicals and drugs interact with genes involved in malignant transfromation |
| (DGIdb 4.0) |
| Entrez ID | Symbol | Category | Interaction Types | Drug Claim Name | Drug Name | PMIDs |
| 34 | ACADM | ENZYME | HORMONES | 9164869 |
| Page: 1 |

Copyright 2023-Present -The University of Texas Health Science Center at Houston |