Schematic overview of the cellular and molecular mechanisms involved in the cancer progression, including the proposed cellular and molecular mechanisms in cancer cells trajectory. AT1: alveolar type 1 cells; AT2: alveolar type 2 cells; AAH: atypical adenomatous hyperplasia; AIS: adenocarcinoma in situ; MIA: minimally invasive adenocarcinoma; IA: invasive adenocarcinoma; EMT: epithelial-mesenchymal transition

Home

Download

Statistics

Help

Contact

Center for Computational Systems Medicine
leaf

Gene summary

leaf

Malignant transformation analysis

leaf

Malignant transformation related pathway analysis

leaf

Cell-cell communication analysis

leaf

Single-cell gene regulatory network inference analysis

leaf

Somatic mutation of malignant transformation related genes

leaf

Related drugs of malignant transformation related genes

Gene: ACAD9

Gene summary for ACAD9

check button Gene summary.

Gene informationSpeciesHuman
Gene symbol

ACAD9

Gene ID

28976

Gene nameacyl-CoA dehydrogenase family member 9
Gene AliasMC1DN20
Cytomap3q21.3
Gene Typeprotein-coding
GO ID

GO:0001676

UniProtAcc

Q9H845


Top

Malignant transformation analysis

check button Identification of the aberrant gene expression in precancerous and cancerous lesions by comparing the gene expression of stem-like cells in diseased tissues with normal stem cells
check button Malignant transformation involving gene list.
Entrez IDSymbolReplicatesSpeciesOrganTissueAdj P-valueLog2FCMalignancy
28976ACAD9LZE2THumanEsophagusESCC1.29e-045.22e-010.082
28976ACAD9LZE4THumanEsophagusESCC1.88e-052.21e-010.0811
28976ACAD9LZE7THumanEsophagusESCC1.78e-062.77e-010.0667
28976ACAD9LZE21D1HumanEsophagusHGIN8.59e-033.22e-010.0632
28976ACAD9LZE22THumanEsophagusESCC2.74e-054.50e-010.068
28976ACAD9LZE24THumanEsophagusESCC1.09e-153.81e-010.0596
28976ACAD9P1T-EHumanEsophagusESCC2.55e-084.85e-010.0875
28976ACAD9P2T-EHumanEsophagusESCC2.44e-348.33e-010.1177
28976ACAD9P4T-EHumanEsophagusESCC1.76e-225.55e-010.1323
28976ACAD9P5T-EHumanEsophagusESCC4.58e-153.60e-010.1327
28976ACAD9P8T-EHumanEsophagusESCC2.84e-183.10e-010.0889
28976ACAD9P9T-EHumanEsophagusESCC1.59e-142.98e-010.1131
28976ACAD9P10T-EHumanEsophagusESCC7.52e-164.59e-010.116
28976ACAD9P11T-EHumanEsophagusESCC3.80e-103.88e-010.1426
28976ACAD9P12T-EHumanEsophagusESCC7.69e-245.73e-010.1122
28976ACAD9P15T-EHumanEsophagusESCC1.04e-316.50e-010.1149
28976ACAD9P16T-EHumanEsophagusESCC4.39e-265.49e-010.1153
28976ACAD9P17T-EHumanEsophagusESCC1.65e-083.04e-010.1278
28976ACAD9P19T-EHumanEsophagusESCC4.39e-085.83e-010.1662
28976ACAD9P20T-EHumanEsophagusESCC3.48e-193.87e-010.1124
Page: 1 2 3 4 5 

check button Transcriptomic changes along malignancy continuum.
TissueExpression DynamicsAbbreviation
EsophagusThe image shows the transcriptomic changes along malignancy continuum.log2FC in expression of this searched gene in stem-like cells from each diseased tissue sample relative to stem-like cells in normal samples in each tissue plotted against the malignancy continuum. Samples are colored based on if they are from different disease stage.ESCC: Esophageal squamous cell carcinoma
HGIN: High-grade intraepithelial neoplasias
LGIN: Low-grade intraepithelial neoplasias
LiverThe image shows the transcriptomic changes along malignancy continuum.log2FC in expression of this searched gene in stem-like cells from each diseased tissue sample relative to stem-like cells in normal samples in each tissue plotted against the malignancy continuum. Samples are colored based on if they are from different disease stage.HCC: Hepatocellular carcinoma
NAFLD: Non-alcoholic fatty liver disease
Oral CavityThe image shows the transcriptomic changes along malignancy continuum.log2FC in expression of this searched gene in stem-like cells from each diseased tissue sample relative to stem-like cells in normal samples in each tissue plotted against the malignancy continuum. Samples are colored based on if they are from different disease stage.
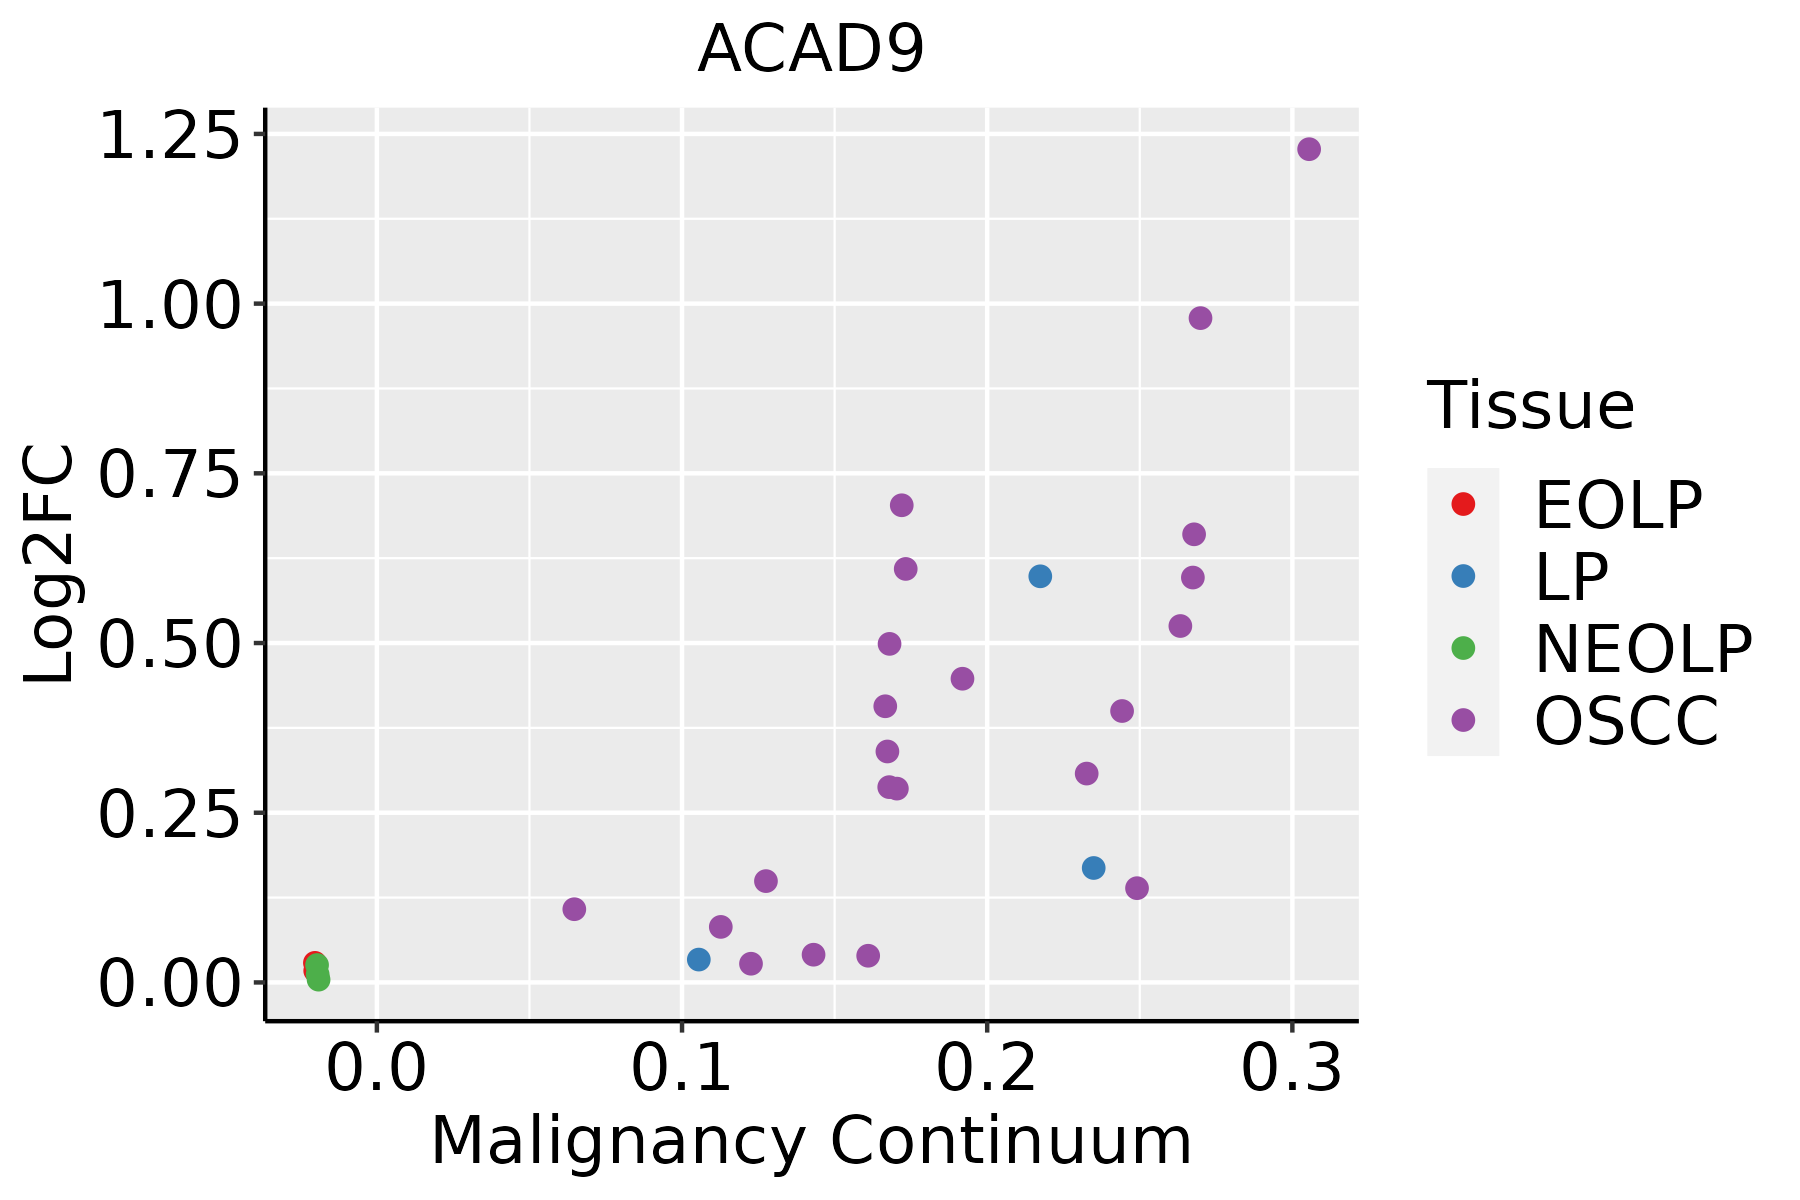
EOLP: Erosive Oral lichen planus
LP: leukoplakia
NEOLP: Non-erosive oral lichen planus
OSCC: Oral squamous cell carcinoma
SkinThe image shows the transcriptomic changes along malignancy continuum.log2FC in expression of this searched gene in stem-like cells from each diseased tissue sample relative to stem-like cells in normal samples in each tissue plotted against the malignancy continuum. Samples are colored based on if they are from different disease stage.
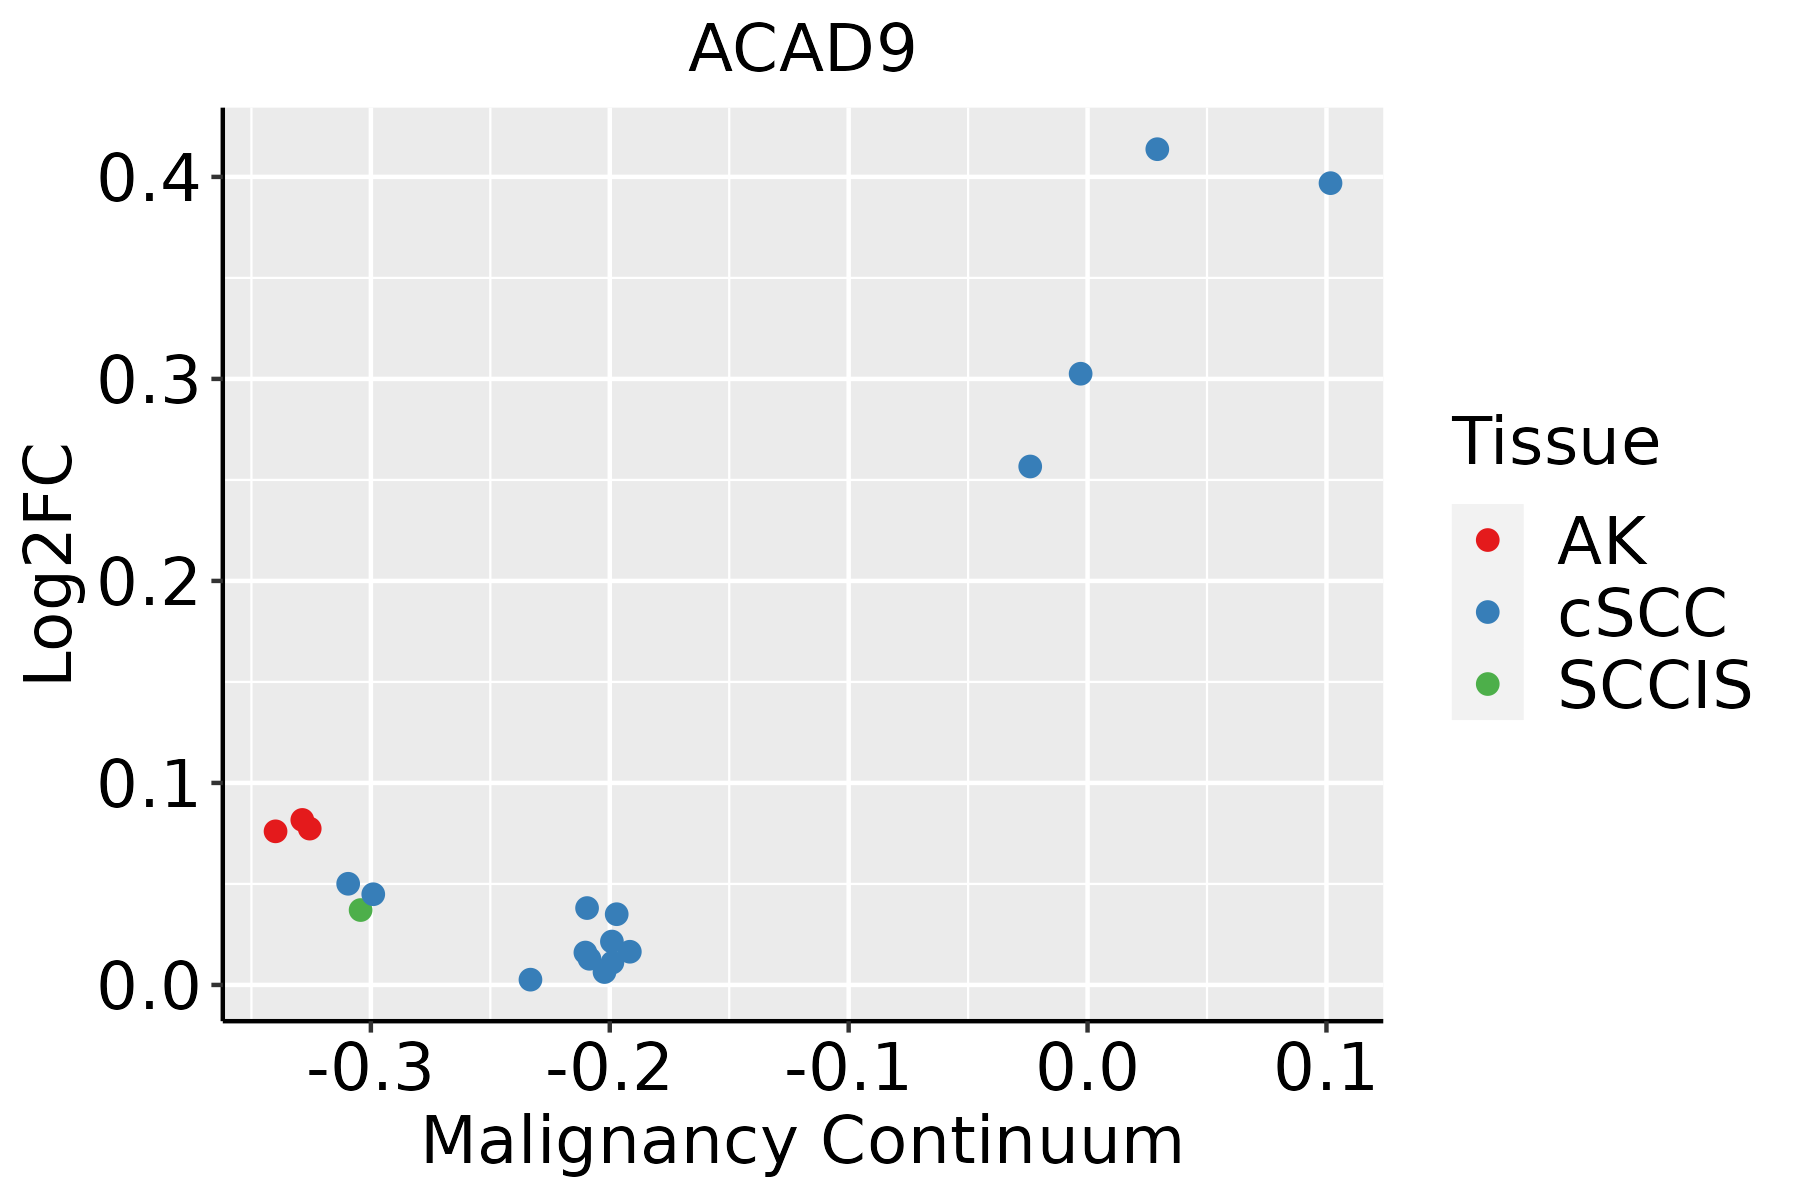
AK: Actinic keratosis
cSCC: Cutaneous squamous cell carcinoma
SCCIS:squamous cell carcinoma in situ
∗log2FC in expression of this searched gene in stem-like cells from each diseased tissue sample relative to stem-like cells in normal samples in each tissue plotted against the malignancy continuum. Samples are colored based on if they are from different disease stage.

Top

Malignant transformation related pathway analysis

check buttonFind out the enriched GO biological processes and KEGG pathways involved in transition from healthy to precancer to cancer
check button Figure of enriched GO biological processes.
TissueDisease StageEnriched GO biological Processes
ColorectumADGO analysis - Figure of enriched GO biological processes: Top 15 enriched GO BP terms are showed in the bar plot of each disease state in each tissue. Each row represents a significant GO biological process which is colored according to the -log10(p.adjust).
ColorectumSERGO analysis - Figure of enriched GO biological processes: Top 15 enriched GO BP terms are showed in the bar plot of each disease state in each tissue. Each row represents a significant GO biological process which is colored according to the -log10(p.adjust).
ColorectumMSSGO analysis - Figure of enriched GO biological processes: Top 15 enriched GO BP terms are showed in the bar plot of each disease state in each tissue. Each row represents a significant GO biological process which is colored according to the -log10(p.adjust).
ColorectumMSI-HGO analysis - Figure of enriched GO biological processes: Top 15 enriched GO BP terms are showed in the bar plot of each disease state in each tissue. Each row represents a significant GO biological process which is colored according to the -log10(p.adjust).
ColorectumFAPGO analysis - Figure of enriched GO biological processes: Top 15 enriched GO BP terms are showed in the bar plot of each disease state in each tissue. Each row represents a significant GO biological process which is colored according to the -log10(p.adjust).
∗Top 15 enriched GO BP terms are showed in the bar plot of each disease state in each tissue. Each row represents a significant GO biological process which is colored according to the -log10(p.adjust).
Page: 1 2 3 4 5 6 7 8 9 

check button Enriched GO biological processes.
GO IDTissueDisease StageDescriptionGene RatioBg Ratiopvaluep.adjustCount
GO:003310820EsophagusHGINmitochondrial respiratory chain complex assembly47/258793/187233.15e-178.60e-1547
GO:001025720EsophagusHGINNADH dehydrogenase complex assembly31/258757/187235.89e-138.62e-1131
GO:003298120EsophagusHGINmitochondrial respiratory chain complex I assembly31/258757/187235.89e-138.62e-1131
GO:0033108110EsophagusESCCmitochondrial respiratory chain complex assembly83/855293/187239.56e-191.05e-1683
GO:0010257110EsophagusESCCNADH dehydrogenase complex assembly50/855257/187233.78e-111.24e-0950
GO:0032981110EsophagusESCCmitochondrial respiratory chain complex I assembly50/855257/187233.78e-111.24e-0950
GO:00066318EsophagusESCCfatty acid metabolic process217/8552390/187234.21e-053.39e-04217
GO:003310812LiverHCCmitochondrial respiratory chain complex assembly80/795893/187233.47e-184.15e-1680
GO:000663122LiverHCCfatty acid metabolic process238/7958390/187238.24e-144.84e-12238
GO:001025712LiverHCCNADH dehydrogenase complex assembly50/795857/187231.50e-127.20e-1150
GO:003298112LiverHCCmitochondrial respiratory chain complex I assembly50/795857/187231.50e-127.20e-1150
GO:000167621LiverHCClong-chain fatty acid metabolic process60/7958112/187231.17e-024.28e-0260
GO:003310818Oral cavityOSCCmitochondrial respiratory chain complex assembly75/730593/187232.17e-161.68e-1475
GO:001025718Oral cavityOSCCNADH dehydrogenase complex assembly45/730557/187238.53e-102.13e-0845
GO:003298118Oral cavityOSCCmitochondrial respiratory chain complex I assembly45/730557/187238.53e-102.13e-0845
GO:00066317Oral cavityOSCCfatty acid metabolic process186/7305390/187232.65e-041.69e-03186
GO:003310819Oral cavityLPmitochondrial respiratory chain complex assembly63/462393/187232.24e-184.13e-1663
GO:001025719Oral cavityLPNADH dehydrogenase complex assembly41/462357/187237.93e-147.89e-1241
GO:003298119Oral cavityLPmitochondrial respiratory chain complex I assembly41/462357/187237.93e-147.89e-1241
GO:003310824SkincSCCmitochondrial respiratory chain complex assembly64/486493/187235.48e-186.58e-1664
Page: 1 2 

check button Enriched KEGG pathways.
Pathway IDTissueDisease StageDescriptionGene RatioBg Ratiopvaluep.adjustqvalueCount
Page: 1 

Top

Cell-cell communication analysis

check buttonIdentification of potential cell-cell interactions between two cell types and their ligand-receptor pairs for different disease states
LigandReceptorLRpairPathwayTissueDisease Stage
Page: 1 

Top

Single-cell gene regulatory network inference analysis

check buttonFind out the significant the regulons (TFs) and the target genes of each regulon across cell types for different disease states
TFCell TypeTissueDisease StageTarget GeneRSSRegulon Activity
∗The dot plots of a searched regulon are shown for all cell subpopulations in each disease state of each tissue based on the regulon specific score inferred using pySCENIC and by calculating the average expression.
Page: 1 

Top

Somatic mutation of malignant transformation related genes

check buttonAnnotation of somatic variants for genes involved in malignant transformation
Hugo SymbolVariant ClassVariant ClassificationdbSNP RSHGVScHGVSpHGVSp ShortSWISSPROTBIOTYPESIFTPolyPhenTumor Sample BarcodeTissueHistologySexAgeStageTherapy TypesDrugsOutcome
ACAD9SNVMissense_Mutationnovelc.1537N>Cp.Glu513Glnp.E513QQ9H845protein_codingdeleterious(0.01)benign(0.139)TCGA-AC-A5XS-01Breastbreast invasive carcinomaFemale>=65I/IIHormone TherapyfemaraSD
ACAD9SNVMissense_Mutationc.1775N>Gp.Glu592Glyp.E592GQ9H845protein_codingtolerated(0.18)benign(0.003)TCGA-AN-A0AK-01Breastbreast invasive carcinomaFemale>=65I/IIUnknownUnknownSD
ACAD9SNVMissense_Mutationc.1771N>Gp.Pro591Alap.P591AQ9H845protein_codingtolerated(0.51)benign(0.012)TCGA-BH-A0BA-01Breastbreast invasive carcinomaFemale<65III/IVChemotherapycytoxanSD
ACAD9SNVMissense_Mutationc.1048N>Ap.Ala350Thrp.A350TQ9H845protein_codingtolerated(0.16)possibly_damaging(0.495)TCGA-BH-A0HF-01Breastbreast invasive carcinomaFemale>=65I/IIHormone TherapyarimidexSD
ACAD9insertionIn_Frame_Insnovelc.661_662insCCAACACCATGTACTCAAGACTAGGGGAGATCATCAGCATGGp.Asn221delinsThrAsnThrMetTyrSerArgLeuGlyGluIleIleSerMetAspp.N221delinsTNTMYSRLGEIISMDQ9H845protein_codingTCGA-A8-A07G-01Breastbreast invasive carcinomaFemale>=65I/IIChemotherapy5-fluorouracilCR
ACAD9SNVMissense_Mutationrs781520431c.1336N>Tp.Arg446Cysp.R446CQ9H845protein_codingdeleterious(0)benign(0.003)TCGA-VS-A9U6-01Cervixcervical & endocervical cancerFemale<65I/IIChemotherapycisplatinPD
ACAD9SNVMissense_Mutationc.362N>Tp.Ser121Phep.S121FQ9H845protein_codingdeleterious(0)probably_damaging(0.995)TCGA-AA-3710-01Colorectumcolon adenocarcinomaFemale>=65I/IIUnknownUnknownSD
ACAD9SNVMissense_Mutationrs748758547c.231C>Ap.Phe77Leup.F77LQ9H845protein_codingdeleterious(0.03)probably_damaging(0.978)TCGA-AA-A010-01Colorectumcolon adenocarcinomaFemale<65I/IIChemotherapyfolinicCR
ACAD9SNVMissense_Mutationrs201248046c.1009N>Gp.Ser337Glyp.S337GQ9H845protein_codingtolerated(0.14)benign(0.039)TCGA-AA-A02R-01Colorectumcolon adenocarcinomaFemale>=65I/IIUnknownUnknownPD
ACAD9SNVMissense_Mutationnovelc.758N>Ap.Gly253Glup.G253EQ9H845protein_codingdeleterious(0)probably_damaging(1)TCGA-AM-5820-01Colorectumcolon adenocarcinomaFemale<65I/IIUnknownUnknownSD
Page: 1 2 3 4 5 6 7 8 

Top

Related drugs of malignant transformation related genes

check buttonIdentification of chemicals and drugs interact with genes involved in malignant transfromation
(DGIdb 4.0)
Entrez IDSymbolCategoryInteraction TypesDrug Claim NameDrug NamePMIDs
Page: 1