
|
|||||
|
 | |
| |
| |
| |
| |
| |
|
Gene: ACAD10 |
Gene summary for ACAD10 |
| Gene information | Species | Human | Gene symbol | ACAD10 | Gene ID | 80724 |
| Gene name | acyl-CoA dehydrogenase family member 10 | |
| Gene Alias | ACAD10 | |
| Cytomap | 12q24.12 | |
| Gene Type | protein-coding | GO ID | GO:0006082 | UniProtAcc | Q6JQN1 |
Top |
Malignant transformation analysis |
| Identification of the aberrant gene expression in precancerous and cancerous lesions by comparing the gene expression of stem-like cells in diseased tissues with normal stem cells |
| Entrez ID | Symbol | Replicates | Species | Organ | Tissue | Adj P-value | Log2FC | Malignancy |
| 80724 | ACAD10 | HCC1_Meng | Human | Liver | HCC | 1.73e-32 | 4.62e-02 | 0.0246 |
| 80724 | ACAD10 | HCC2_Meng | Human | Liver | HCC | 9.46e-03 | 5.91e-04 | 0.0107 |
| 80724 | ACAD10 | HCC2 | Human | Liver | HCC | 2.47e-11 | 3.45e+00 | 0.5341 |
| 80724 | ACAD10 | S014 | Human | Liver | HCC | 4.26e-07 | 3.98e-01 | 0.2254 |
| 80724 | ACAD10 | S015 | Human | Liver | HCC | 4.04e-08 | 5.73e-01 | 0.2375 |
| 80724 | ACAD10 | S016 | Human | Liver | HCC | 1.29e-09 | 5.34e-01 | 0.2243 |
| 80724 | ACAD10 | S028 | Human | Liver | HCC | 7.06e-03 | 2.97e-01 | 0.2503 |
| 80724 | ACAD10 | S029 | Human | Liver | HCC | 3.41e-02 | 2.60e-01 | 0.2581 |
| Page: 1 |
| Tissue | Expression Dynamics | Abbreviation |
| Liver | 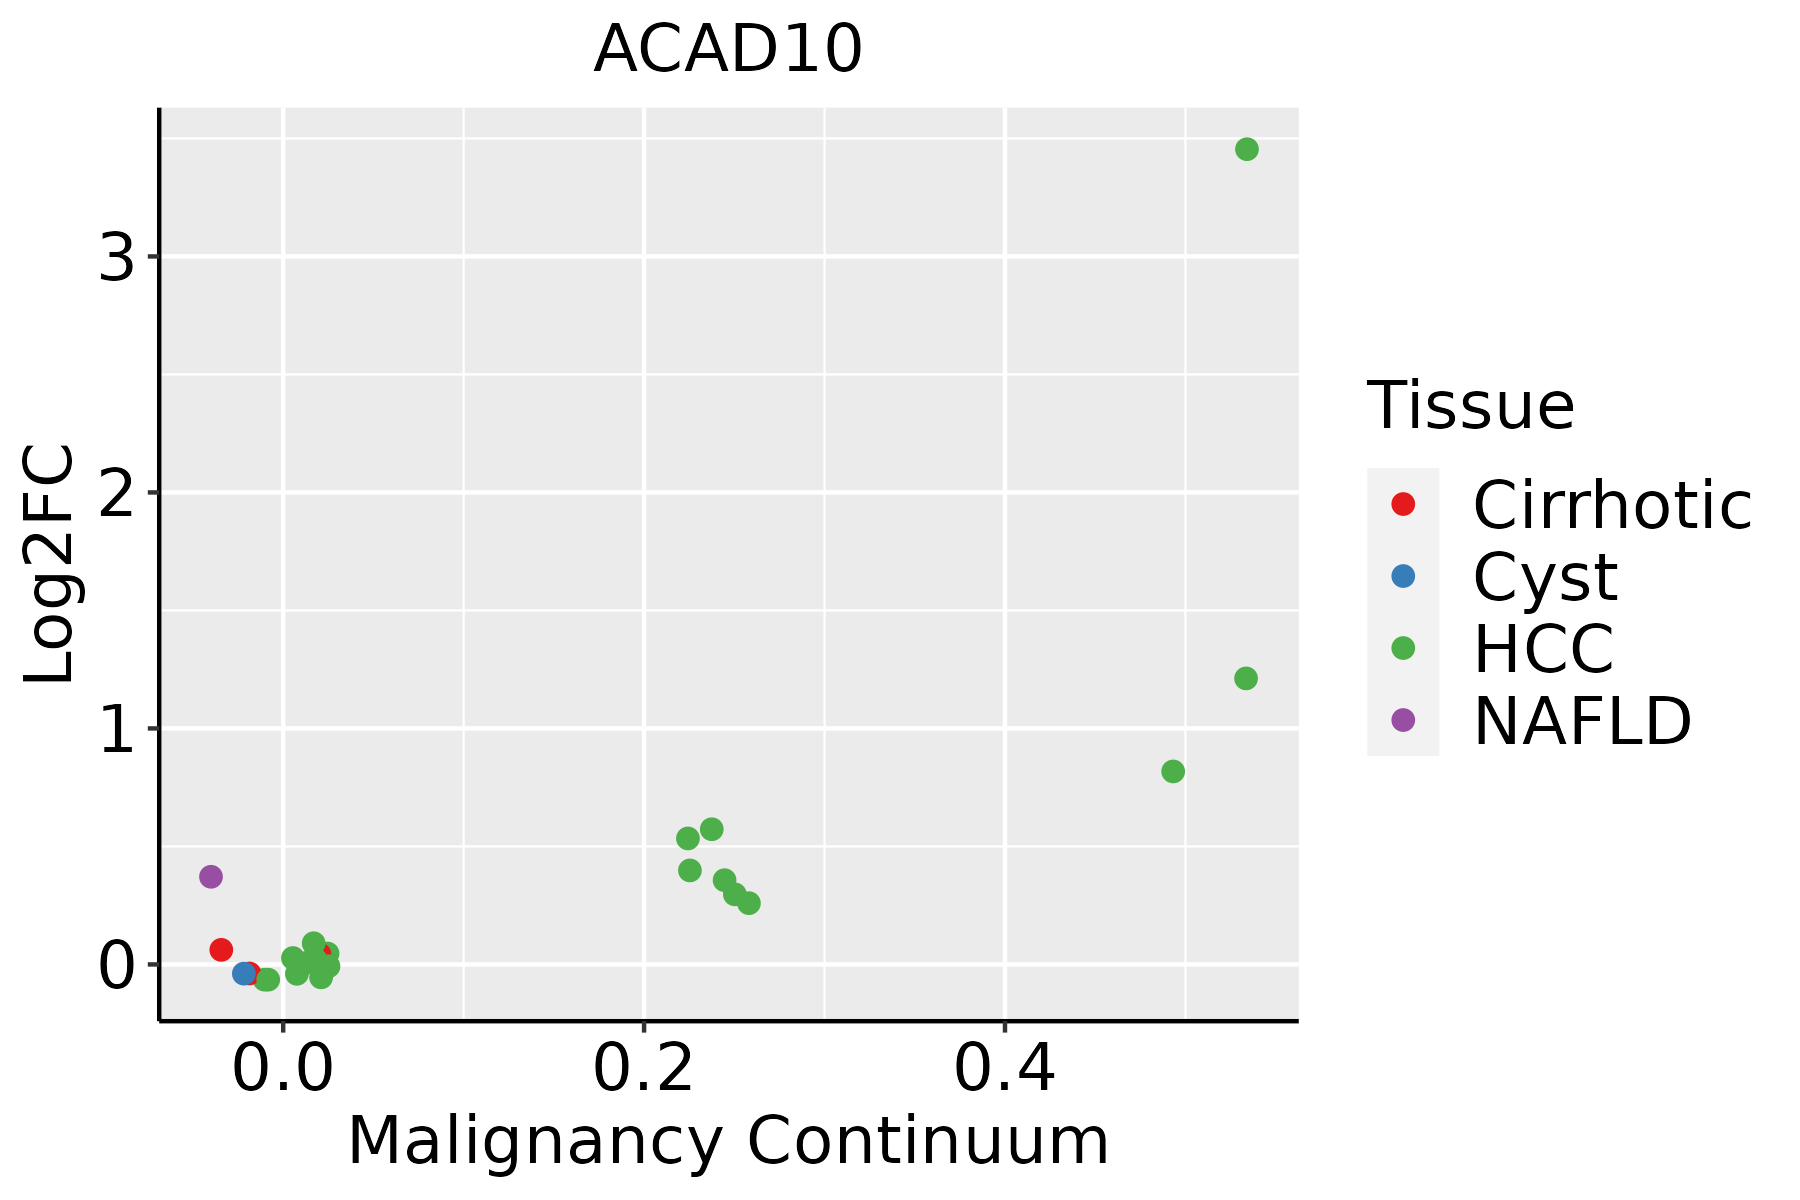 | HCC: Hepatocellular carcinoma |
| NAFLD: Non-alcoholic fatty liver disease |
| ∗log2FC in expression of this searched gene in stem-like cells from each diseased tissue sample relative to stem-like cells in normal samples in each tissue plotted against the malignancy continuum. Samples are colored based on if they are from different disease stage. |
Top |
Malignant transformation related pathway analysis |
| Find out the enriched GO biological processes and KEGG pathways involved in transition from healthy to precancer to cancer |
| Tissue | Disease Stage | Enriched GO biological Processes |
| Colorectum | AD |  |
| Colorectum | SER |  |
| Colorectum | MSS |  |
| Colorectum | MSI-H |  |
| Colorectum | FAP |  |
| ∗Top 15 enriched GO BP terms are showed in the bar plot of each disease state in each tissue. Each row represents a significant GO biological process which is colored according to the -log10(p.adjust). |
| Page: 1 2 3 4 5 6 7 8 9 |
| GO ID | Tissue | Disease Stage | Description | Gene Ratio | Bg Ratio | pvalue | p.adjust | Count |
| GO:000663122 | Liver | HCC | fatty acid metabolic process | 238/7958 | 390/18723 | 8.24e-14 | 4.84e-12 | 238 |
| GO:004428221 | Liver | HCC | small molecule catabolic process | 225/7958 | 376/18723 | 6.50e-12 | 2.80e-10 | 225 |
| GO:001605421 | Liver | HCC | organic acid catabolic process | 152/7958 | 240/18723 | 5.11e-11 | 1.92e-09 | 152 |
| GO:00463952 | Liver | HCC | carboxylic acid catabolic process | 149/7958 | 236/18723 | 1.11e-10 | 3.87e-09 | 149 |
| GO:004424222 | Liver | HCC | cellular lipid catabolic process | 134/7958 | 214/18723 | 2.07e-09 | 5.79e-08 | 134 |
| GO:001939522 | Liver | HCC | fatty acid oxidation | 72/7958 | 103/18723 | 1.63e-08 | 3.92e-07 | 72 |
| GO:000906221 | Liver | HCC | fatty acid catabolic process | 70/7958 | 100/18723 | 2.34e-08 | 5.44e-07 | 70 |
| GO:003444021 | Liver | HCC | lipid oxidation | 73/7958 | 108/18723 | 1.17e-07 | 2.25e-06 | 73 |
| GO:007232921 | Liver | HCC | monocarboxylic acid catabolic process | 80/7958 | 122/18723 | 2.18e-07 | 3.91e-06 | 80 |
| GO:000663521 | Liver | HCC | fatty acid beta-oxidation | 52/7958 | 74/18723 | 1.22e-06 | 1.80e-05 | 52 |
| GO:003025821 | Liver | HCC | lipid modification | 123/7958 | 212/18723 | 3.50e-06 | 4.58e-05 | 123 |
| GO:001604221 | Liver | HCC | lipid catabolic process | 175/7958 | 320/18723 | 6.50e-06 | 7.88e-05 | 175 |
| Page: 1 |
| Pathway ID | Tissue | Disease Stage | Description | Gene Ratio | Bg Ratio | pvalue | p.adjust | qvalue | Count |
| Page: 1 |
Top |
Cell-cell communication analysis |
| Identification of potential cell-cell interactions between two cell types and their ligand-receptor pairs for different disease states |
| Ligand | Receptor | LRpair | Pathway | Tissue | Disease Stage |
| Page: 1 |
Top |
Single-cell gene regulatory network inference analysis |
| Find out the significant the regulons (TFs) and the target genes of each regulon across cell types for different disease states |
| TF | Cell Type | Tissue | Disease Stage | Target Gene | RSS | Regulon Activity |
| ∗The dot plots of a searched regulon are shown for all cell subpopulations in each disease state of each tissue based on the regulon specific score inferred using pySCENIC and by calculating the average expression. |
| Page: 1 |
Top |
Somatic mutation of malignant transformation related genes |
| Annotation of somatic variants for genes involved in malignant transformation |
| Hugo Symbol | Variant Class | Variant Classification | dbSNP RS | HGVSc | HGVSp | HGVSp Short | SWISSPROT | BIOTYPE | SIFT | PolyPhen | Tumor Sample Barcode | Tissue | Histology | Sex | Age | Stage | Therapy Types | Drugs | Outcome |
| ACAD10 | SNV | Missense_Mutation | novel | c.3055G>A | p.Ala1019Thr | p.A1019T | Q6JQN1 | protein_coding | tolerated(0.22) | benign(0.092) | TCGA-A8-A08P-01 | Breast | breast invasive carcinoma | Female | >=65 | III/IV | Chemotherapy | 5-fluorouracil | CR |
| ACAD10 | SNV | Missense_Mutation | novel | c.1307N>G | p.Ala436Gly | p.A436G | Q6JQN1 | protein_coding | deleterious(0.02) | possibly_damaging(0.669) | TCGA-A8-A09M-01 | Breast | breast invasive carcinoma | Female | >=65 | III/IV | Chemotherapy | paclitaxel | CR |
| ACAD10 | SNV | Missense_Mutation | rs766583324 | c.436N>T | p.Arg146Trp | p.R146W | Q6JQN1 | protein_coding | deleterious(0) | probably_damaging(0.989) | TCGA-AN-A046-01 | Breast | breast invasive carcinoma | Female | >=65 | I/II | Unknown | Unknown | SD |
| ACAD10 | SNV | Missense_Mutation | rs370710385 | c.2593N>T | p.Arg865Cys | p.R865C | Q6JQN1 | protein_coding | tolerated(0.08) | benign(0.245) | TCGA-AN-A0AJ-01 | Breast | breast invasive carcinoma | Female | >=65 | I/II | Unknown | Unknown | SD |
| ACAD10 | SNV | Missense_Mutation | novel | c.2681C>A | p.Thr894Asn | p.T894N | Q6JQN1 | protein_coding | deleterious(0) | possibly_damaging(0.885) | TCGA-AR-A1AH-01 | Breast | breast invasive carcinoma | Female | <65 | I/II | Unspecific | PD | |
| ACAD10 | SNV | Missense_Mutation | rs750824318 | c.1012C>T | p.Arg338Cys | p.R338C | Q6JQN1 | protein_coding | deleterious(0.02) | possibly_damaging(0.764) | TCGA-D8-A13Z-01 | Breast | breast invasive carcinoma | Female | <65 | I/II | Chemotherapy | doxorubicine | SD |
| ACAD10 | SNV | Missense_Mutation | novel | c.295N>C | p.Glu99Gln | p.E99Q | Q6JQN1 | protein_coding | tolerated(0.07) | benign(0.073) | TCGA-EW-A1J5-01 | Breast | breast invasive carcinoma | Female | <65 | I/II | Chemotherapy | adriamycin | SD |
| ACAD10 | SNV | Missense_Mutation | novel | c.1709N>C | p.Met570Thr | p.M570T | Q6JQN1 | protein_coding | tolerated(0.7) | benign(0.005) | TCGA-LL-A5YM-01 | Breast | breast invasive carcinoma | Female | >=65 | III/IV | Unspecific | letrozole | PD |
| ACAD10 | insertion | Frame_Shift_Ins | novel | c.2116_2117insTAGAACTATCAATTTATCCATTTATTGGGTAC | p.Glu706ValfsTer37 | p.E706Vfs*37 | Q6JQN1 | protein_coding | TCGA-A8-A0A2-01 | Breast | breast invasive carcinoma | Female | >=65 | I/II | Hormone Therapy | tamoxiphen | SD | ||
| ACAD10 | insertion | Frame_Shift_Ins | novel | c.3044_3045insGTGT | p.Gly1016CysfsTer14 | p.G1016Cfs*14 | Q6JQN1 | protein_coding | TCGA-A8-A0A6-01 | Breast | breast invasive carcinoma | Female | <65 | III/IV | Chemotherapy | epirubicin | CR |
| Page: 1 2 3 4 5 6 7 8 9 10 |
Top |
Related drugs of malignant transformation related genes |
| Identification of chemicals and drugs interact with genes involved in malignant transfromation |
| (DGIdb 4.0) |
| Entrez ID | Symbol | Category | Interaction Types | Drug Claim Name | Drug Name | PMIDs |
| Page: 1 |

Copyright 2023-Present -The University of Texas Health Science Center at Houston |