
|
|||||
|
 | |
| |
| |
| |
| |
| |
|
Gene: ACACA |
Gene summary for ACACA |
| Gene information | Species | Human | Gene symbol | ACACA | Gene ID | 31 |
| Gene name | acetyl-CoA carboxylase alpha | |
| Gene Alias | ACAC | |
| Cytomap | 17q12 | |
| Gene Type | protein-coding | GO ID | GO:0001894 | UniProtAcc | B2ZZ90 |
Top |
Malignant transformation analysis |
| Identification of the aberrant gene expression in precancerous and cancerous lesions by comparing the gene expression of stem-like cells in diseased tissues with normal stem cells |
| Entrez ID | Symbol | Replicates | Species | Organ | Tissue | Adj P-value | Log2FC | Malignancy |
| 31 | ACACA | CCI_1 | Human | Cervix | CC | 4.58e-12 | 1.18e+00 | 0.528 |
| 31 | ACACA | CCI_2 | Human | Cervix | CC | 2.23e-13 | 1.25e+00 | 0.5249 |
| 31 | ACACA | CCI_3 | Human | Cervix | CC | 4.35e-43 | 1.72e+00 | 0.516 |
| 31 | ACACA | CCII_1 | Human | Cervix | CC | 2.61e-09 | 4.51e-01 | 0.3249 |
| 31 | ACACA | HTA11_3410_2000001011 | Human | Colorectum | AD | 1.91e-20 | -6.97e-01 | 0.0155 |
| 31 | ACACA | HTA11_2951_2000001011 | Human | Colorectum | AD | 1.24e-02 | -6.88e-01 | 0.0216 |
| 31 | ACACA | HTA11_83_2000001011 | Human | Colorectum | SER | 5.65e-03 | -4.77e-01 | -0.1526 |
| 31 | ACACA | HTA11_2992_2000001011 | Human | Colorectum | SER | 1.71e-02 | -6.60e-01 | -0.1706 |
| 31 | ACACA | HTA11_5212_2000001011 | Human | Colorectum | AD | 2.17e-02 | -7.01e-01 | -0.2061 |
| 31 | ACACA | HTA11_5216_2000001011 | Human | Colorectum | SER | 7.96e-03 | -6.38e-01 | -0.1462 |
| 31 | ACACA | HTA11_7862_2000001011 | Human | Colorectum | AD | 4.67e-02 | -5.47e-01 | -0.0179 |
| 31 | ACACA | HTA11_866_3004761011 | Human | Colorectum | AD | 2.28e-12 | -5.71e-01 | 0.096 |
| 31 | ACACA | HTA11_9408_2000001011 | Human | Colorectum | AD | 8.93e-03 | -8.33e-01 | 0.0451 |
| 31 | ACACA | HTA11_8622_2000001021 | Human | Colorectum | SER | 8.95e-04 | -5.94e-01 | 0.0528 |
| 31 | ACACA | HTA11_99999970781_79442 | Human | Colorectum | MSS | 3.42e-05 | -3.91e-01 | 0.294 |
| 31 | ACACA | HTA11_99999965104_69814 | Human | Colorectum | MSS | 3.66e-04 | 6.50e-01 | 0.281 |
| 31 | ACACA | F007 | Human | Colorectum | FAP | 1.19e-08 | -6.20e-01 | 0.1176 |
| 31 | ACACA | A002-C-010 | Human | Colorectum | FAP | 5.54e-04 | -2.96e-01 | 0.242 |
| 31 | ACACA | A001-C-207 | Human | Colorectum | FAP | 9.06e-17 | -7.37e-01 | 0.1278 |
| 31 | ACACA | A015-C-203 | Human | Colorectum | FAP | 5.66e-44 | -8.21e-01 | -0.1294 |
| Page: 1 2 3 4 5 6 7 8 9 10 |
| Tissue | Expression Dynamics | Abbreviation |
| Cervix | 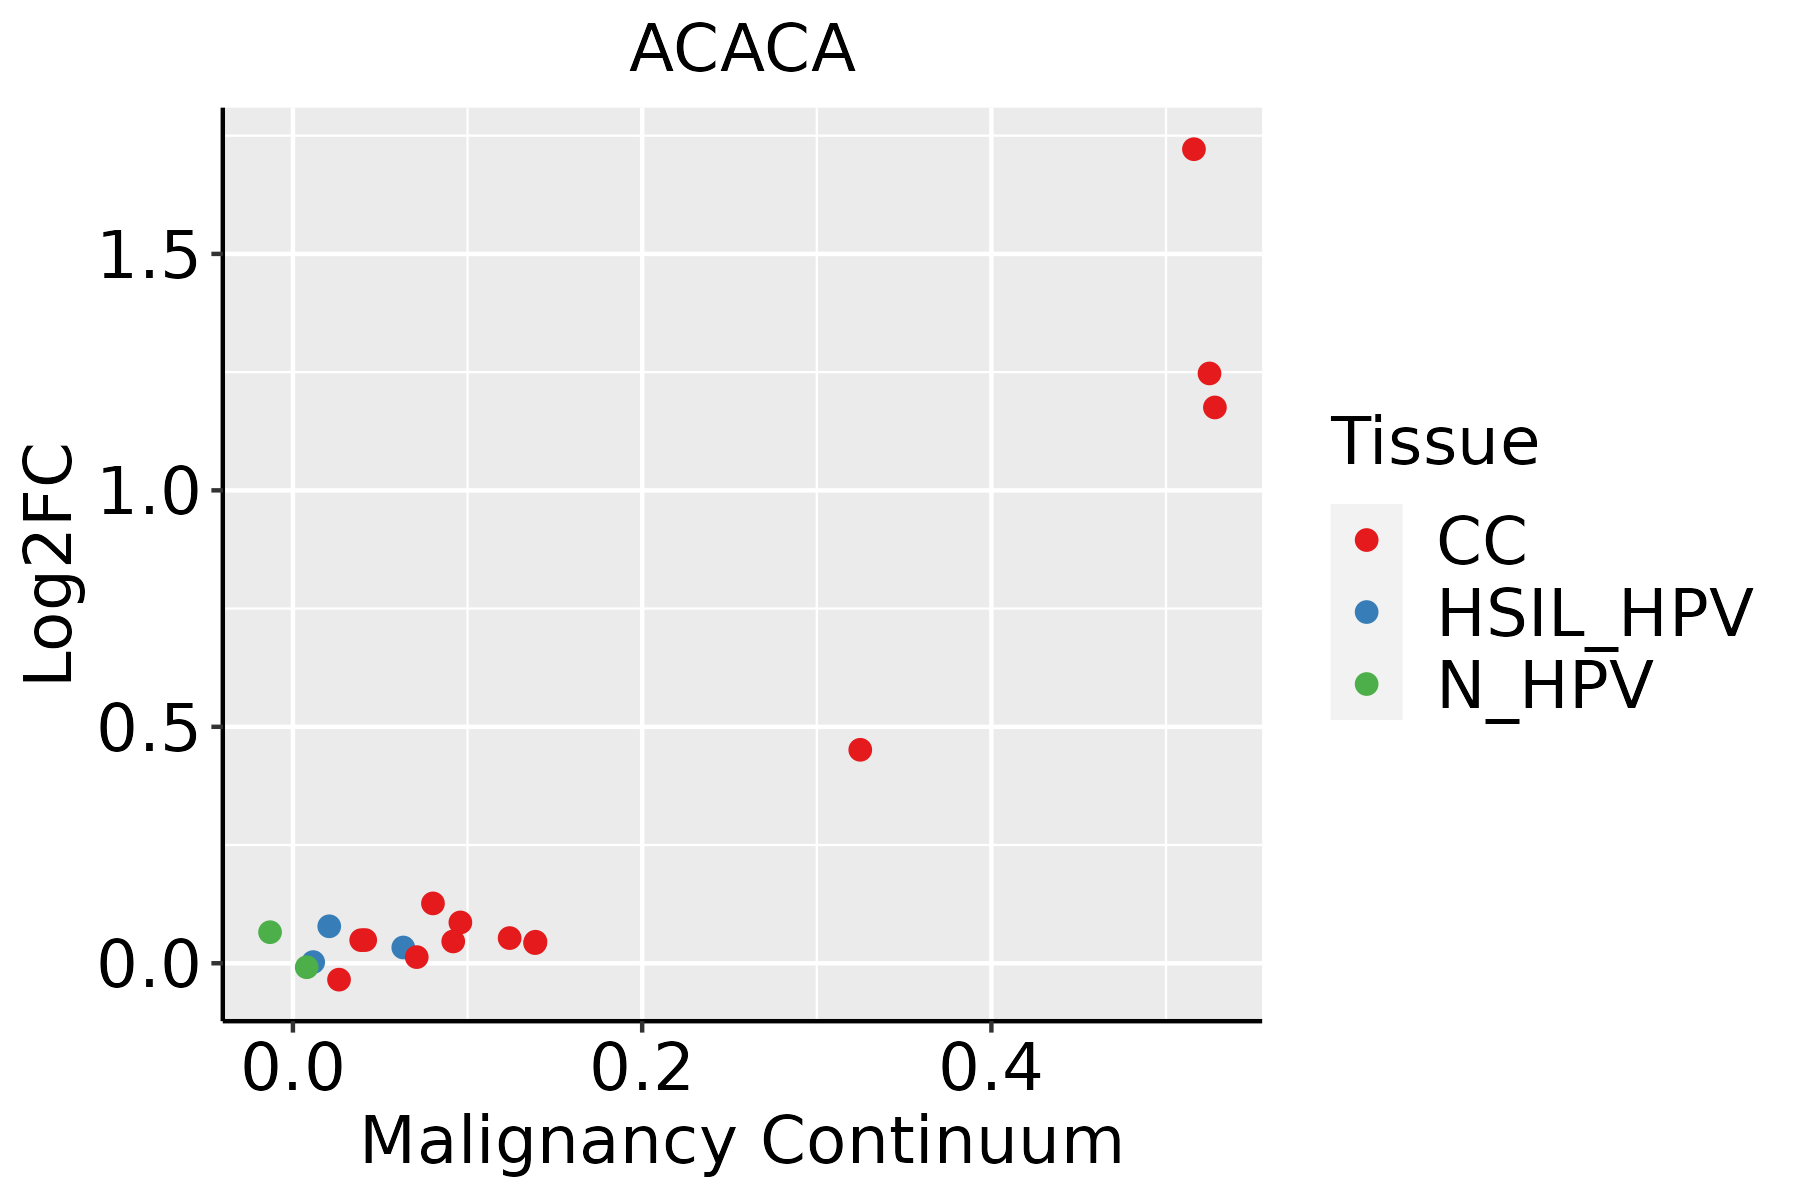 | CC: Cervix cancer |
| HSIL_HPV: HPV-infected high-grade squamous intraepithelial lesions | ||
| N_HPV: HPV-infected normal cervix | ||
| Colorectum (GSE201348) |  | FAP: Familial adenomatous polyposis |
| CRC: Colorectal cancer | ||
| Colorectum (HTA11) | 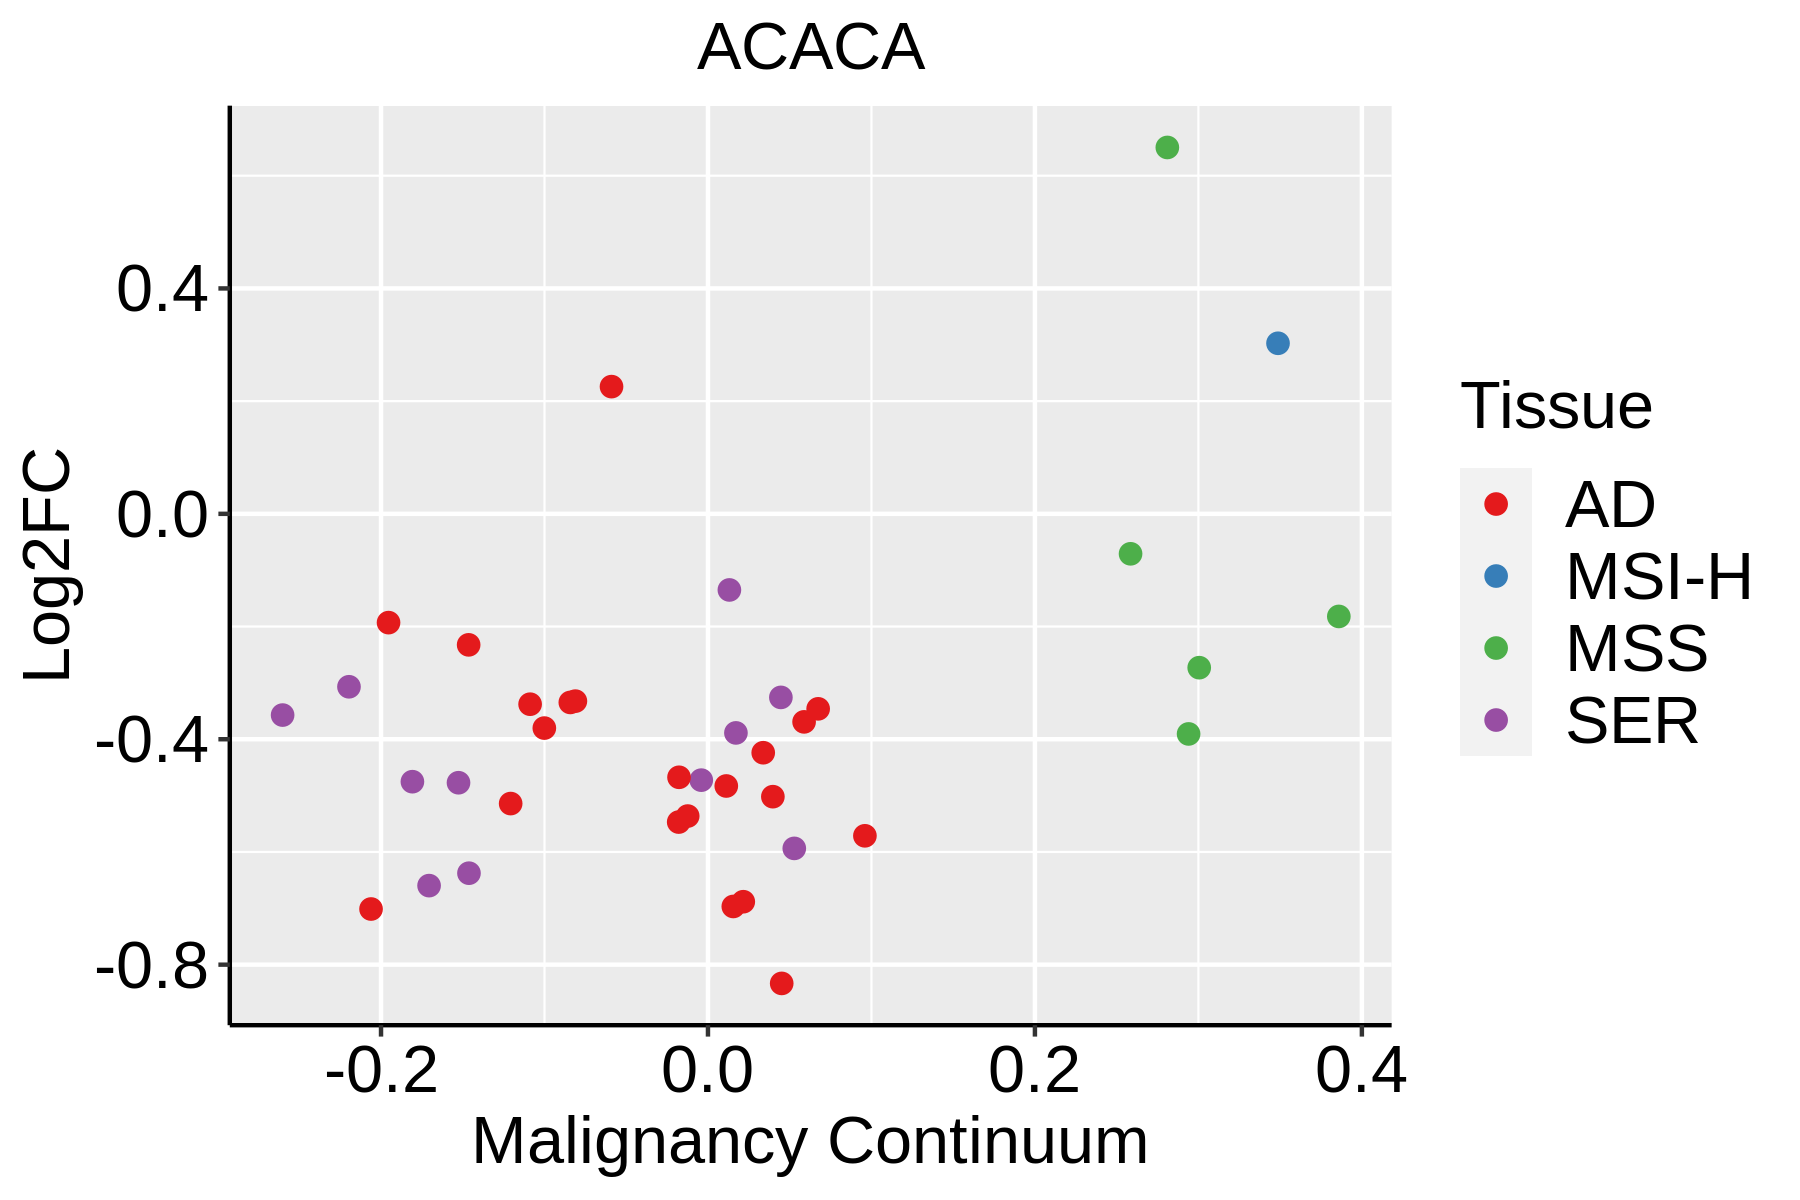 | AD: Adenomas |
| SER: Sessile serrated lesions | ||
| MSI-H: Microsatellite-high colorectal cancer | ||
| MSS: Microsatellite stable colorectal cancer | ||
| Endometrium |  | AEH: Atypical endometrial hyperplasia |
| EEC: Endometrioid Cancer | ||
| Esophagus |  | ESCC: Esophageal squamous cell carcinoma |
| HGIN: High-grade intraepithelial neoplasias | ||
| LGIN: Low-grade intraepithelial neoplasias | ||
| Liver | 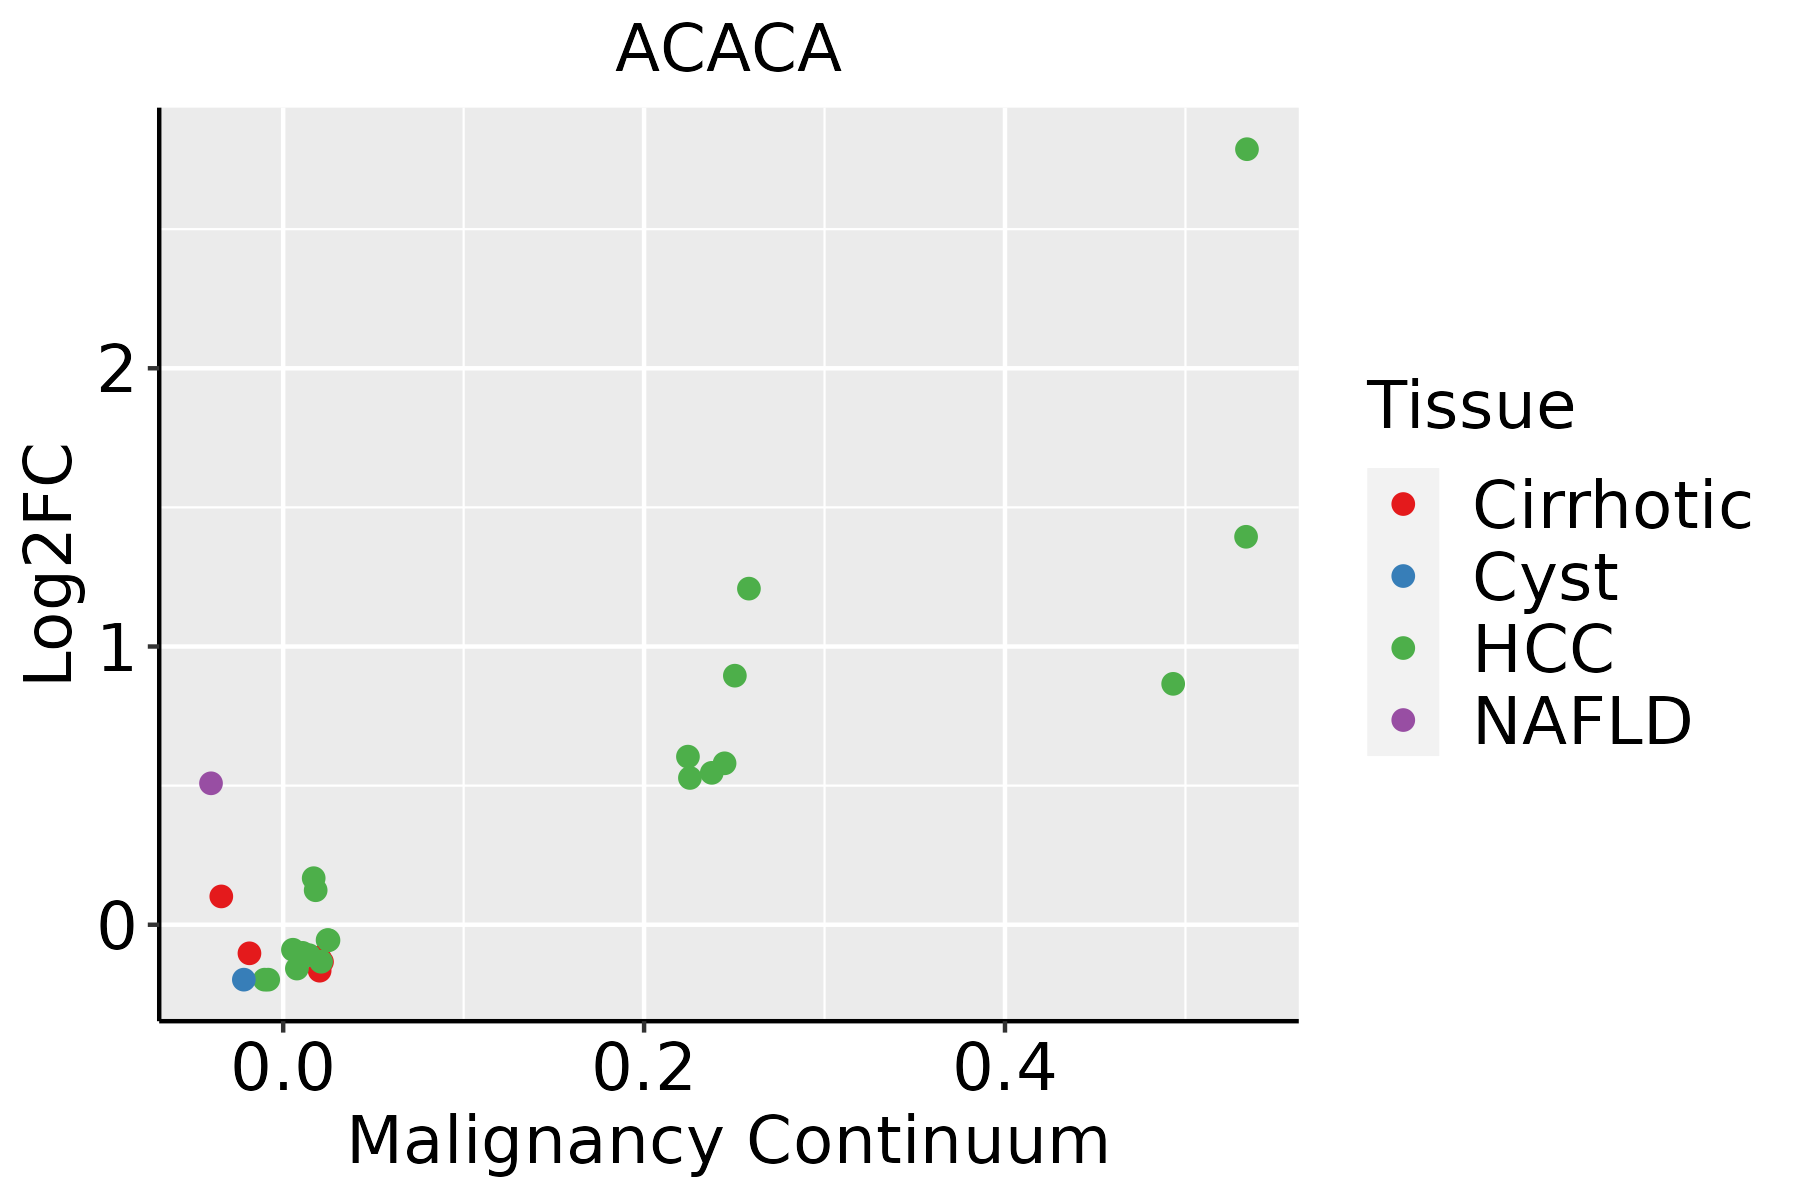 | HCC: Hepatocellular carcinoma |
| NAFLD: Non-alcoholic fatty liver disease | ||
| Lung | 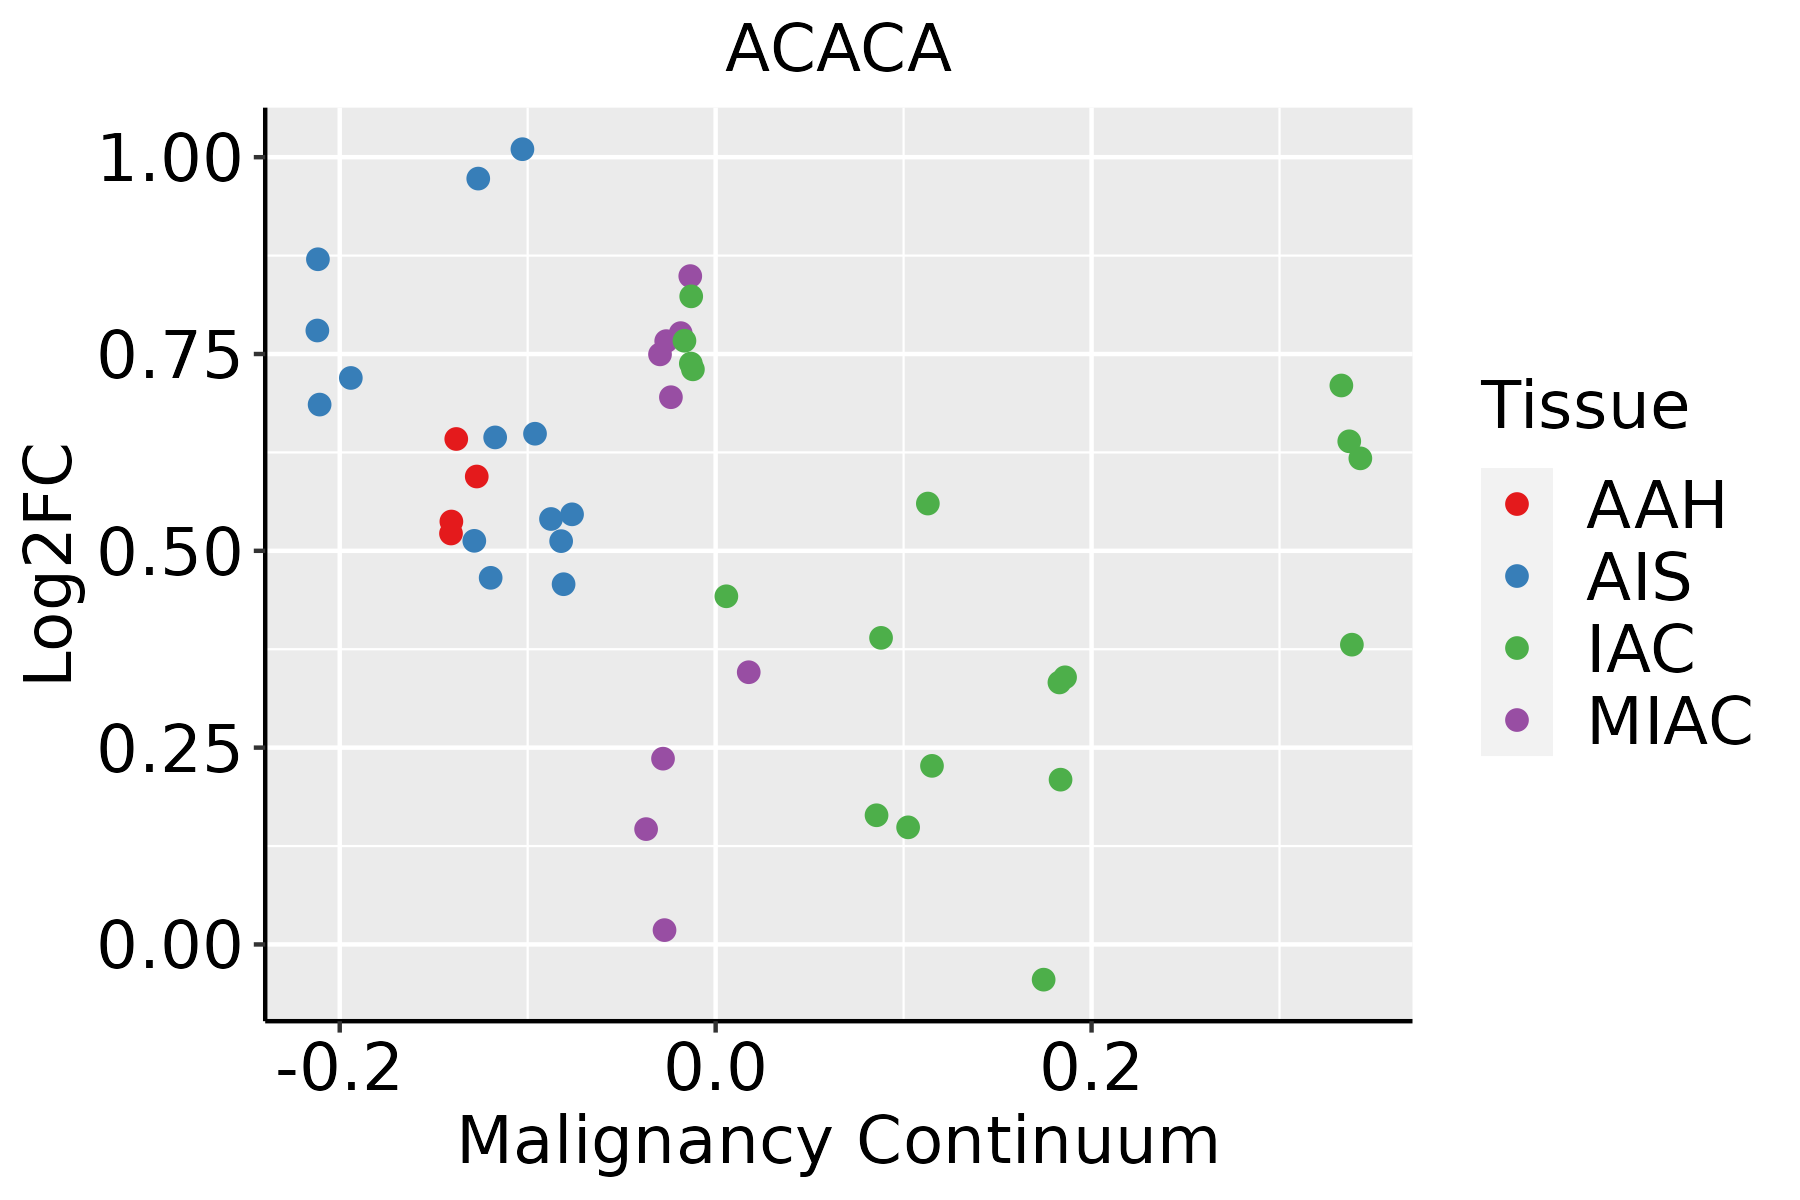 | AAH: Atypical adenomatous hyperplasia |
| AIS: Adenocarcinoma in situ | ||
| IAC: Invasive lung adenocarcinoma | ||
| MIA: Minimally invasive adenocarcinoma | ||
| Oral Cavity |  | EOLP: Erosive Oral lichen planus |
| LP: leukoplakia | ||
| NEOLP: Non-erosive oral lichen planus | ||
| OSCC: Oral squamous cell carcinoma | ||
| Prostate | 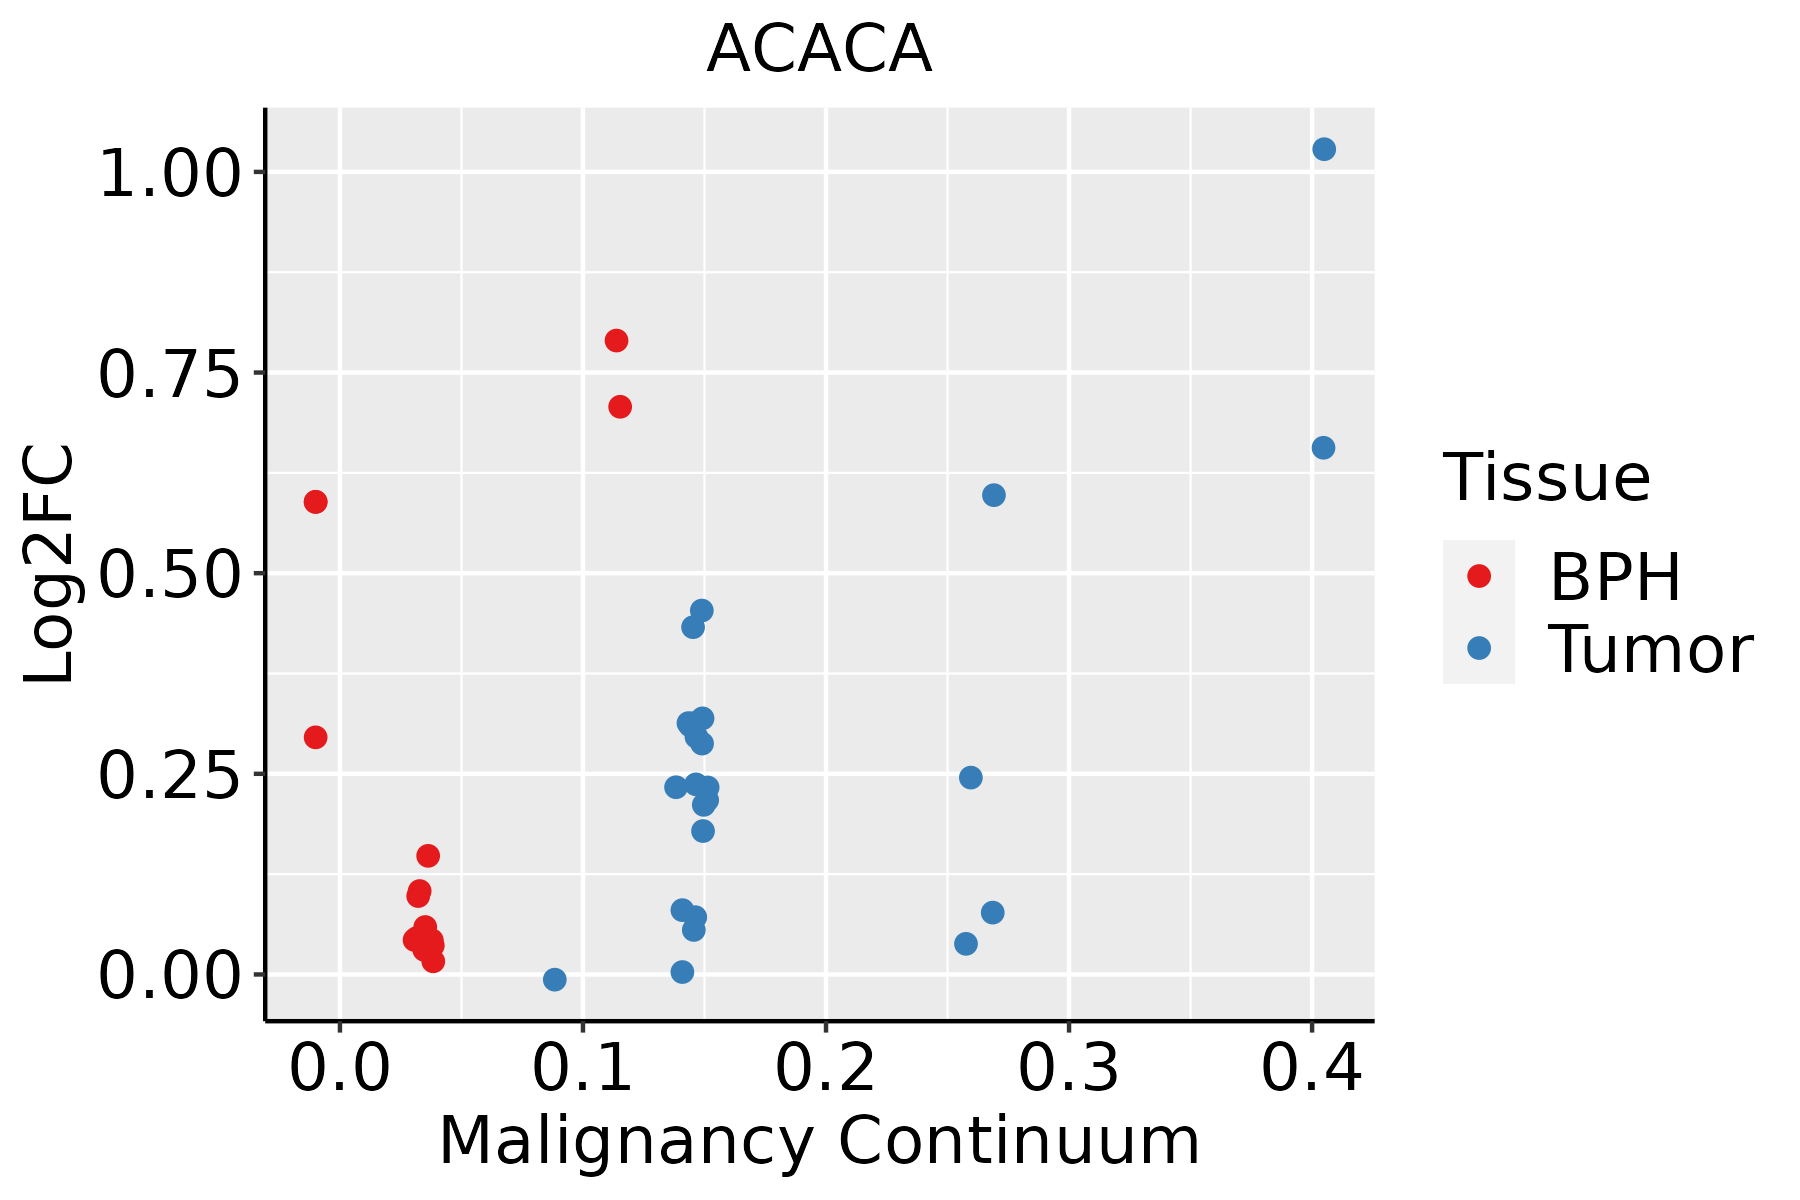 | BPH: Benign Prostatic Hyperplasia |
| ∗log2FC in expression of this searched gene in stem-like cells from each diseased tissue sample relative to stem-like cells in normal samples in each tissue plotted against the malignancy continuum. Samples are colored based on if they are from different disease stage. |
Top |
Malignant transformation related pathway analysis |
| Find out the enriched GO biological processes and KEGG pathways involved in transition from healthy to precancer to cancer |
| Tissue | Disease Stage | Enriched GO biological Processes |
| Colorectum | AD |  |
| Colorectum | SER |  |
| Colorectum | MSS |  |
| Colorectum | MSI-H |  |
| Colorectum | FAP |  |
| ∗Top 15 enriched GO BP terms are showed in the bar plot of each disease state in each tissue. Each row represents a significant GO biological process which is colored according to the -log10(p.adjust). |
| Page: 1 2 3 4 5 6 7 8 9 |
| GO ID | Tissue | Disease Stage | Description | Gene Ratio | Bg Ratio | pvalue | p.adjust | Count |
| GO:190165410 | Cervix | CC | response to ketone | 45/2311 | 194/18723 | 1.83e-05 | 3.44e-04 | 45 |
| GO:00018949 | Cervix | CC | tissue homeostasis | 57/2311 | 268/18723 | 2.43e-05 | 4.21e-04 | 57 |
| GO:00602498 | Cervix | CC | anatomical structure homeostasis | 63/2311 | 314/18723 | 6.03e-05 | 8.68e-04 | 63 |
| GO:00196939 | Cervix | CC | ribose phosphate metabolic process | 72/2311 | 396/18723 | 4.49e-04 | 4.48e-03 | 72 |
| GO:00092599 | Cervix | CC | ribonucleotide metabolic process | 70/2311 | 385/18723 | 5.35e-04 | 5.18e-03 | 70 |
| GO:00463908 | Cervix | CC | ribose phosphate biosynthetic process | 39/2311 | 190/18723 | 9.02e-04 | 7.77e-03 | 39 |
| GO:000915010 | Cervix | CC | purine ribonucleotide metabolic process | 66/2311 | 368/18723 | 1.09e-03 | 9.07e-03 | 66 |
| GO:00092608 | Cervix | CC | ribonucleotide biosynthetic process | 37/2311 | 182/18723 | 1.44e-03 | 1.13e-02 | 37 |
| GO:00091529 | Cervix | CC | purine ribonucleotide biosynthetic process | 34/2311 | 169/18723 | 2.62e-03 | 1.81e-02 | 34 |
| GO:00973059 | Cervix | CC | response to alcohol | 46/2311 | 253/18723 | 4.40e-03 | 2.69e-02 | 46 |
| GO:000616310 | Cervix | CC | purine nucleotide metabolic process | 67/2311 | 396/18723 | 4.41e-03 | 2.69e-02 | 67 |
| GO:007252110 | Cervix | CC | purine-containing compound metabolic process | 69/2311 | 416/18723 | 6.27e-03 | 3.54e-02 | 69 |
| GO:000911710 | Cervix | CC | nucleotide metabolic process | 79/2311 | 489/18723 | 7.16e-03 | 3.85e-02 | 79 |
| GO:0009150 | Colorectum | AD | purine ribonucleotide metabolic process | 142/3918 | 368/18723 | 4.29e-15 | 1.17e-12 | 142 |
| GO:0006163 | Colorectum | AD | purine nucleotide metabolic process | 149/3918 | 396/18723 | 1.08e-14 | 2.80e-12 | 149 |
| GO:0072521 | Colorectum | AD | purine-containing compound metabolic process | 153/3918 | 416/18723 | 4.34e-14 | 1.01e-11 | 153 |
| GO:0009259 | Colorectum | AD | ribonucleotide metabolic process | 144/3918 | 385/18723 | 5.25e-14 | 1.13e-11 | 144 |
| GO:0019693 | Colorectum | AD | ribose phosphate metabolic process | 145/3918 | 396/18723 | 3.01e-13 | 5.71e-11 | 145 |
| GO:0009117 | Colorectum | AD | nucleotide metabolic process | 168/3918 | 489/18723 | 2.20e-12 | 3.36e-10 | 168 |
| GO:0006753 | Colorectum | AD | nucleoside phosphate metabolic process | 169/3918 | 497/18723 | 4.99e-12 | 6.98e-10 | 169 |
| Page: 1 2 3 4 5 6 7 8 9 10 11 12 13 14 15 16 17 18 19 |
| Pathway ID | Tissue | Disease Stage | Description | Gene Ratio | Bg Ratio | pvalue | p.adjust | qvalue | Count |
| hsa006202 | Colorectum | SER | Pyruvate metabolism | 22/1580 | 47/8465 | 9.62e-06 | 1.33e-04 | 9.67e-05 | 22 |
| hsa049222 | Colorectum | SER | Glucagon signaling pathway | 38/1580 | 107/8465 | 2.57e-05 | 3.28e-04 | 2.38e-04 | 38 |
| hsa006402 | Colorectum | SER | Propanoate metabolism | 13/1580 | 32/8465 | 3.20e-03 | 2.12e-02 | 1.54e-02 | 13 |
| hsa006203 | Colorectum | SER | Pyruvate metabolism | 22/1580 | 47/8465 | 9.62e-06 | 1.33e-04 | 9.67e-05 | 22 |
| hsa049223 | Colorectum | SER | Glucagon signaling pathway | 38/1580 | 107/8465 | 2.57e-05 | 3.28e-04 | 2.38e-04 | 38 |
| hsa006403 | Colorectum | SER | Propanoate metabolism | 13/1580 | 32/8465 | 3.20e-03 | 2.12e-02 | 1.54e-02 | 13 |
| hsa041526 | Colorectum | CRC | AMPK signaling pathway | 31/1091 | 121/8465 | 1.04e-04 | 1.57e-03 | 1.07e-03 | 31 |
| hsa049104 | Colorectum | CRC | Insulin signaling pathway | 31/1091 | 137/8465 | 1.07e-03 | 8.91e-03 | 6.03e-03 | 31 |
| hsa006408 | Colorectum | CRC | Propanoate metabolism | 11/1091 | 32/8465 | 1.51e-03 | 1.17e-02 | 7.94e-03 | 11 |
| hsa049228 | Colorectum | CRC | Glucagon signaling pathway | 24/1091 | 107/8465 | 4.21e-03 | 2.47e-02 | 1.67e-02 | 24 |
| hsa01212 | Colorectum | CRC | Fatty acid metabolism | 14/1091 | 57/8465 | 1.17e-02 | 4.99e-02 | 3.38e-02 | 14 |
| hsa041527 | Colorectum | CRC | AMPK signaling pathway | 31/1091 | 121/8465 | 1.04e-04 | 1.57e-03 | 1.07e-03 | 31 |
| hsa049105 | Colorectum | CRC | Insulin signaling pathway | 31/1091 | 137/8465 | 1.07e-03 | 8.91e-03 | 6.03e-03 | 31 |
| hsa006409 | Colorectum | CRC | Propanoate metabolism | 11/1091 | 32/8465 | 1.51e-03 | 1.17e-02 | 7.94e-03 | 11 |
| hsa049229 | Colorectum | CRC | Glucagon signaling pathway | 24/1091 | 107/8465 | 4.21e-03 | 2.47e-02 | 1.67e-02 | 24 |
| hsa012121 | Colorectum | CRC | Fatty acid metabolism | 14/1091 | 57/8465 | 1.17e-02 | 4.99e-02 | 3.38e-02 | 14 |
| hsa0062010 | Esophagus | HGIN | Pyruvate metabolism | 16/1383 | 47/8465 | 2.27e-03 | 1.95e-02 | 1.55e-02 | 16 |
| hsa0062013 | Esophagus | HGIN | Pyruvate metabolism | 16/1383 | 47/8465 | 2.27e-03 | 1.95e-02 | 1.55e-02 | 16 |
| hsa012129 | Esophagus | ESCC | Fatty acid metabolism | 41/4205 | 57/8465 | 5.13e-04 | 1.75e-03 | 8.98e-04 | 41 |
| hsa0121214 | Esophagus | ESCC | Fatty acid metabolism | 41/4205 | 57/8465 | 5.13e-04 | 1.75e-03 | 8.98e-04 | 41 |
| Page: 1 2 3 |
Top |
Cell-cell communication analysis |
| Identification of potential cell-cell interactions between two cell types and their ligand-receptor pairs for different disease states |
| Ligand | Receptor | LRpair | Pathway | Tissue | Disease Stage |
| Page: 1 |
Top |
Single-cell gene regulatory network inference analysis |
| Find out the significant the regulons (TFs) and the target genes of each regulon across cell types for different disease states |
| TF | Cell Type | Tissue | Disease Stage | Target Gene | RSS | Regulon Activity |
| ∗The dot plots of a searched regulon are shown for all cell subpopulations in each disease state of each tissue based on the regulon specific score inferred using pySCENIC and by calculating the average expression. |
| Page: 1 |
Top |
Somatic mutation of malignant transformation related genes |
| Annotation of somatic variants for genes involved in malignant transformation |
| Hugo Symbol | Variant Class | Variant Classification | dbSNP RS | HGVSc | HGVSp | HGVSp Short | SWISSPROT | BIOTYPE | SIFT | PolyPhen | Tumor Sample Barcode | Tissue | Histology | Sex | Age | Stage | Therapy Types | Drugs | Outcome |
| ACACA | SNV | Missense_Mutation | novel | c.6497G>A | p.Arg2166His | p.R2166H | Q13085 | protein_coding | deleterious(0) | probably_damaging(0.927) | TCGA-A2-A0SU-01 | Breast | breast invasive carcinoma | Female | >=65 | I/II | Hormone Therapy | arimidex | SD |
| ACACA | SNV | Missense_Mutation | novel | c.3673N>T | p.His1225Tyr | p.H1225Y | Q13085 | protein_coding | tolerated(0.11) | probably_damaging(0.999) | TCGA-A2-A0YK-01 | Breast | breast invasive carcinoma | Female | <65 | I/II | Chemotherapy | cytoxan | SD |
| ACACA | SNV | Missense_Mutation | novel | c.3937G>C | p.Asp1313His | p.D1313H | Q13085 | protein_coding | deleterious(0.04) | possibly_damaging(0.712) | TCGA-A8-A06U-01 | Breast | breast invasive carcinoma | Female | >=65 | I/II | Unknown | Unknown | SD |
| ACACA | SNV | Missense_Mutation | novel | c.4048N>A | p.Gln1350Lys | p.Q1350K | Q13085 | protein_coding | tolerated(0.29) | possibly_damaging(0.615) | TCGA-AC-A62Y-01 | Breast | breast invasive carcinoma | Female | >=65 | I/II | Unknown | Unknown | SD |
| ACACA | SNV | Missense_Mutation | novel | c.1350N>C | p.Lys450Asn | p.K450N | Q13085 | protein_coding | deleterious(0) | possibly_damaging(0.777) | TCGA-AN-A046-01 | Breast | breast invasive carcinoma | Female | >=65 | I/II | Unknown | Unknown | SD |
| ACACA | SNV | Missense_Mutation | novel | c.449N>A | p.Gly150Glu | p.G150E | Q13085 | protein_coding | tolerated(0.08) | probably_damaging(0.947) | TCGA-AN-A046-01 | Breast | breast invasive carcinoma | Female | >=65 | I/II | Unknown | Unknown | SD |
| ACACA | SNV | Missense_Mutation | novel | c.3859N>C | p.Asp1287His | p.D1287H | Q13085 | protein_coding | deleterious(0.02) | possibly_damaging(0.885) | TCGA-AO-A0J4-01 | Breast | breast invasive carcinoma | Female | <65 | I/II | Chemotherapy | doxorubicin | SD |
| ACACA | SNV | Missense_Mutation | novel | c.6245N>G | p.Asn2082Ser | p.N2082S | Q13085 | protein_coding | deleterious(0) | probably_damaging(0.998) | TCGA-AO-A128-01 | Breast | breast invasive carcinoma | Female | <65 | I/II | Chemotherapy | doxorubicin | SD |
| ACACA | SNV | Missense_Mutation | novel | c.5633T>C | p.Val1878Ala | p.V1878A | Q13085 | protein_coding | deleterious(0.01) | possibly_damaging(0.555) | TCGA-B6-A2IU-01 | Breast | breast invasive carcinoma | Female | <65 | I/II | Unknown | Unknown | PD |
| ACACA | SNV | Missense_Mutation | novel | c.1885N>A | p.Glu629Lys | p.E629K | Q13085 | protein_coding | deleterious(0) | probably_damaging(0.973) | TCGA-C8-A26Y-01 | Breast | breast invasive carcinoma | Female | >=65 | I/II | Unknown | Unknown | SD |
| Page: 1 2 3 4 5 6 7 8 9 10 11 12 13 14 15 16 17 18 19 20 21 22 23 24 25 |
Top |
Related drugs of malignant transformation related genes |
| Identification of chemicals and drugs interact with genes involved in malignant transfromation |
| (DGIdb 4.0) |
| Entrez ID | Symbol | Category | Interaction Types | Drug Claim Name | Drug Name | PMIDs |
| 31 | ACACA | ENZYME, DRUGGABLE GENOME | inhibitor | 252827541 | ||
| 31 | ACACA | ENZYME, DRUGGABLE GENOME | allosteric modulator | 404859092 | FIRSOCOSTAT | |
| 31 | ACACA | ENZYME, DRUGGABLE GENOME | inhibitor | 178101963 |
| Page: 1 |

Copyright 2023-Present -The University of Texas Health Science Center at Houston |