
|
|||||
|
 | |
| |
| |
| |
| |
| |
|
Gene: ABTB2 |
Gene summary for ABTB2 |
| Gene information | Species | Human | Gene symbol | ABTB2 | Gene ID | 25841 |
| Gene name | ankyrin repeat and BTB domain containing 2 | |
| Gene Alias | ABTB2A | |
| Cytomap | 11p13 | |
| Gene Type | protein-coding | GO ID | GO:0008150 | UniProtAcc | Q8N961 |
Top |
Malignant transformation analysis |
| Identification of the aberrant gene expression in precancerous and cancerous lesions by comparing the gene expression of stem-like cells in diseased tissues with normal stem cells |
| Entrez ID | Symbol | Replicates | Species | Organ | Tissue | Adj P-value | Log2FC | Malignancy |
| 25841 | ABTB2 | AEH-subject1 | Human | Endometrium | AEH | 6.00e-06 | 3.02e-01 | -0.3059 |
| 25841 | ABTB2 | EEC-subject1 | Human | Endometrium | EEC | 5.98e-13 | 4.03e-01 | -0.2682 |
| 25841 | ABTB2 | EEC-subject3 | Human | Endometrium | EEC | 3.22e-06 | 4.18e-01 | -0.2525 |
| 25841 | ABTB2 | EEC-subject4 | Human | Endometrium | EEC | 5.06e-03 | 2.56e-01 | -0.2571 |
| 25841 | ABTB2 | GSM5276934 | Human | Endometrium | EEC | 2.53e-03 | 2.40e-01 | -0.0913 |
| 25841 | ABTB2 | NAFLD1 | Human | Liver | NAFLD | 1.66e-12 | 1.11e+00 | -0.04 |
| 25841 | ABTB2 | S41 | Human | Liver | Cirrhotic | 5.61e-06 | 6.51e-01 | -0.0343 |
| 25841 | ABTB2 | S43 | Human | Liver | Cirrhotic | 5.38e-03 | -1.41e-01 | -0.0187 |
| 25841 | ABTB2 | HCC1_Meng | Human | Liver | HCC | 1.13e-11 | -1.73e-01 | 0.0246 |
| 25841 | ABTB2 | HCC2_Meng | Human | Liver | HCC | 3.27e-05 | -1.53e-01 | 0.0107 |
| 25841 | ABTB2 | cirrhotic1 | Human | Liver | Cirrhotic | 2.92e-05 | -1.86e-01 | 0.0202 |
| 25841 | ABTB2 | cirrhotic2 | Human | Liver | Cirrhotic | 2.74e-03 | -1.65e-01 | 0.0201 |
| 25841 | ABTB2 | Pt13.a | Human | Liver | HCC | 7.34e-04 | -1.79e-01 | 0.021 |
| 25841 | ABTB2 | Pt14.d | Human | Liver | HCC | 3.44e-04 | -1.85e-01 | 0.0143 |
| 25841 | ABTB2 | TD9 | Human | Lung | IAC | 4.66e-04 | 8.62e-01 | 0.088 |
| 25841 | ABTB2 | RNA-P17T-P17T-6 | Human | Lung | IAC | 3.12e-03 | 6.45e-01 | 0.3385 |
| 25841 | ABTB2 | RNA-P17T-P17T-8 | Human | Lung | IAC | 1.27e-02 | 5.51e-01 | 0.3329 |
| 25841 | ABTB2 | RNA-P25T1-P25T1-1 | Human | Lung | AIS | 3.94e-02 | 3.01e-01 | -0.2116 |
| 25841 | ABTB2 | 047563_1562-all-cells | Human | Prostate | BPH | 4.19e-17 | 5.80e-01 | 0.0791 |
| 25841 | ABTB2 | 048752_1579-all-cells | Human | Prostate | BPH | 2.83e-28 | 5.94e-01 | 0.1008 |
| Page: 1 2 |
| Tissue | Expression Dynamics | Abbreviation |
| Endometrium |  | AEH: Atypical endometrial hyperplasia |
| EEC: Endometrioid Cancer | ||
| GC | 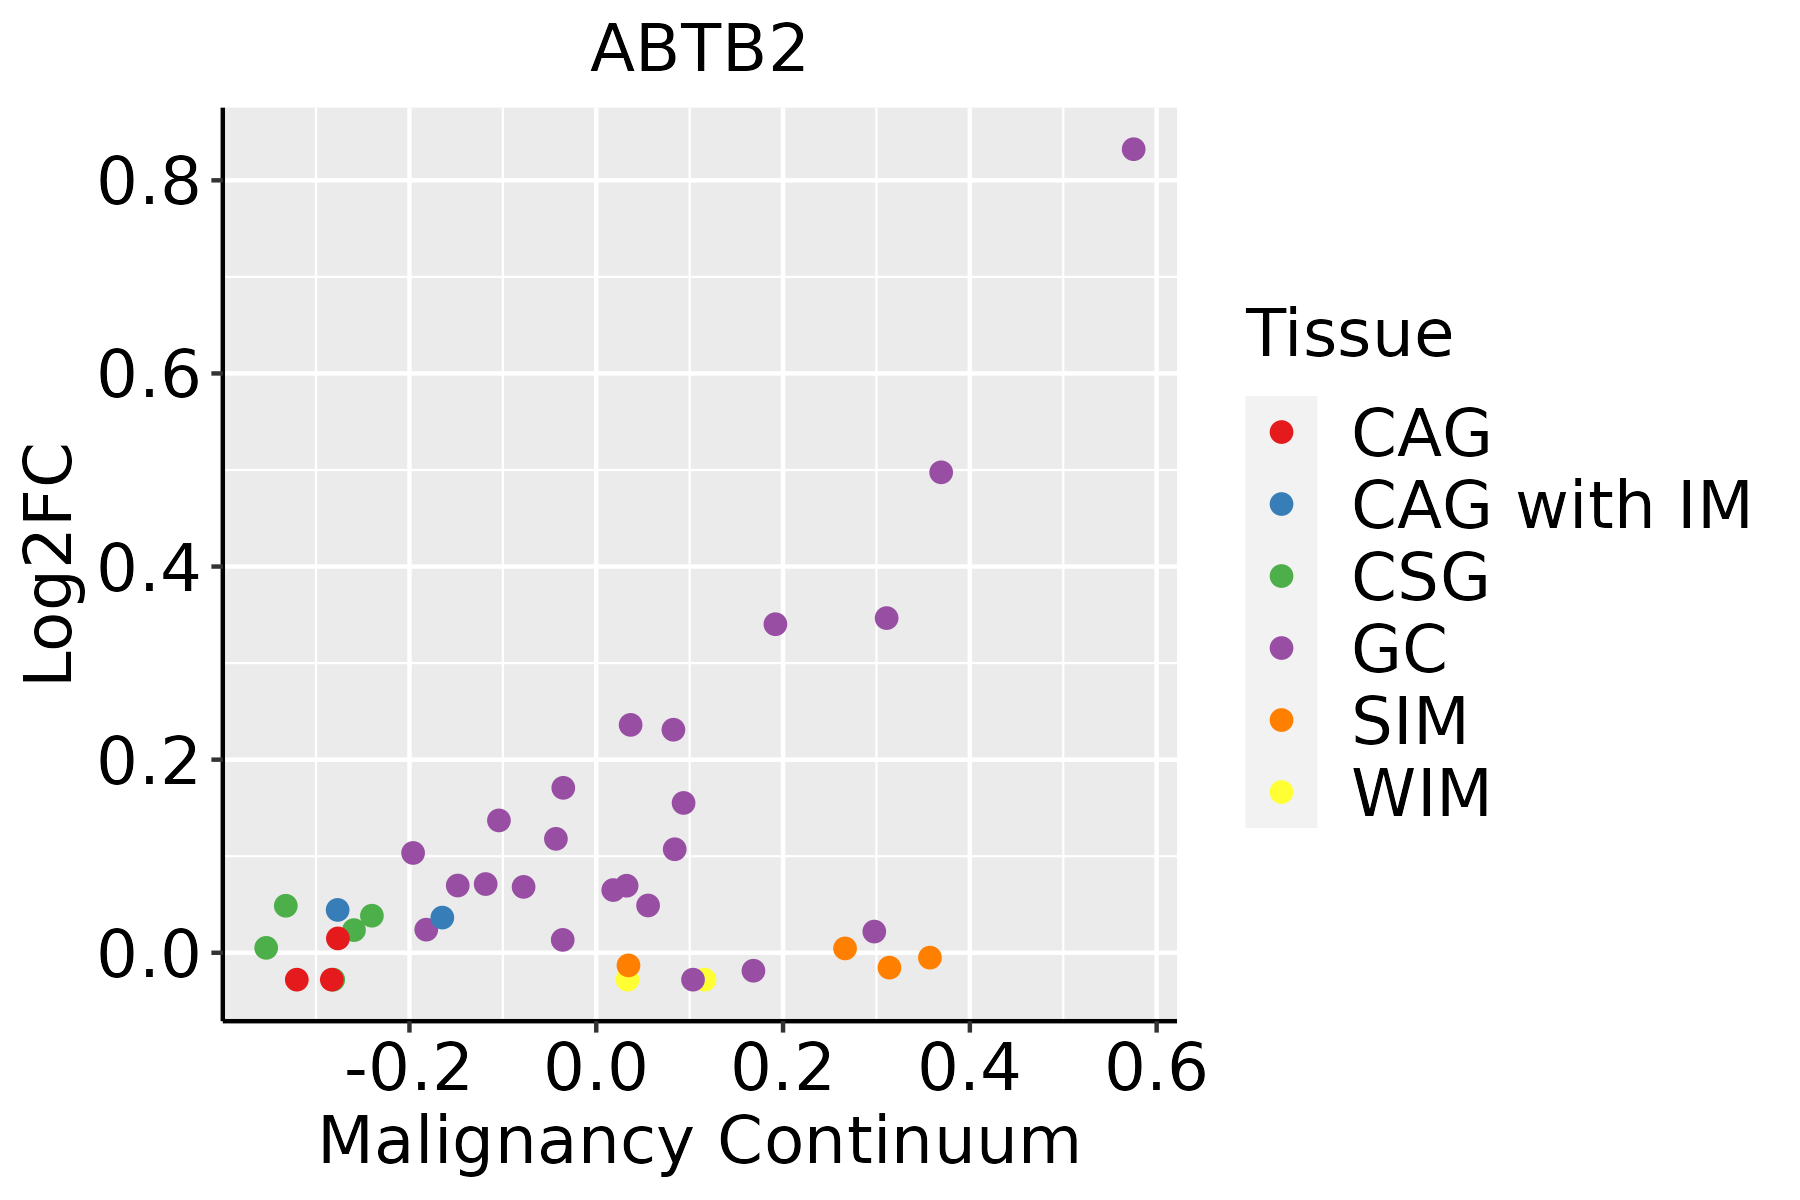 | CAG: Chronic atrophic gastritis |
| CAG with IM: Chronic atrophic gastritis with intestinal metaplasia | ||
| CSG: Chronic superficial gastritis | ||
| GC: Gastric cancer | ||
| SIM: Severe intestinal metaplasia | ||
| WIM: Wild intestinal metaplasia | ||
| Liver |  | HCC: Hepatocellular carcinoma |
| NAFLD: Non-alcoholic fatty liver disease | ||
| Lung | 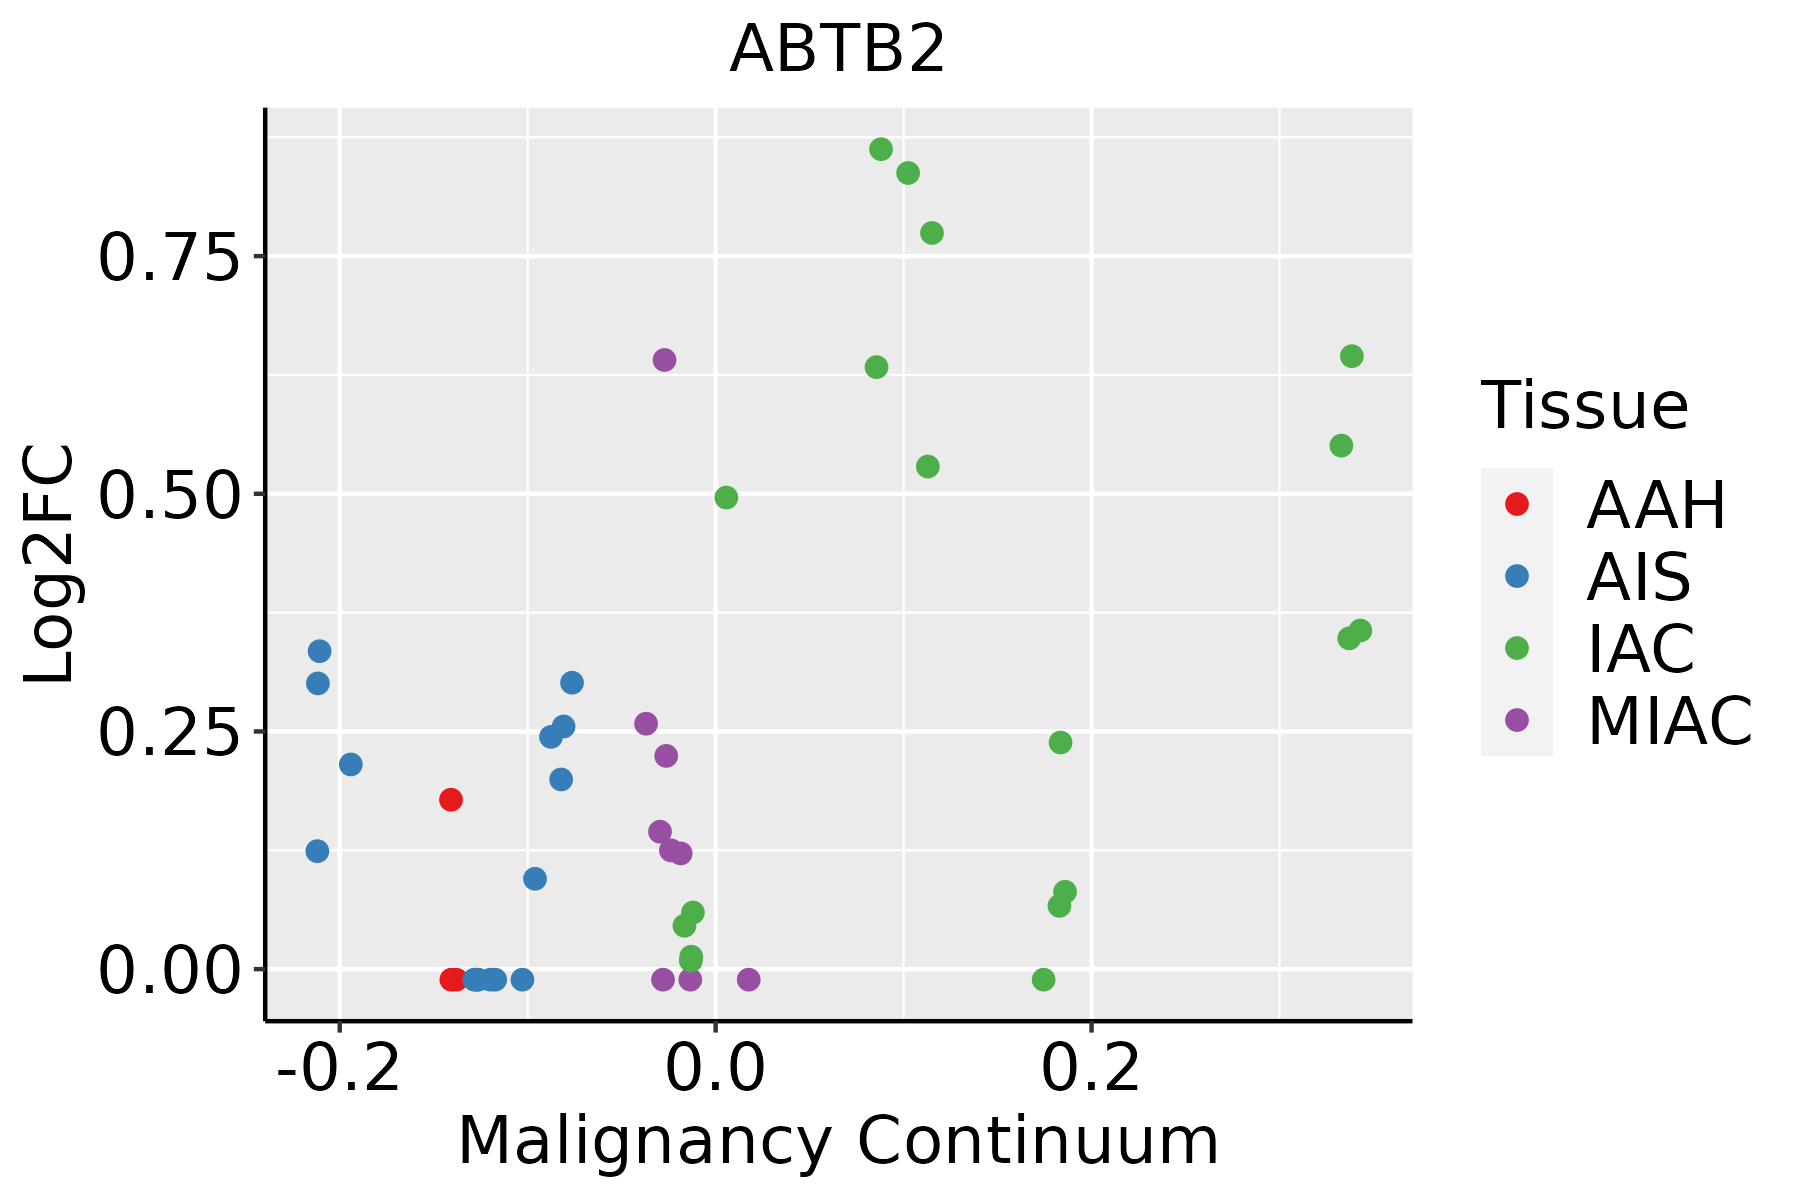 | AAH: Atypical adenomatous hyperplasia |
| AIS: Adenocarcinoma in situ | ||
| IAC: Invasive lung adenocarcinoma | ||
| MIA: Minimally invasive adenocarcinoma | ||
| Prostate | 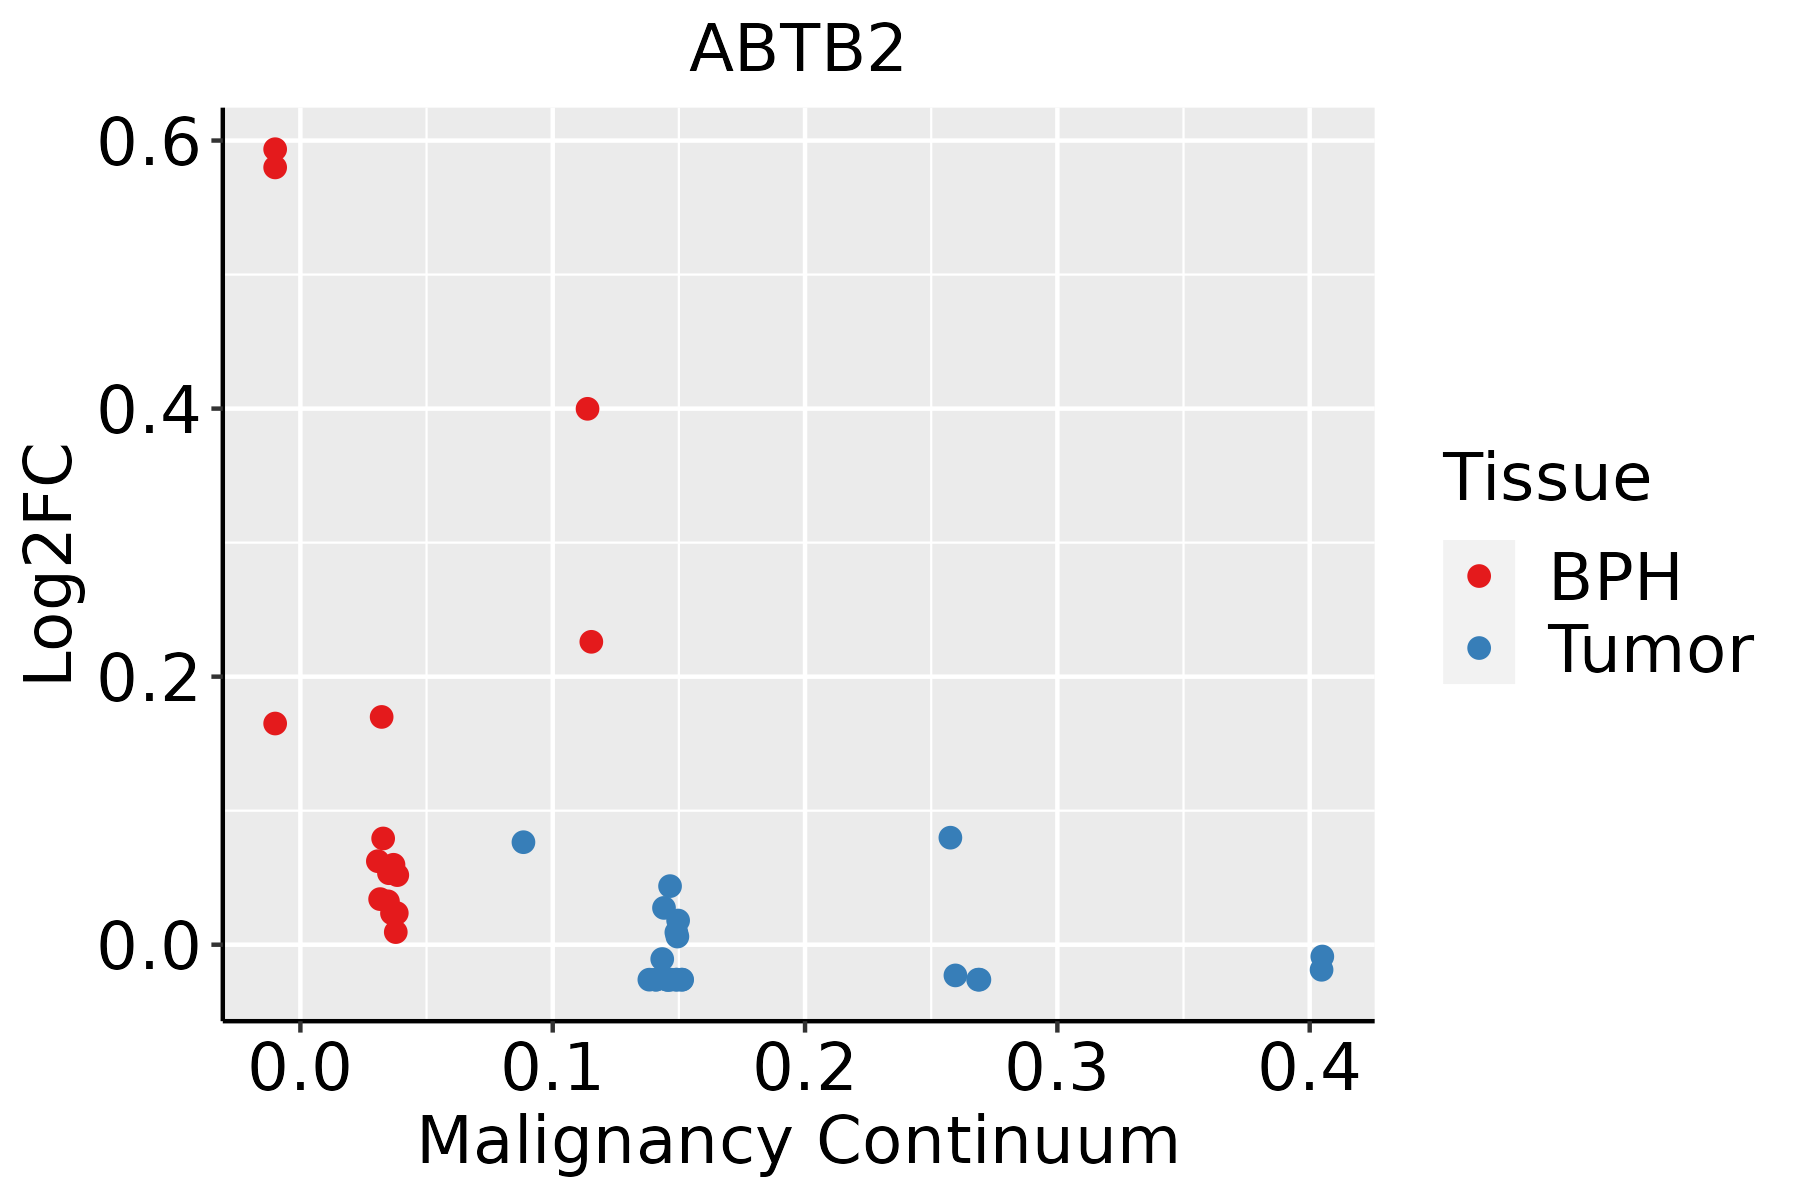 | BPH: Benign Prostatic Hyperplasia |
| Skin |  | AK: Actinic keratosis |
| cSCC: Cutaneous squamous cell carcinoma | ||
| SCCIS:squamous cell carcinoma in situ |
| ∗log2FC in expression of this searched gene in stem-like cells from each diseased tissue sample relative to stem-like cells in normal samples in each tissue plotted against the malignancy continuum. Samples are colored based on if they are from different disease stage. |
Top |
Malignant transformation related pathway analysis |
| Find out the enriched GO biological processes and KEGG pathways involved in transition from healthy to precancer to cancer |
| Tissue | Disease Stage | Enriched GO biological Processes |
| Colorectum | AD |  |
| Colorectum | SER |  |
| Colorectum | MSS |  |
| Colorectum | MSI-H |  |
| Colorectum | FAP |  |
| ∗Top 15 enriched GO BP terms are showed in the bar plot of each disease state in each tissue. Each row represents a significant GO biological process which is colored according to the -log10(p.adjust). |
| Page: 1 2 3 4 5 6 7 8 9 |
| GO ID | Tissue | Disease Stage | Description | Gene Ratio | Bg Ratio | pvalue | p.adjust | Count |
| GO:009723710 | Endometrium | AEH | cellular response to toxic substance | 34/2100 | 124/18723 | 5.02e-07 | 1.97e-05 | 34 |
| GO:000963610 | Endometrium | AEH | response to toxic substance | 52/2100 | 262/18723 | 2.89e-05 | 5.40e-04 | 52 |
| GO:009723715 | Endometrium | EEC | cellular response to toxic substance | 35/2168 | 124/18723 | 3.44e-07 | 1.37e-05 | 35 |
| GO:000963615 | Endometrium | EEC | response to toxic substance | 54/2168 | 262/18723 | 1.65e-05 | 3.18e-04 | 54 |
| GO:00096367 | Liver | NAFLD | response to toxic substance | 41/1882 | 262/18723 | 2.83e-03 | 2.57e-02 | 41 |
| GO:000963612 | Liver | Cirrhotic | response to toxic substance | 104/4634 | 262/18723 | 5.63e-08 | 1.74e-06 | 104 |
| GO:00972377 | Liver | Cirrhotic | cellular response to toxic substance | 50/4634 | 124/18723 | 9.20e-05 | 9.79e-04 | 50 |
| GO:000963622 | Liver | HCC | response to toxic substance | 153/7958 | 262/18723 | 1.37e-07 | 2.58e-06 | 153 |
| GO:009723712 | Liver | HCC | cellular response to toxic substance | 74/7958 | 124/18723 | 8.36e-05 | 7.36e-04 | 74 |
| GO:000963616 | Prostate | BPH | response to toxic substance | 67/3107 | 262/18723 | 1.32e-04 | 1.18e-03 | 67 |
| GO:009723716 | Prostate | BPH | cellular response to toxic substance | 37/3107 | 124/18723 | 1.70e-04 | 1.46e-03 | 37 |
| GO:000963626 | Skin | AK | response to toxic substance | 42/1910 | 262/18723 | 2.11e-03 | 1.40e-02 | 42 |
| GO:009723726 | Skin | AK | cellular response to toxic substance | 22/1910 | 124/18723 | 6.97e-03 | 3.63e-02 | 22 |
| GO:0097237111 | Skin | cSCC | cellular response to toxic substance | 45/4864 | 124/18723 | 7.08e-03 | 3.40e-02 | 45 |
| GO:0009636110 | Skin | cSCC | response to toxic substance | 86/4864 | 262/18723 | 7.66e-03 | 3.57e-02 | 86 |
| GO:00096366 | Stomach | GC | response to toxic substance | 50/1159 | 262/18723 | 7.42e-13 | 2.69e-10 | 50 |
| GO:00972376 | Stomach | GC | cellular response to toxic substance | 31/1159 | 124/18723 | 1.40e-11 | 3.31e-09 | 31 |
| Page: 1 |
| Pathway ID | Tissue | Disease Stage | Description | Gene Ratio | Bg Ratio | pvalue | p.adjust | qvalue | Count |
| Page: 1 |
Top |
Cell-cell communication analysis |
| Identification of potential cell-cell interactions between two cell types and their ligand-receptor pairs for different disease states |
| Ligand | Receptor | LRpair | Pathway | Tissue | Disease Stage |
| Page: 1 |
Top |
Single-cell gene regulatory network inference analysis |
| Find out the significant the regulons (TFs) and the target genes of each regulon across cell types for different disease states |
| TF | Cell Type | Tissue | Disease Stage | Target Gene | RSS | Regulon Activity |
| ∗The dot plots of a searched regulon are shown for all cell subpopulations in each disease state of each tissue based on the regulon specific score inferred using pySCENIC and by calculating the average expression. |
| Page: 1 |
Top |
Somatic mutation of malignant transformation related genes |
| Annotation of somatic variants for genes involved in malignant transformation |
| Hugo Symbol | Variant Class | Variant Classification | dbSNP RS | HGVSc | HGVSp | HGVSp Short | SWISSPROT | BIOTYPE | SIFT | PolyPhen | Tumor Sample Barcode | Tissue | Histology | Sex | Age | Stage | Therapy Types | Drugs | Outcome |
| ABTB2 | SNV | Missense_Mutation | novel | c.302N>C | p.Glu101Ala | p.E101A | Q8N961 | protein_coding | tolerated(0.45) | benign(0.035) | TCGA-5L-AAT1-01 | Breast | breast invasive carcinoma | Female | <65 | III/IV | Hormone Therapy | letrozol | SD |
| ABTB2 | SNV | Missense_Mutation | rs756849874 | c.2377G>A | p.Asp793Asn | p.D793N | Q8N961 | protein_coding | tolerated(1) | benign(0.003) | TCGA-A8-A06Q-01 | Breast | breast invasive carcinoma | Female | <65 | III/IV | Unknown | Unknown | SD |
| ABTB2 | SNV | Missense_Mutation | novel | c.820N>A | p.Asp274Asn | p.D274N | Q8N961 | protein_coding | tolerated(0.25) | probably_damaging(0.976) | TCGA-AN-A046-01 | Breast | breast invasive carcinoma | Female | >=65 | I/II | Unknown | Unknown | SD |
| ABTB2 | SNV | Missense_Mutation | rs776143668 | c.3043N>T | p.Arg1015Cys | p.R1015C | Q8N961 | protein_coding | deleterious(0) | probably_damaging(0.999) | TCGA-BH-A18G-01 | Breast | breast invasive carcinoma | Female | >=65 | I/II | Unknown | Unknown | SD |
| ABTB2 | SNV | Missense_Mutation | rs764914019 | c.3019N>A | p.Asp1007Asn | p.D1007N | Q8N961 | protein_coding | tolerated(0.07) | possibly_damaging(0.529) | TCGA-E9-A1RA-01 | Breast | breast invasive carcinoma | Female | <65 | I/II | Hormone Therapy | tamoxiphen | SD |
| ABTB2 | deletion | Frame_Shift_Del | novel | c.1951delN | p.Met651Ter | p.M651* | Q8N961 | protein_coding | TCGA-D8-A27V-01 | Breast | breast invasive carcinoma | Female | <65 | I/II | Hormone Therapy | tamoxiphen | SD | ||
| ABTB2 | deletion | Frame_Shift_Del | novel | c.2532delG | p.Met844IlefsTer4 | p.M844Ifs*4 | Q8N961 | protein_coding | TCGA-EW-A2FV-01 | Breast | breast invasive carcinoma | Female | <65 | III/IV | Chemotherapy | docetaxel | SD | ||
| ABTB2 | SNV | Missense_Mutation | novel | c.218C>A | p.Thr73Lys | p.T73K | Q8N961 | protein_coding | deleterious(0) | probably_damaging(0.964) | TCGA-C5-A8XI-01 | Cervix | cervical & endocervical cancer | Female | >=65 | I/II | Chemotherapy | cisplatin | SD |
| ABTB2 | SNV | Missense_Mutation | c.1603N>A | p.Glu535Lys | p.E535K | Q8N961 | protein_coding | deleterious(0.01) | probably_damaging(0.985) | TCGA-EK-A2RO-01 | Cervix | cervical & endocervical cancer | Female | <65 | I/II | Unknown | Unknown | SD | |
| ABTB2 | SNV | Missense_Mutation | c.813N>G | p.Ile271Met | p.I271M | Q8N961 | protein_coding | deleterious(0) | possibly_damaging(0.757) | TCGA-Q1-A73O-01 | Cervix | cervical & endocervical cancer | Female | <65 | I/II | Chemotherapy | cisplatin | CR |
| Page: 1 2 3 4 5 6 7 |
Top |
Related drugs of malignant transformation related genes |
| Identification of chemicals and drugs interact with genes involved in malignant transfromation |
| (DGIdb 4.0) |
| Entrez ID | Symbol | Category | Interaction Types | Drug Claim Name | Drug Name | PMIDs |
| Page: 1 |

Copyright 2023-Present -The University of Texas Health Science Center at Houston |