
|
|||||
|
 | |
| |
| |
| |
| |
| |
|
Gene: ABTB1 |
Gene summary for ABTB1 |
| Gene information | Species | Human | Gene symbol | ABTB1 | Gene ID | 80325 |
| Gene name | ankyrin repeat and BTB domain containing 1 | |
| Gene Alias | BPOZ | |
| Cytomap | 3q21.3 | |
| Gene Type | protein-coding | GO ID | GO:0006412 | UniProtAcc | Q969K4 |
Top |
Malignant transformation analysis |
| Identification of the aberrant gene expression in precancerous and cancerous lesions by comparing the gene expression of stem-like cells in diseased tissues with normal stem cells |
| Entrez ID | Symbol | Replicates | Species | Organ | Tissue | Adj P-value | Log2FC | Malignancy |
| 80325 | ABTB1 | LZE4T | Human | Esophagus | ESCC | 1.06e-06 | 2.15e-01 | 0.0811 |
| 80325 | ABTB1 | LZE7T | Human | Esophagus | ESCC | 2.49e-11 | 4.51e-01 | 0.0667 |
| 80325 | ABTB1 | LZE8T | Human | Esophagus | ESCC | 6.49e-04 | 1.23e-01 | 0.067 |
| 80325 | ABTB1 | LZE22D1 | Human | Esophagus | HGIN | 3.40e-04 | 1.64e-01 | 0.0595 |
| 80325 | ABTB1 | LZE22T | Human | Esophagus | ESCC | 6.46e-06 | 3.07e-01 | 0.068 |
| 80325 | ABTB1 | LZE24T | Human | Esophagus | ESCC | 2.28e-23 | 4.95e-01 | 0.0596 |
| 80325 | ABTB1 | LZE6T | Human | Esophagus | ESCC | 2.43e-08 | 3.13e-01 | 0.0845 |
| 80325 | ABTB1 | P1T-E | Human | Esophagus | ESCC | 1.00e-06 | 3.92e-01 | 0.0875 |
| 80325 | ABTB1 | P2T-E | Human | Esophagus | ESCC | 1.74e-32 | 6.57e-01 | 0.1177 |
| 80325 | ABTB1 | P4T-E | Human | Esophagus | ESCC | 1.94e-07 | 1.60e-01 | 0.1323 |
| 80325 | ABTB1 | P5T-E | Human | Esophagus | ESCC | 4.63e-08 | 9.39e-02 | 0.1327 |
| 80325 | ABTB1 | P8T-E | Human | Esophagus | ESCC | 1.74e-13 | 3.75e-01 | 0.0889 |
| 80325 | ABTB1 | P9T-E | Human | Esophagus | ESCC | 1.04e-11 | 2.47e-01 | 0.1131 |
| 80325 | ABTB1 | P10T-E | Human | Esophagus | ESCC | 6.29e-18 | 3.60e-01 | 0.116 |
| 80325 | ABTB1 | P11T-E | Human | Esophagus | ESCC | 1.92e-10 | 3.85e-01 | 0.1426 |
| 80325 | ABTB1 | P12T-E | Human | Esophagus | ESCC | 1.77e-18 | 3.80e-01 | 0.1122 |
| 80325 | ABTB1 | P15T-E | Human | Esophagus | ESCC | 2.48e-20 | 4.16e-01 | 0.1149 |
| 80325 | ABTB1 | P16T-E | Human | Esophagus | ESCC | 6.79e-47 | 9.00e-01 | 0.1153 |
| 80325 | ABTB1 | P17T-E | Human | Esophagus | ESCC | 2.41e-05 | 1.51e-01 | 0.1278 |
| 80325 | ABTB1 | P19T-E | Human | Esophagus | ESCC | 9.93e-08 | 3.20e-01 | 0.1662 |
| Page: 1 2 3 4 5 |
| Tissue | Expression Dynamics | Abbreviation |
| Esophagus | 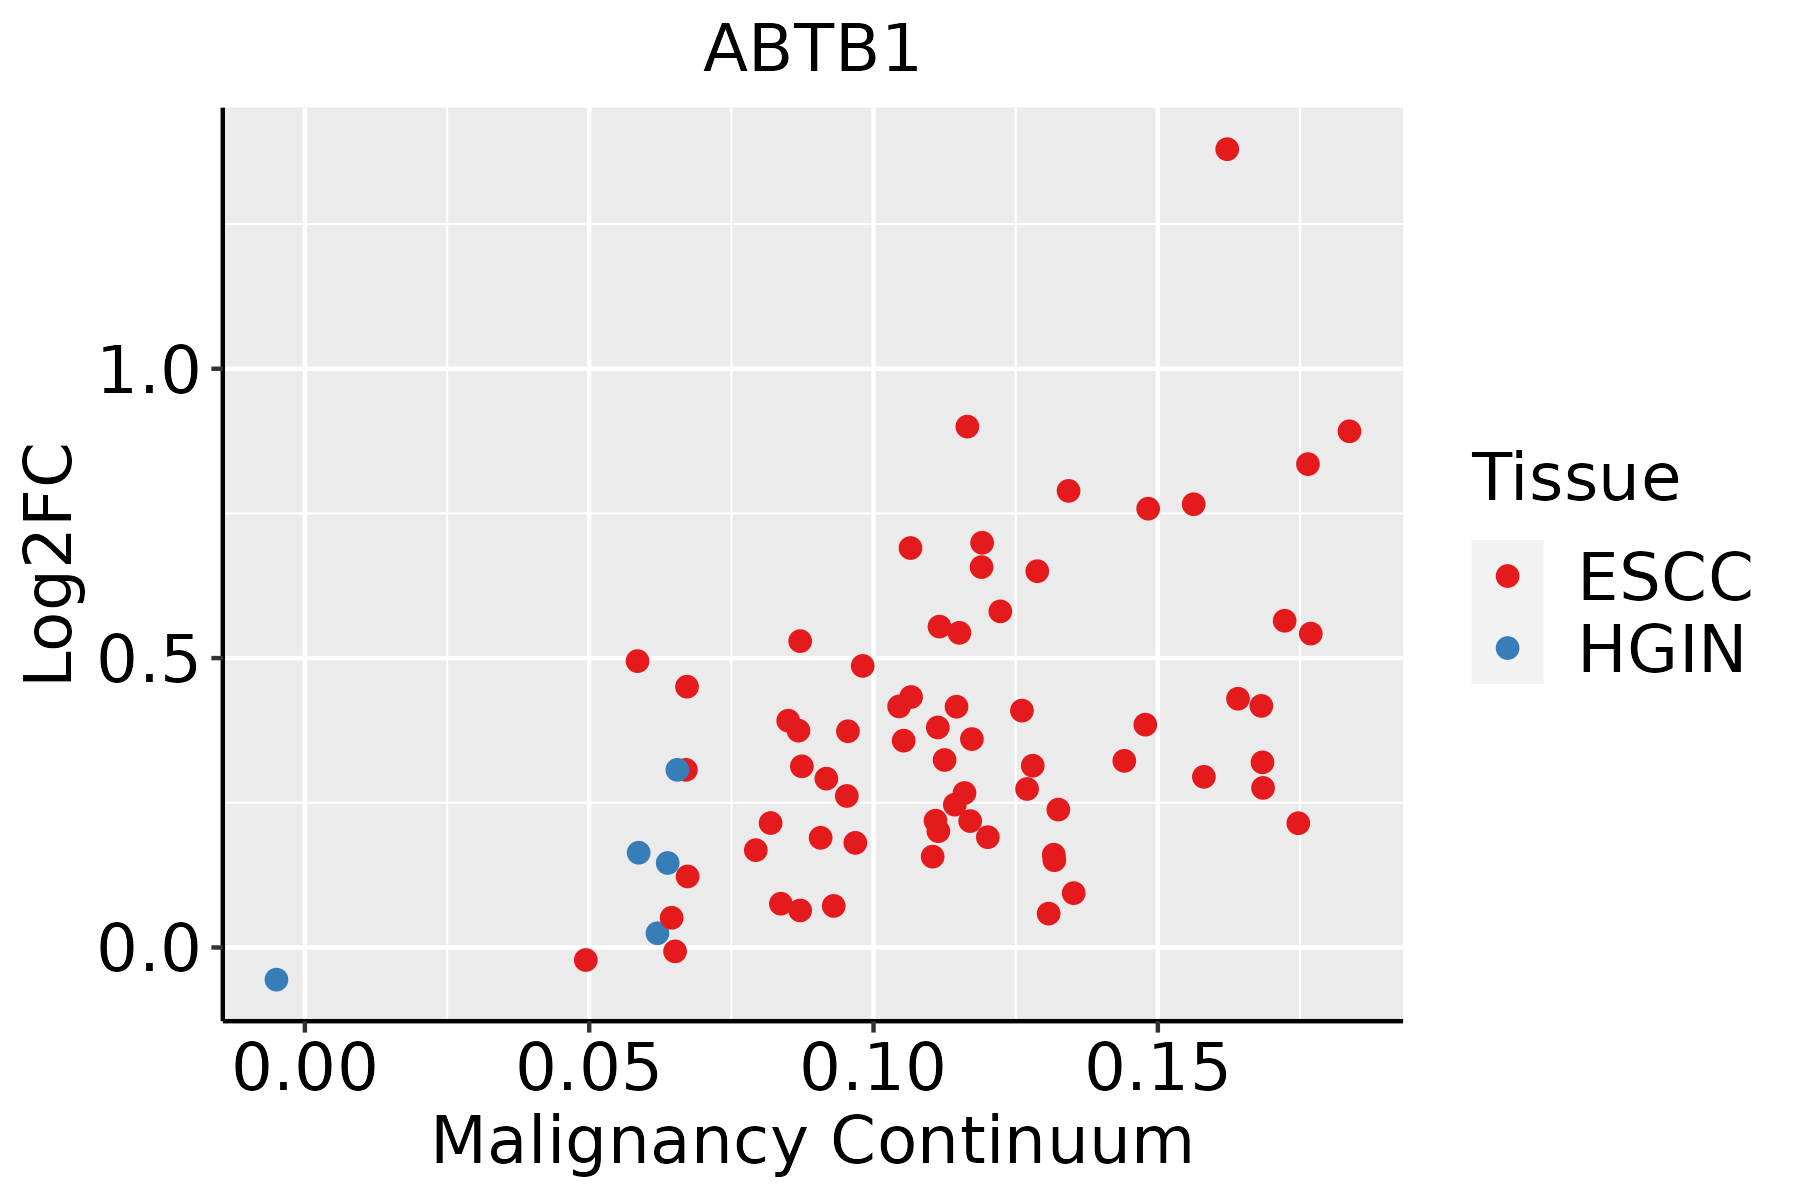 | ESCC: Esophageal squamous cell carcinoma |
| HGIN: High-grade intraepithelial neoplasias | ||
| LGIN: Low-grade intraepithelial neoplasias | ||
| Oral Cavity | 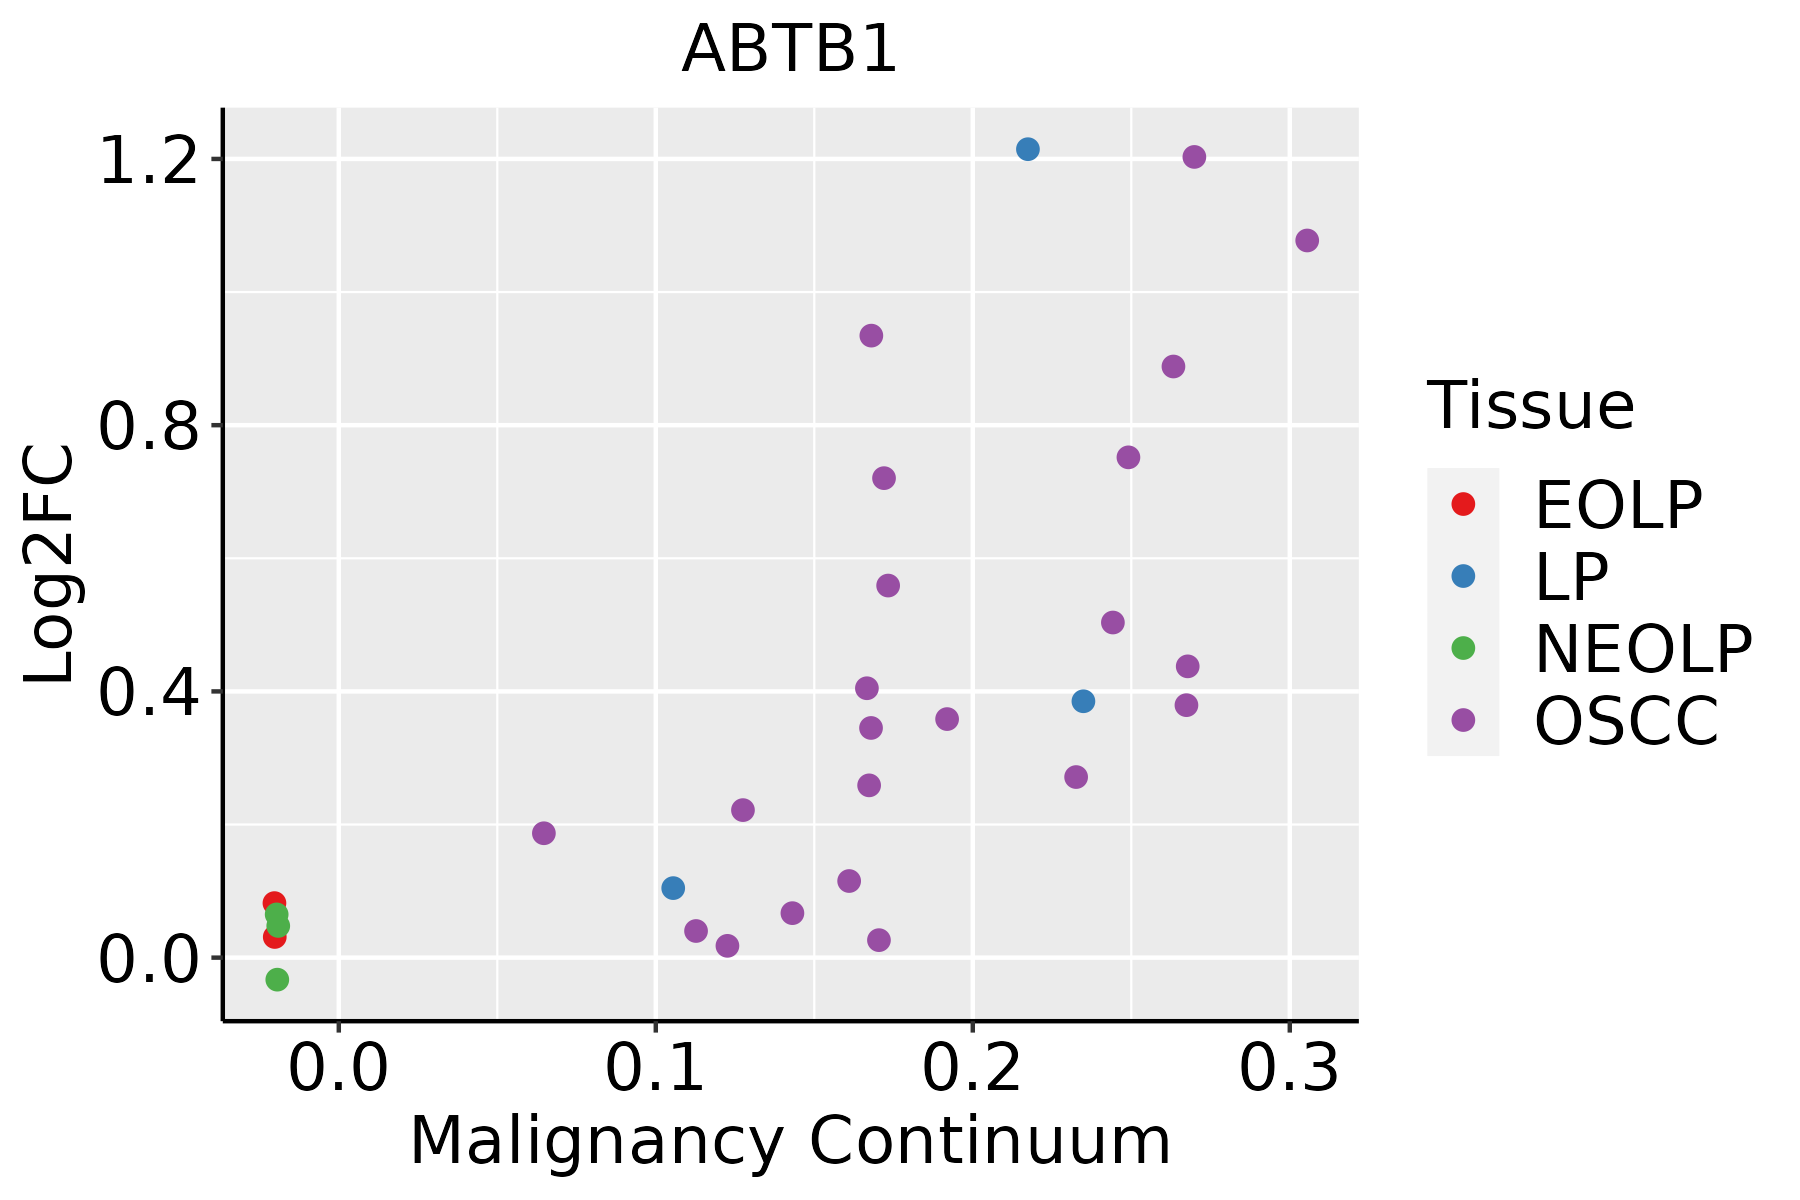 | EOLP: Erosive Oral lichen planus |
| LP: leukoplakia | ||
| NEOLP: Non-erosive oral lichen planus | ||
| OSCC: Oral squamous cell carcinoma |
| ∗log2FC in expression of this searched gene in stem-like cells from each diseased tissue sample relative to stem-like cells in normal samples in each tissue plotted against the malignancy continuum. Samples are colored based on if they are from different disease stage. |
Top |
Malignant transformation related pathway analysis |
| Find out the enriched GO biological processes and KEGG pathways involved in transition from healthy to precancer to cancer |
| Tissue | Disease Stage | Enriched GO biological Processes |
| Colorectum | AD |  |
| Colorectum | SER |  |
| Colorectum | MSS |  |
| Colorectum | MSI-H |  |
| Colorectum | FAP |  |
| ∗Top 15 enriched GO BP terms are showed in the bar plot of each disease state in each tissue. Each row represents a significant GO biological process which is colored according to the -log10(p.adjust). |
| Page: 1 2 3 4 5 6 7 8 9 |
| GO ID | Tissue | Disease Stage | Description | Gene Ratio | Bg Ratio | pvalue | p.adjust | Count |
| GO:000641418 | Esophagus | HGIN | translational elongation | 22/2587 | 55/18723 | 1.46e-06 | 5.56e-05 | 22 |
| GO:000641419 | Esophagus | ESCC | translational elongation | 41/8552 | 55/18723 | 1.26e-05 | 1.16e-04 | 41 |
| GO:000641416 | Oral cavity | OSCC | translational elongation | 37/7305 | 55/18723 | 2.03e-05 | 1.94e-04 | 37 |
| GO:000641417 | Oral cavity | LP | translational elongation | 25/4623 | 55/18723 | 6.27e-04 | 5.71e-03 | 25 |
| Page: 1 |
| Pathway ID | Tissue | Disease Stage | Description | Gene Ratio | Bg Ratio | pvalue | p.adjust | qvalue | Count |
| Page: 1 |
Top |
Cell-cell communication analysis |
| Identification of potential cell-cell interactions between two cell types and their ligand-receptor pairs for different disease states |
| Ligand | Receptor | LRpair | Pathway | Tissue | Disease Stage |
| Page: 1 |
Top |
Single-cell gene regulatory network inference analysis |
| Find out the significant the regulons (TFs) and the target genes of each regulon across cell types for different disease states |
| TF | Cell Type | Tissue | Disease Stage | Target Gene | RSS | Regulon Activity |
| ∗The dot plots of a searched regulon are shown for all cell subpopulations in each disease state of each tissue based on the regulon specific score inferred using pySCENIC and by calculating the average expression. |
| Page: 1 |
Top |
Somatic mutation of malignant transformation related genes |
| Annotation of somatic variants for genes involved in malignant transformation |
| Hugo Symbol | Variant Class | Variant Classification | dbSNP RS | HGVSc | HGVSp | HGVSp Short | SWISSPROT | BIOTYPE | SIFT | PolyPhen | Tumor Sample Barcode | Tissue | Histology | Sex | Age | Stage | Therapy Types | Drugs | Outcome |
| ABTB1 | insertion | In_Frame_Ins | novel | c.277_278insAAGGGATGTTTT | p.Ala93delinsGluGlyMetPheSer | p.A93delinsEGMFS | Q969K4 | protein_coding | TCGA-A2-A0EO-01 | Breast | breast invasive carcinoma | Female | <65 | I/II | Hormone Therapy | tamoxiphen | SD | ||
| ABTB1 | insertion | In_Frame_Ins | novel | c.278_279insTCTCCG | p.Ala93_Ser94insLeuArg | p.A93_S94insLR | Q969K4 | protein_coding | TCGA-A2-A0EO-01 | Breast | breast invasive carcinoma | Female | <65 | I/II | Hormone Therapy | tamoxiphen | SD | ||
| ABTB1 | deletion | In_Frame_Del | novel | c.1145_1177delNNNNNNNNNNNNNNNNNNNNNNNNNNNNNNNNN | p.Gly383_Leu393del | p.G383_L393del | Q969K4 | protein_coding | TCGA-GM-A3XL-01 | Breast | breast invasive carcinoma | Female | <65 | I/II | Chemotherapy | fluorouracil | CR | ||
| ABTB1 | SNV | Missense_Mutation | c.346N>A | p.Asp116Asn | p.D116N | Q969K4 | protein_coding | deleterious(0) | probably_damaging(0.998) | TCGA-DS-A1OC-01 | Cervix | cervical & endocervical cancer | Female | <65 | I/II | Chemotherapy | gemcitabine | SD | |
| ABTB1 | SNV | Missense_Mutation | rs141326451 | c.941N>T | p.Ser314Leu | p.S314L | Q969K4 | protein_coding | tolerated(0.2) | benign(0.001) | TCGA-JX-A3Q0-01 | Cervix | cervical & endocervical cancer | Female | <65 | III/IV | Unknown | Unknown | SD |
| ABTB1 | SNV | Missense_Mutation | rs755880704 | c.1132G>A | p.Glu378Lys | p.E378K | Q969K4 | protein_coding | tolerated(0.17) | benign(0.022) | TCGA-A6-5660-01 | Colorectum | colon adenocarcinoma | Male | >=65 | III/IV | Ancillary | leucovorin | SD |
| ABTB1 | SNV | Missense_Mutation | novel | c.806A>T | p.Asn269Ile | p.N269I | Q969K4 | protein_coding | tolerated(0.19) | benign(0.009) | TCGA-AA-A010-01 | Colorectum | colon adenocarcinoma | Female | <65 | I/II | Chemotherapy | folinic | CR |
| ABTB1 | SNV | Missense_Mutation | c.346N>A | p.Asp116Asn | p.D116N | Q969K4 | protein_coding | deleterious(0) | probably_damaging(0.998) | TCGA-AD-6895-01 | Colorectum | colon adenocarcinoma | Male | >=65 | III/IV | Unknown | Unknown | SD | |
| ABTB1 | SNV | Missense_Mutation | c.781N>T | p.Pro261Ser | p.P261S | Q969K4 | protein_coding | tolerated(0.08) | probably_damaging(0.936) | TCGA-AD-6964-01 | Colorectum | colon adenocarcinoma | Male | <65 | III/IV | Chemotherapy | folfox | PD | |
| ABTB1 | SNV | Missense_Mutation | c.367N>T | p.Gly123Trp | p.G123W | Q969K4 | protein_coding | deleterious(0) | probably_damaging(0.999) | TCGA-AU-6004-01 | Colorectum | colon adenocarcinoma | Female | >=65 | I/II | Unknown | Unknown | SD |
| Page: 1 2 3 4 5 6 |
Top |
Related drugs of malignant transformation related genes |
| Identification of chemicals and drugs interact with genes involved in malignant transfromation |
| (DGIdb 4.0) |
| Entrez ID | Symbol | Category | Interaction Types | Drug Claim Name | Drug Name | PMIDs |
| Page: 1 |

Copyright 2023-Present -The University of Texas Health Science Center at Houston |