
|
|||||
|
 | |
| |
| |
| |
| |
| |
|
Gene: ABT1 |
Gene summary for ABT1 |
| Gene information | Species | Human | Gene symbol | ABT1 | Gene ID | 29777 |
| Gene name | activator of basal transcription 1 | |
| Gene Alias | Esf2 | |
| Cytomap | 6p22.2 | |
| Gene Type | protein-coding | GO ID | GO:0000028 | UniProtAcc | A0A024R029 |
Top |
Malignant transformation analysis |
| Identification of the aberrant gene expression in precancerous and cancerous lesions by comparing the gene expression of stem-like cells in diseased tissues with normal stem cells |
| Entrez ID | Symbol | Replicates | Species | Organ | Tissue | Adj P-value | Log2FC | Malignancy |
| 29777 | ABT1 | LZE2T | Human | Esophagus | ESCC | 6.45e-03 | 2.67e-01 | 0.082 |
| 29777 | ABT1 | LZE4T | Human | Esophagus | ESCC | 3.75e-10 | 2.92e-01 | 0.0811 |
| 29777 | ABT1 | LZE5T | Human | Esophagus | ESCC | 4.48e-03 | 1.09e-01 | 0.0514 |
| 29777 | ABT1 | LZE7T | Human | Esophagus | ESCC | 3.26e-07 | 3.79e-01 | 0.0667 |
| 29777 | ABT1 | LZE8T | Human | Esophagus | ESCC | 1.63e-06 | 1.18e-01 | 0.067 |
| 29777 | ABT1 | LZE20T | Human | Esophagus | ESCC | 3.16e-08 | 2.38e-01 | 0.0662 |
| 29777 | ABT1 | LZE22T | Human | Esophagus | ESCC | 8.43e-04 | 3.86e-01 | 0.068 |
| 29777 | ABT1 | LZE24T | Human | Esophagus | ESCC | 1.15e-19 | 4.70e-01 | 0.0596 |
| 29777 | ABT1 | LZE21T | Human | Esophagus | ESCC | 1.46e-04 | 1.45e-01 | 0.0655 |
| 29777 | ABT1 | LZE6T | Human | Esophagus | ESCC | 4.24e-06 | 1.98e-01 | 0.0845 |
| 29777 | ABT1 | P1T-E | Human | Esophagus | ESCC | 1.28e-10 | 4.57e-01 | 0.0875 |
| 29777 | ABT1 | P2T-E | Human | Esophagus | ESCC | 1.36e-48 | 8.08e-01 | 0.1177 |
| 29777 | ABT1 | P4T-E | Human | Esophagus | ESCC | 4.71e-27 | 6.96e-01 | 0.1323 |
| 29777 | ABT1 | P5T-E | Human | Esophagus | ESCC | 6.92e-17 | 2.23e-01 | 0.1327 |
| 29777 | ABT1 | P8T-E | Human | Esophagus | ESCC | 1.02e-25 | 4.22e-01 | 0.0889 |
| 29777 | ABT1 | P9T-E | Human | Esophagus | ESCC | 8.64e-21 | 4.08e-01 | 0.1131 |
| 29777 | ABT1 | P10T-E | Human | Esophagus | ESCC | 5.04e-21 | 2.39e-01 | 0.116 |
| 29777 | ABT1 | P11T-E | Human | Esophagus | ESCC | 1.90e-11 | 3.75e-01 | 0.1426 |
| 29777 | ABT1 | P12T-E | Human | Esophagus | ESCC | 1.16e-32 | 6.00e-01 | 0.1122 |
| 29777 | ABT1 | P15T-E | Human | Esophagus | ESCC | 1.04e-26 | 5.19e-01 | 0.1149 |
| Page: 1 2 3 4 5 6 |
| Tissue | Expression Dynamics | Abbreviation |
| Esophagus |  | ESCC: Esophageal squamous cell carcinoma |
| HGIN: High-grade intraepithelial neoplasias | ||
| LGIN: Low-grade intraepithelial neoplasias | ||
| Liver |  | HCC: Hepatocellular carcinoma |
| NAFLD: Non-alcoholic fatty liver disease | ||
| Oral Cavity | 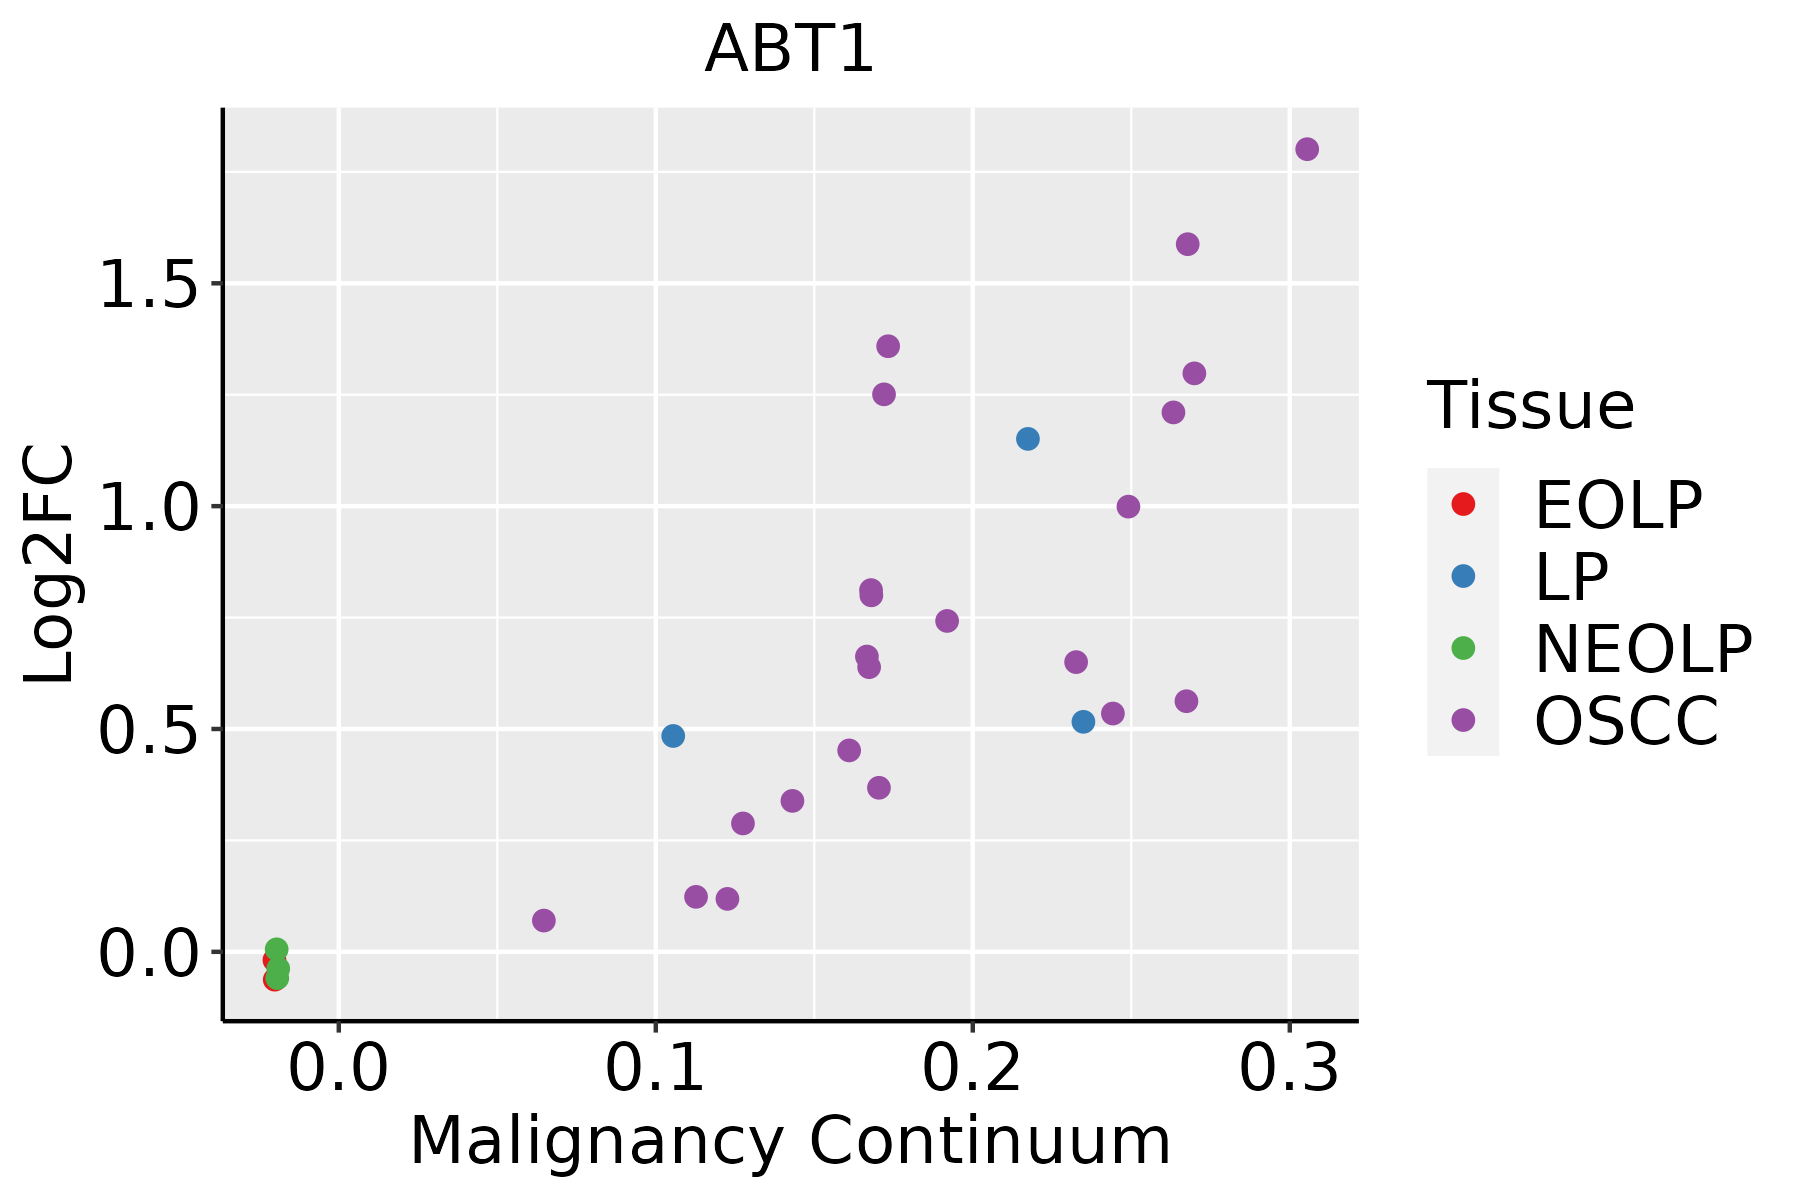 | EOLP: Erosive Oral lichen planus |
| LP: leukoplakia | ||
| NEOLP: Non-erosive oral lichen planus | ||
| OSCC: Oral squamous cell carcinoma | ||
| Skin | 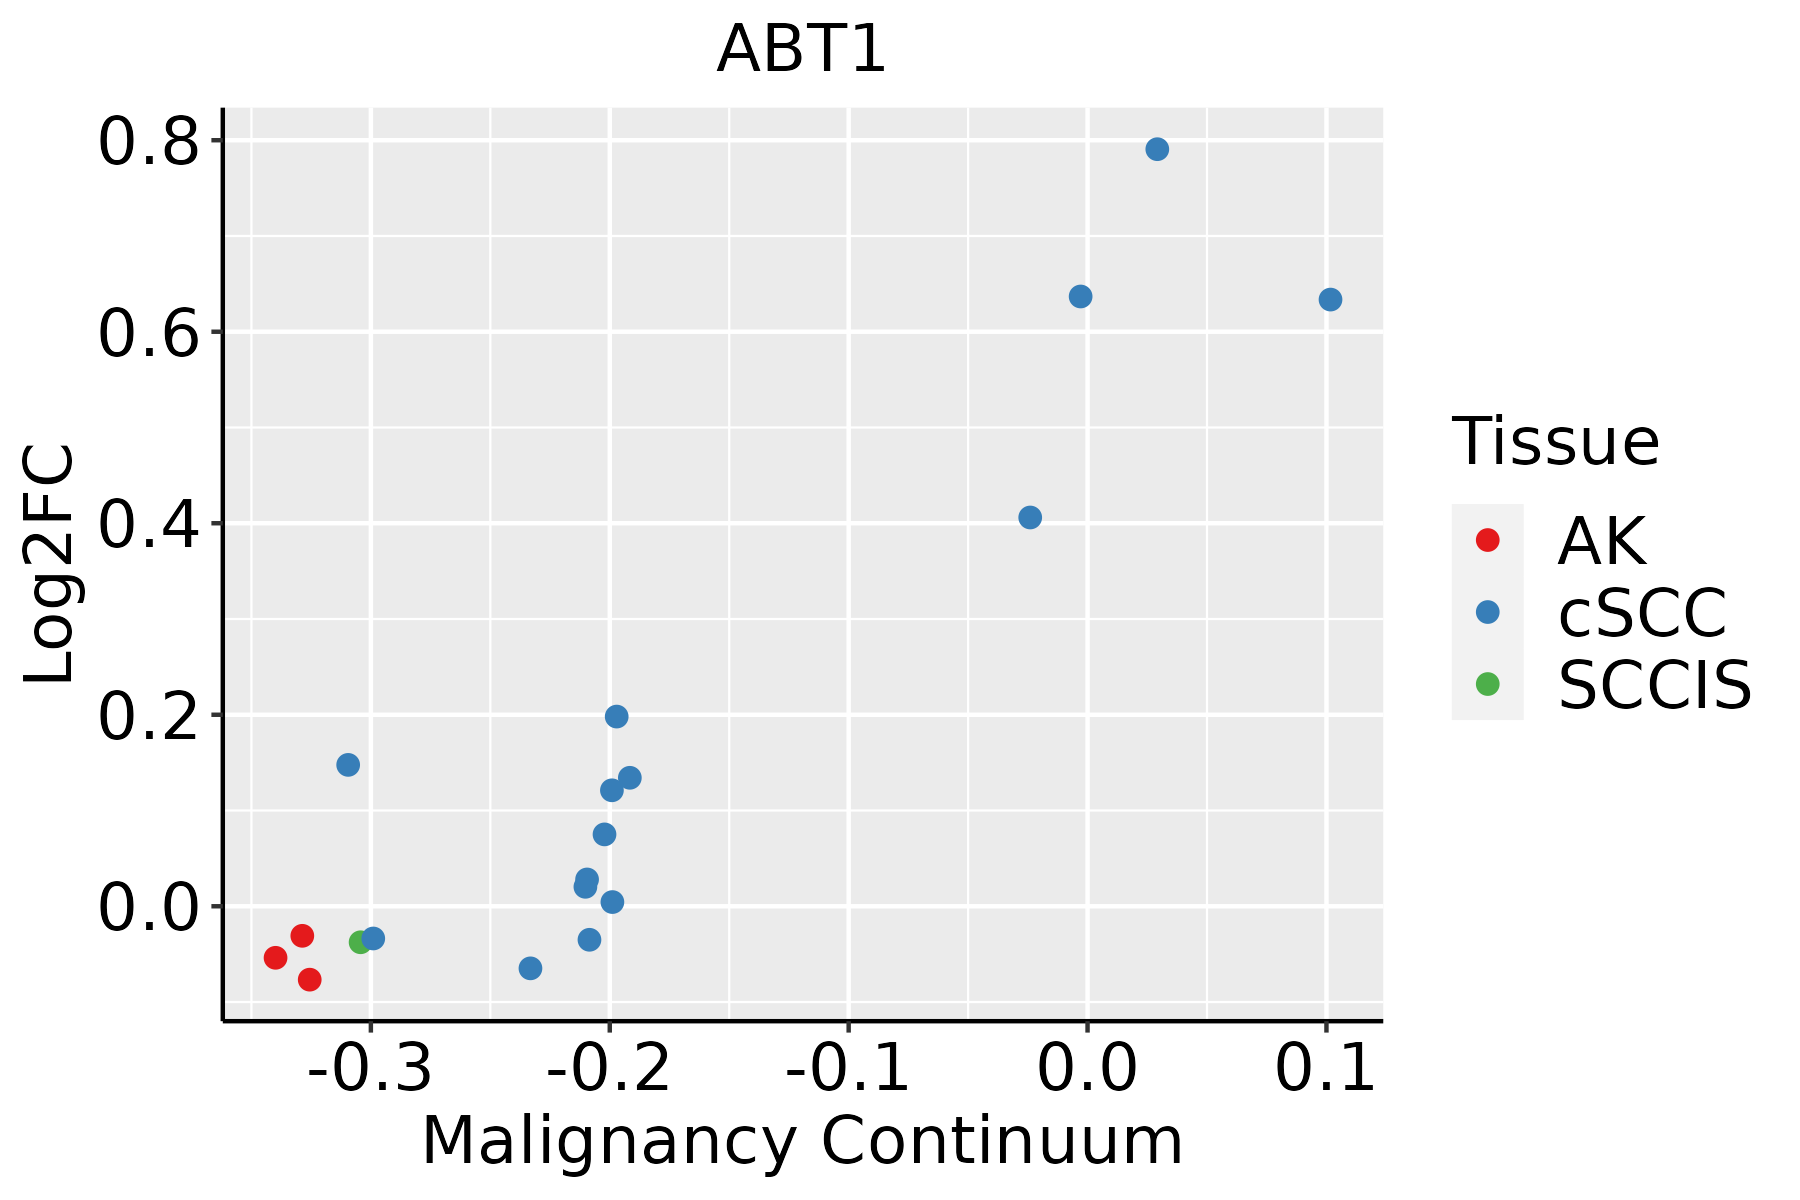 | AK: Actinic keratosis |
| cSCC: Cutaneous squamous cell carcinoma | ||
| SCCIS:squamous cell carcinoma in situ |
| ∗log2FC in expression of this searched gene in stem-like cells from each diseased tissue sample relative to stem-like cells in normal samples in each tissue plotted against the malignancy continuum. Samples are colored based on if they are from different disease stage. |
Top |
Malignant transformation related pathway analysis |
| Find out the enriched GO biological processes and KEGG pathways involved in transition from healthy to precancer to cancer |
| Tissue | Disease Stage | Enriched GO biological Processes |
| Colorectum | AD |  |
| Colorectum | SER |  |
| Colorectum | MSS |  |
| Colorectum | MSI-H |  |
| Colorectum | FAP |  |
| ∗Top 15 enriched GO BP terms are showed in the bar plot of each disease state in each tissue. Each row represents a significant GO biological process which is colored according to the -log10(p.adjust). |
| Page: 1 2 3 4 5 6 7 8 9 |
| GO ID | Tissue | Disease Stage | Description | Gene Ratio | Bg Ratio | pvalue | p.adjust | Count |
| GO:0022613111 | Esophagus | ESCC | ribonucleoprotein complex biogenesis | 365/8552 | 463/18723 | 1.74e-49 | 1.11e-45 | 365 |
| GO:0042254111 | Esophagus | ESCC | ribosome biogenesis | 252/8552 | 299/18723 | 3.27e-44 | 1.04e-40 | 252 |
| GO:003447015 | Esophagus | ESCC | ncRNA processing | 300/8552 | 395/18723 | 3.09e-35 | 3.26e-32 | 300 |
| GO:0016072110 | Esophagus | ESCC | rRNA metabolic process | 197/8552 | 236/18723 | 1.31e-33 | 1.18e-30 | 197 |
| GO:0006364110 | Esophagus | ESCC | rRNA processing | 189/8552 | 225/18723 | 4.88e-33 | 3.87e-30 | 189 |
| GO:003466012 | Esophagus | ESCC | ncRNA metabolic process | 346/8552 | 485/18723 | 4.35e-31 | 2.51e-28 | 346 |
| GO:0071826111 | Esophagus | ESCC | ribonucleoprotein complex subunit organization | 166/8552 | 227/18723 | 2.94e-17 | 2.42e-15 | 166 |
| GO:0042274111 | Esophagus | ESCC | ribosomal small subunit biogenesis | 67/8552 | 73/18723 | 6.62e-17 | 5.38e-15 | 67 |
| GO:0022618111 | Esophagus | ESCC | ribonucleoprotein complex assembly | 159/8552 | 220/18723 | 8.19e-16 | 5.71e-14 | 159 |
| GO:00905013 | Esophagus | ESCC | RNA phosphodiester bond hydrolysis | 110/8552 | 152/18723 | 1.95e-11 | 6.81e-10 | 110 |
| GO:00304904 | Esophagus | ESCC | maturation of SSU-rRNA | 45/8552 | 50/18723 | 5.07e-11 | 1.63e-09 | 45 |
| GO:0042255111 | Esophagus | ESCC | ribosome assembly | 50/8552 | 61/18723 | 5.66e-09 | 1.17e-07 | 50 |
| GO:00903053 | Esophagus | ESCC | nucleic acid phosphodiester bond hydrolysis | 163/8552 | 261/18723 | 3.07e-08 | 5.73e-07 | 163 |
| GO:00004623 | Esophagus | ESCC | maturation of SSU-rRNA from tricistronic rRNA transcript (SSU-rRNA, 5.8S rRNA, LSU-rRNA) | 32/8552 | 37/18723 | 2.96e-07 | 4.23e-06 | 32 |
| GO:00004603 | Esophagus | ESCC | maturation of 5.8S rRNA | 30/8552 | 35/18723 | 1.07e-06 | 1.34e-05 | 30 |
| GO:00004693 | Esophagus | ESCC | cleavage involved in rRNA processing | 24/8552 | 27/18723 | 3.48e-06 | 3.84e-05 | 24 |
| GO:00004663 | Esophagus | ESCC | maturation of 5.8S rRNA from tricistronic rRNA transcript (SSU-rRNA, 5.8S rRNA, LSU-rRNA) | 21/8552 | 24/18723 | 2.57e-05 | 2.17e-04 | 21 |
| GO:00905023 | Esophagus | ESCC | RNA phosphodiester bond hydrolysis, endonucleolytic | 55/8552 | 82/18723 | 7.34e-05 | 5.51e-04 | 55 |
| GO:00004783 | Esophagus | ESCC | endonucleolytic cleavage involved in rRNA processing | 14/8552 | 15/18723 | 1.47e-04 | 9.85e-04 | 14 |
| GO:00004793 | Esophagus | ESCC | endonucleolytic cleavage of tricistronic rRNA transcript (SSU-rRNA, 5.8S rRNA, LSU-rRNA) | 14/8552 | 15/18723 | 1.47e-04 | 9.85e-04 | 14 |
| Page: 1 2 3 4 5 6 7 |
| Pathway ID | Tissue | Disease Stage | Description | Gene Ratio | Bg Ratio | pvalue | p.adjust | qvalue | Count |
| Page: 1 |
Top |
Cell-cell communication analysis |
| Identification of potential cell-cell interactions between two cell types and their ligand-receptor pairs for different disease states |
| Ligand | Receptor | LRpair | Pathway | Tissue | Disease Stage |
| Page: 1 |
Top |
Single-cell gene regulatory network inference analysis |
| Find out the significant the regulons (TFs) and the target genes of each regulon across cell types for different disease states |
| TF | Cell Type | Tissue | Disease Stage | Target Gene | RSS | Regulon Activity |
| ∗The dot plots of a searched regulon are shown for all cell subpopulations in each disease state of each tissue based on the regulon specific score inferred using pySCENIC and by calculating the average expression. |
| Page: 1 |
Top |
Somatic mutation of malignant transformation related genes |
| Annotation of somatic variants for genes involved in malignant transformation |
| Hugo Symbol | Variant Class | Variant Classification | dbSNP RS | HGVSc | HGVSp | HGVSp Short | SWISSPROT | BIOTYPE | SIFT | PolyPhen | Tumor Sample Barcode | Tissue | Histology | Sex | Age | Stage | Therapy Types | Drugs | Outcome |
| ABT1 | SNV | Missense_Mutation | novel | c.378N>A | p.His126Gln | p.H126Q | Q9ULW3 | protein_coding | deleterious(0.01) | probably_damaging(0.931) | TCGA-A2-A3XT-01 | Breast | breast invasive carcinoma | Female | <65 | I/II | Chemotherapy | cyclophosphamide | PR |
| ABT1 | SNV | Missense_Mutation | c.310G>T | p.Asp104Tyr | p.D104Y | Q9ULW3 | protein_coding | deleterious(0.04) | probably_damaging(0.935) | TCGA-AN-A0XS-01 | Breast | breast invasive carcinoma | Female | <65 | III/IV | Unknown | Unknown | SD | |
| ABT1 | SNV | Missense_Mutation | novel | c.463N>T | p.His155Tyr | p.H155Y | Q9ULW3 | protein_coding | deleterious(0) | probably_damaging(0.991) | TCGA-AR-A2LE-01 | Breast | breast invasive carcinoma | Female | >=65 | I/II | Hormone Therapy | tamoxiphen | PD |
| ABT1 | SNV | Missense_Mutation | rs782670086 | c.481G>A | p.Ala161Thr | p.A161T | Q9ULW3 | protein_coding | deleterious(0) | probably_damaging(0.993) | TCGA-2W-A8YY-01 | Cervix | cervical & endocervical cancer | Female | <65 | I/II | Chemotherapy | cisplatin | CR |
| ABT1 | SNV | Missense_Mutation | novel | c.238N>C | p.Glu80Gln | p.E80Q | Q9ULW3 | protein_coding | deleterious(0.02) | possibly_damaging(0.702) | TCGA-HM-A4S6-01 | Cervix | cervical & endocervical cancer | Female | <65 | III/IV | Chemotherapy | cisplatin | CR |
| ABT1 | SNV | Missense_Mutation | rs782097640 | c.539N>A | p.Arg180His | p.R180H | Q9ULW3 | protein_coding | deleterious(0.03) | benign(0.207) | TCGA-AA-3867-01 | Colorectum | colon adenocarcinoma | Male | >=65 | III/IV | Unknown | Unknown | PD |
| ABT1 | SNV | Missense_Mutation | novel | c.120G>T | p.Lys40Asn | p.K40N | Q9ULW3 | protein_coding | tolerated(0.09) | benign(0.286) | TCGA-AA-A00N-01 | Colorectum | colon adenocarcinoma | Male | >=65 | I/II | Unknown | Unknown | PD |
| ABT1 | SNV | Missense_Mutation | c.292A>C | p.Lys98Gln | p.K98Q | Q9ULW3 | protein_coding | tolerated(0.26) | benign(0.216) | TCGA-AA-A00N-01 | Colorectum | colon adenocarcinoma | Male | >=65 | I/II | Unknown | Unknown | PD | |
| ABT1 | SNV | Missense_Mutation | rs374428829 | c.275N>T | p.Ala92Val | p.A92V | Q9ULW3 | protein_coding | tolerated(0.09) | benign(0.001) | TCGA-AZ-4313-01 | Colorectum | colon adenocarcinoma | Female | <65 | I/II | Unknown | Unknown | SD |
| ABT1 | SNV | Missense_Mutation | c.374N>A | p.Leu125Gln | p.L125Q | Q9ULW3 | protein_coding | deleterious(0) | probably_damaging(0.994) | TCGA-AZ-6598-01 | Colorectum | colon adenocarcinoma | Female | >=65 | I/II | Unknown | Unknown | SD |
| Page: 1 2 3 4 |
Top |
Related drugs of malignant transformation related genes |
| Identification of chemicals and drugs interact with genes involved in malignant transfromation |
| (DGIdb 4.0) |
| Entrez ID | Symbol | Category | Interaction Types | Drug Claim Name | Drug Name | PMIDs |
| Page: 1 |

Copyright 2023-Present -The University of Texas Health Science Center at Houston |