
|
|||||
|
 | |
| |
| |
| |
| |
| |
|
Gene: ABRAXAS2 |
Gene summary for ABRAXAS2 |
| Gene information | Species | Human | Gene symbol | ABRAXAS2 | Gene ID | 23172 |
| Gene name | abraxas 2, BRISC complex subunit | |
| Gene Alias | ABRO1 | |
| Cytomap | 10q26.13 | |
| Gene Type | protein-coding | GO ID | GO:0000226 | UniProtAcc | Q15018 |
Top |
Malignant transformation analysis |
| Identification of the aberrant gene expression in precancerous and cancerous lesions by comparing the gene expression of stem-like cells in diseased tissues with normal stem cells |
| Entrez ID | Symbol | Replicates | Species | Organ | Tissue | Adj P-value | Log2FC | Malignancy |
| 23172 | ABRAXAS2 | male-WTA | Human | Thyroid | PTC | 2.76e-08 | 1.47e-01 | 0.1037 |
| 23172 | ABRAXAS2 | PTC01 | Human | Thyroid | PTC | 5.14e-03 | 9.04e-02 | 0.1899 |
| 23172 | ABRAXAS2 | PTC04 | Human | Thyroid | PTC | 1.15e-03 | 1.20e-01 | 0.1927 |
| 23172 | ABRAXAS2 | PTC05 | Human | Thyroid | PTC | 3.72e-10 | 3.54e-01 | 0.2065 |
| 23172 | ABRAXAS2 | PTC06 | Human | Thyroid | PTC | 1.25e-13 | 3.30e-01 | 0.2057 |
| 23172 | ABRAXAS2 | PTC07 | Human | Thyroid | PTC | 1.68e-15 | 2.67e-01 | 0.2044 |
| 23172 | ABRAXAS2 | ATC12 | Human | Thyroid | ATC | 1.09e-02 | 1.17e-01 | 0.34 |
| 23172 | ABRAXAS2 | ATC13 | Human | Thyroid | ATC | 1.24e-09 | 2.38e-01 | 0.34 |
| 23172 | ABRAXAS2 | ATC2 | Human | Thyroid | ATC | 9.94e-09 | 5.69e-01 | 0.34 |
| 23172 | ABRAXAS2 | ATC4 | Human | Thyroid | ATC | 1.40e-02 | 1.20e-01 | 0.34 |
| 23172 | ABRAXAS2 | ATC5 | Human | Thyroid | ATC | 1.04e-12 | 2.58e-01 | 0.34 |
| Page: 1 |
| Tissue | Expression Dynamics | Abbreviation |
| Thyroid | 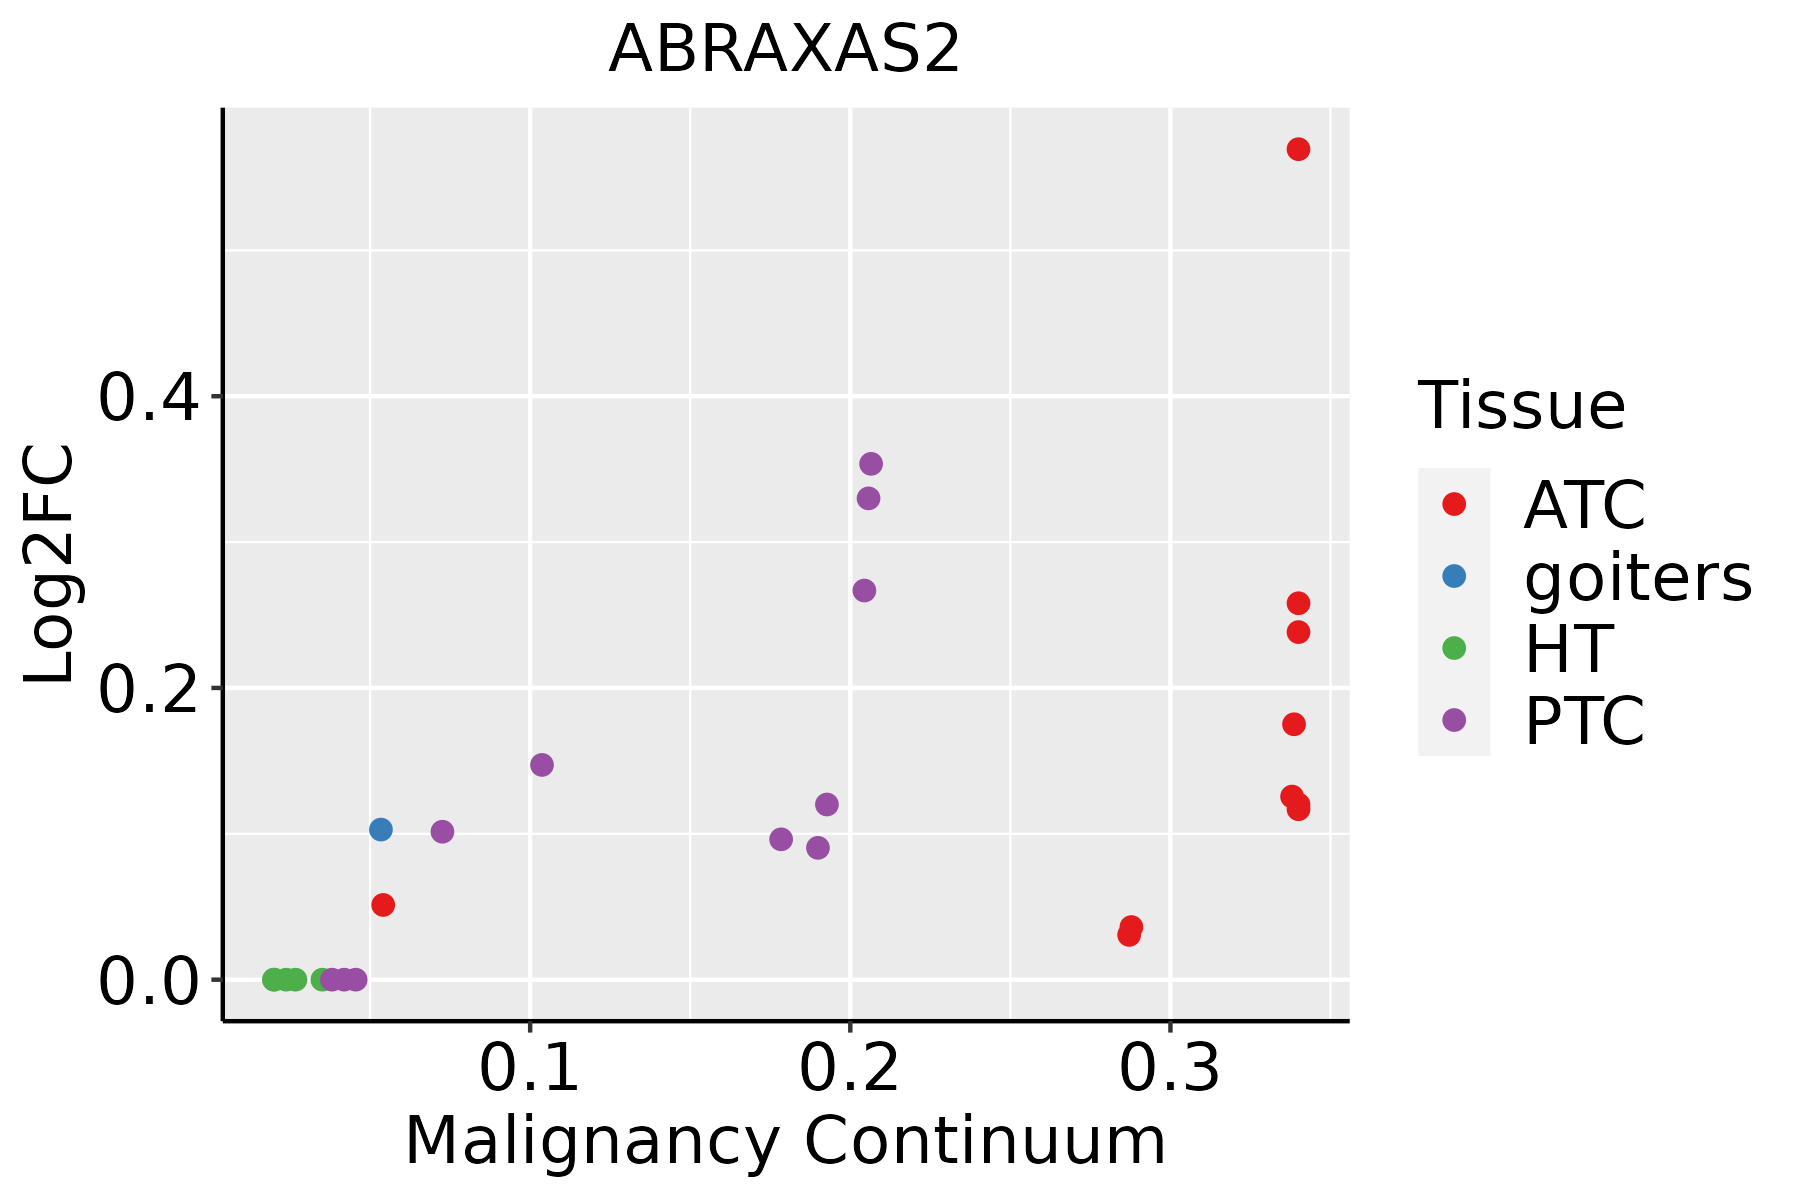 | ATC: Anaplastic thyroid cancer |
| HT: Hashimoto's thyroiditis | ||
| PTC: Papillary thyroid cancer |
| ∗log2FC in expression of this searched gene in stem-like cells from each diseased tissue sample relative to stem-like cells in normal samples in each tissue plotted against the malignancy continuum. Samples are colored based on if they are from different disease stage. |
Top |
Malignant transformation related pathway analysis |
| Find out the enriched GO biological processes and KEGG pathways involved in transition from healthy to precancer to cancer |
| Tissue | Disease Stage | Enriched GO biological Processes |
| Colorectum | AD |  |
| Colorectum | SER |  |
| Colorectum | MSS |  |
| Colorectum | MSI-H |  |
| Colorectum | FAP |  |
| ∗Top 15 enriched GO BP terms are showed in the bar plot of each disease state in each tissue. Each row represents a significant GO biological process which is colored according to the -log10(p.adjust). |
| Page: 1 2 3 4 5 6 7 8 9 |
| GO ID | Tissue | Disease Stage | Description | Gene Ratio | Bg Ratio | pvalue | p.adjust | Count |
| GO:01400148 | Thyroid | PTC | mitotic nuclear division | 135/5968 | 287/18723 | 4.90e-08 | 1.04e-06 | 135 |
| GO:000705116 | Thyroid | PTC | spindle organization | 92/5968 | 184/18723 | 2.21e-07 | 3.92e-06 | 92 |
| GO:19028509 | Thyroid | PTC | microtubule cytoskeleton organization involved in mitosis | 76/5968 | 147/18723 | 4.49e-07 | 7.38e-06 | 76 |
| GO:000705216 | Thyroid | PTC | mitotic spindle organization | 64/5968 | 120/18723 | 8.69e-07 | 1.32e-05 | 64 |
| GO:00070595 | Thyroid | PTC | chromosome segregation | 146/5968 | 346/18723 | 2.99e-05 | 2.87e-04 | 146 |
| GO:005122514 | Thyroid | PTC | spindle assembly | 56/5968 | 117/18723 | 2.17e-04 | 1.60e-03 | 56 |
| GO:00706465 | Thyroid | PTC | protein modification by small protein removal | 71/5968 | 157/18723 | 3.03e-04 | 2.12e-03 | 71 |
| GO:00029314 | Thyroid | PTC | response to ischemia | 31/5968 | 58/18723 | 5.31e-04 | 3.41e-03 | 31 |
| GO:00482855 | Thyroid | PTC | organelle fission | 188/5968 | 488/18723 | 9.64e-04 | 5.77e-03 | 188 |
| GO:009030717 | Thyroid | PTC | mitotic spindle assembly | 33/5968 | 65/18723 | 1.17e-03 | 6.81e-03 | 33 |
| GO:00988135 | Thyroid | PTC | nuclear chromosome segregation | 114/5968 | 281/18723 | 1.21e-03 | 6.94e-03 | 114 |
| GO:00705363 | Thyroid | PTC | protein K63-linked deubiquitination | 20/5968 | 35/18723 | 1.75e-03 | 9.51e-03 | 20 |
| GO:00002804 | Thyroid | PTC | nuclear division | 167/5968 | 439/18723 | 3.27e-03 | 1.60e-02 | 167 |
| GO:00165794 | Thyroid | PTC | protein deubiquitination | 59/5968 | 139/18723 | 5.50e-03 | 2.50e-02 | 59 |
| GO:014001416 | Thyroid | ATC | mitotic nuclear division | 171/6293 | 287/18723 | 1.13e-19 | 1.66e-17 | 171 |
| GO:190285017 | Thyroid | ATC | microtubule cytoskeleton organization involved in mitosis | 95/6293 | 147/18723 | 1.29e-14 | 7.62e-13 | 95 |
| GO:000705913 | Thyroid | ATC | chromosome segregation | 183/6293 | 346/18723 | 8.03e-14 | 4.23e-12 | 183 |
| GO:000705222 | Thyroid | ATC | mitotic spindle organization | 80/6293 | 120/18723 | 1.27e-13 | 6.46e-12 | 80 |
| GO:000705122 | Thyroid | ATC | spindle organization | 109/6293 | 184/18723 | 7.99e-13 | 3.46e-11 | 109 |
| GO:009881312 | Thyroid | ATC | nuclear chromosome segregation | 145/6293 | 281/18723 | 3.06e-10 | 8.61e-09 | 145 |
| Page: 1 2 |
| Pathway ID | Tissue | Disease Stage | Description | Gene Ratio | Bg Ratio | pvalue | p.adjust | qvalue | Count |
| Page: 1 |
Top |
Cell-cell communication analysis |
| Identification of potential cell-cell interactions between two cell types and their ligand-receptor pairs for different disease states |
| Ligand | Receptor | LRpair | Pathway | Tissue | Disease Stage |
| Page: 1 |
Top |
Single-cell gene regulatory network inference analysis |
| Find out the significant the regulons (TFs) and the target genes of each regulon across cell types for different disease states |
| TF | Cell Type | Tissue | Disease Stage | Target Gene | RSS | Regulon Activity |
| ∗The dot plots of a searched regulon are shown for all cell subpopulations in each disease state of each tissue based on the regulon specific score inferred using pySCENIC and by calculating the average expression. |
| Page: 1 |
Top |
Somatic mutation of malignant transformation related genes |
| Annotation of somatic variants for genes involved in malignant transformation |
| Hugo Symbol | Variant Class | Variant Classification | dbSNP RS | HGVSc | HGVSp | HGVSp Short | SWISSPROT | BIOTYPE | SIFT | PolyPhen | Tumor Sample Barcode | Tissue | Histology | Sex | Age | Stage | Therapy Types | Drugs | Outcome |
| Page: 1 |
Top |
Related drugs of malignant transformation related genes |
| Identification of chemicals and drugs interact with genes involved in malignant transfromation |
| (DGIdb 4.0) |
| Entrez ID | Symbol | Category | Interaction Types | Drug Claim Name | Drug Name | PMIDs |
| Page: 1 |

Copyright 2023-Present -The University of Texas Health Science Center at Houston |