
|
|||||
|
 | |
| |
| |
| |
| |
| |
|
Gene: ABRACL |
Gene summary for ABRACL |
| Gene information | Species | Human | Gene symbol | ABRACL | Gene ID | 58527 |
| Gene name | ABRA C-terminal like | |
| Gene Alias | C6orf115 | |
| Cytomap | 6q24.1 | |
| Gene Type | protein-coding | GO ID | GO:0008150 | UniProtAcc | Q9P1F3 |
Top |
Malignant transformation analysis |
| Identification of the aberrant gene expression in precancerous and cancerous lesions by comparing the gene expression of stem-like cells in diseased tissues with normal stem cells |
| Entrez ID | Symbol | Replicates | Species | Organ | Tissue | Adj P-value | Log2FC | Malignancy |
| 58527 | ABRACL | GSM4909285 | Human | Breast | IDC | 3.12e-43 | 7.41e-01 | 0.21 |
| 58527 | ABRACL | GSM4909287 | Human | Breast | IDC | 1.25e-06 | 3.47e-01 | 0.2057 |
| 58527 | ABRACL | GSM4909288 | Human | Breast | IDC | 1.70e-03 | -1.09e-02 | 0.0988 |
| 58527 | ABRACL | GSM4909289 | Human | Breast | IDC | 3.25e-31 | 1.17e+00 | 0.1064 |
| 58527 | ABRACL | GSM4909290 | Human | Breast | IDC | 1.09e-21 | 6.42e-01 | 0.2096 |
| 58527 | ABRACL | GSM4909296 | Human | Breast | IDC | 1.49e-08 | -1.96e-01 | 0.1524 |
| 58527 | ABRACL | GSM4909297 | Human | Breast | IDC | 3.03e-11 | -3.35e-01 | 0.1517 |
| 58527 | ABRACL | GSM4909304 | Human | Breast | IDC | 8.80e-04 | -3.00e-01 | 0.1636 |
| 58527 | ABRACL | GSM4909308 | Human | Breast | IDC | 8.17e-06 | 3.00e-01 | 0.158 |
| 58527 | ABRACL | GSM4909311 | Human | Breast | IDC | 4.25e-19 | -4.34e-01 | 0.1534 |
| 58527 | ABRACL | GSM4909312 | Human | Breast | IDC | 1.43e-07 | -3.08e-01 | 0.1552 |
| 58527 | ABRACL | GSM4909313 | Human | Breast | IDC | 6.29e-03 | -8.03e-02 | 0.0391 |
| 58527 | ABRACL | GSM4909315 | Human | Breast | IDC | 5.90e-24 | 5.50e-01 | 0.21 |
| 58527 | ABRACL | GSM4909316 | Human | Breast | IDC | 3.84e-08 | 3.67e-01 | 0.21 |
| 58527 | ABRACL | GSM4909319 | Human | Breast | IDC | 4.55e-26 | -4.51e-01 | 0.1563 |
| 58527 | ABRACL | GSM4909320 | Human | Breast | IDC | 1.43e-08 | -4.18e-01 | 0.1575 |
| 58527 | ABRACL | GSM4909321 | Human | Breast | IDC | 8.63e-10 | -2.88e-01 | 0.1559 |
| 58527 | ABRACL | brca2 | Human | Breast | Precancer | 8.22e-13 | 4.01e-01 | -0.024 |
| 58527 | ABRACL | brca3 | Human | Breast | Precancer | 2.93e-05 | 2.79e-01 | -0.0263 |
| 58527 | ABRACL | M2 | Human | Breast | IDC | 1.26e-15 | 6.19e-01 | 0.21 |
| Page: 1 2 3 4 5 6 7 8 |
| Tissue | Expression Dynamics | Abbreviation |
| Breast |  | IDC: Invasive ductal carcinoma |
| DCIS: Ductal carcinoma in situ | ||
| Precancer(BRCA1-mut): Precancerous lesion from BRCA1 mutation carriers | ||
| Colorectum (GSE201348) | 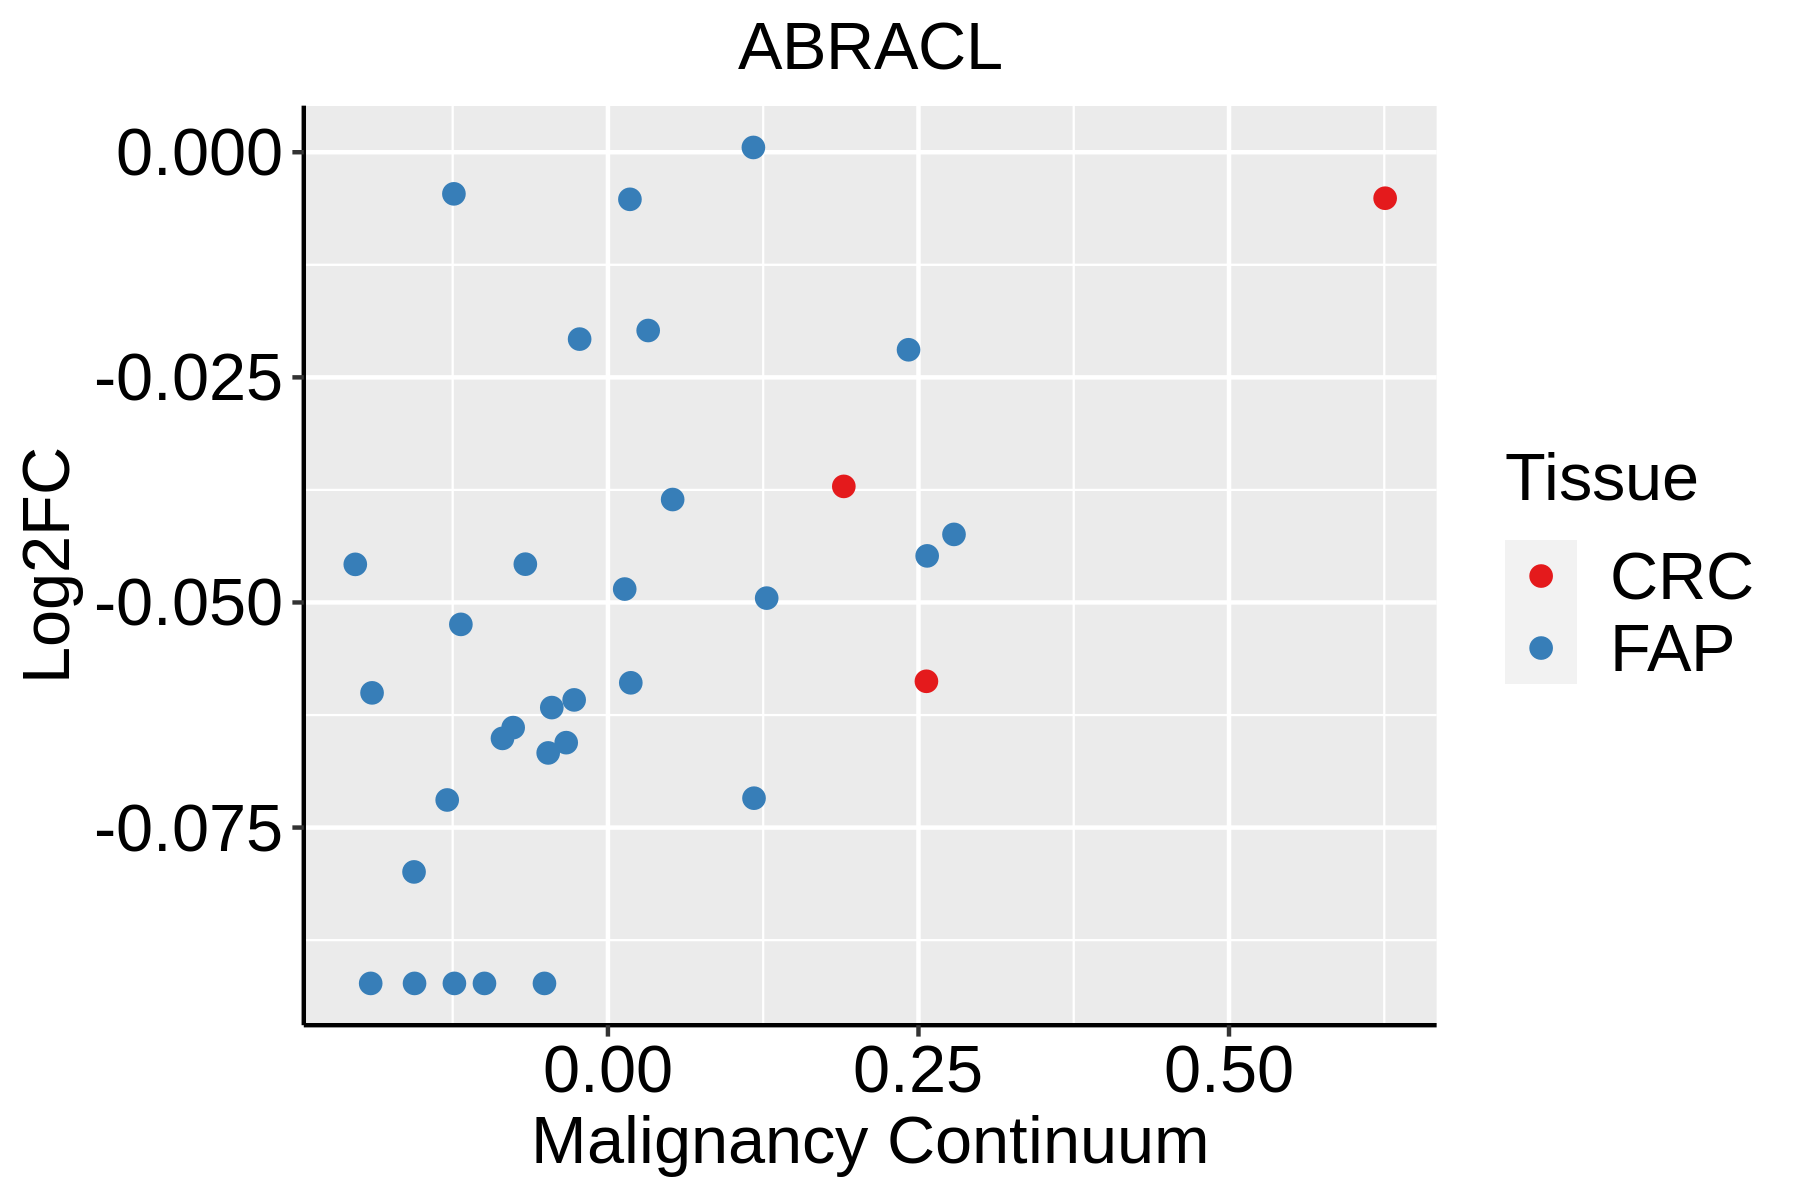 | FAP: Familial adenomatous polyposis |
| CRC: Colorectal cancer | ||
| Colorectum (HTA11) |  | AD: Adenomas |
| SER: Sessile serrated lesions | ||
| MSI-H: Microsatellite-high colorectal cancer | ||
| MSS: Microsatellite stable colorectal cancer | ||
| Esophagus |  | ESCC: Esophageal squamous cell carcinoma |
| HGIN: High-grade intraepithelial neoplasias | ||
| LGIN: Low-grade intraepithelial neoplasias | ||
| Liver | 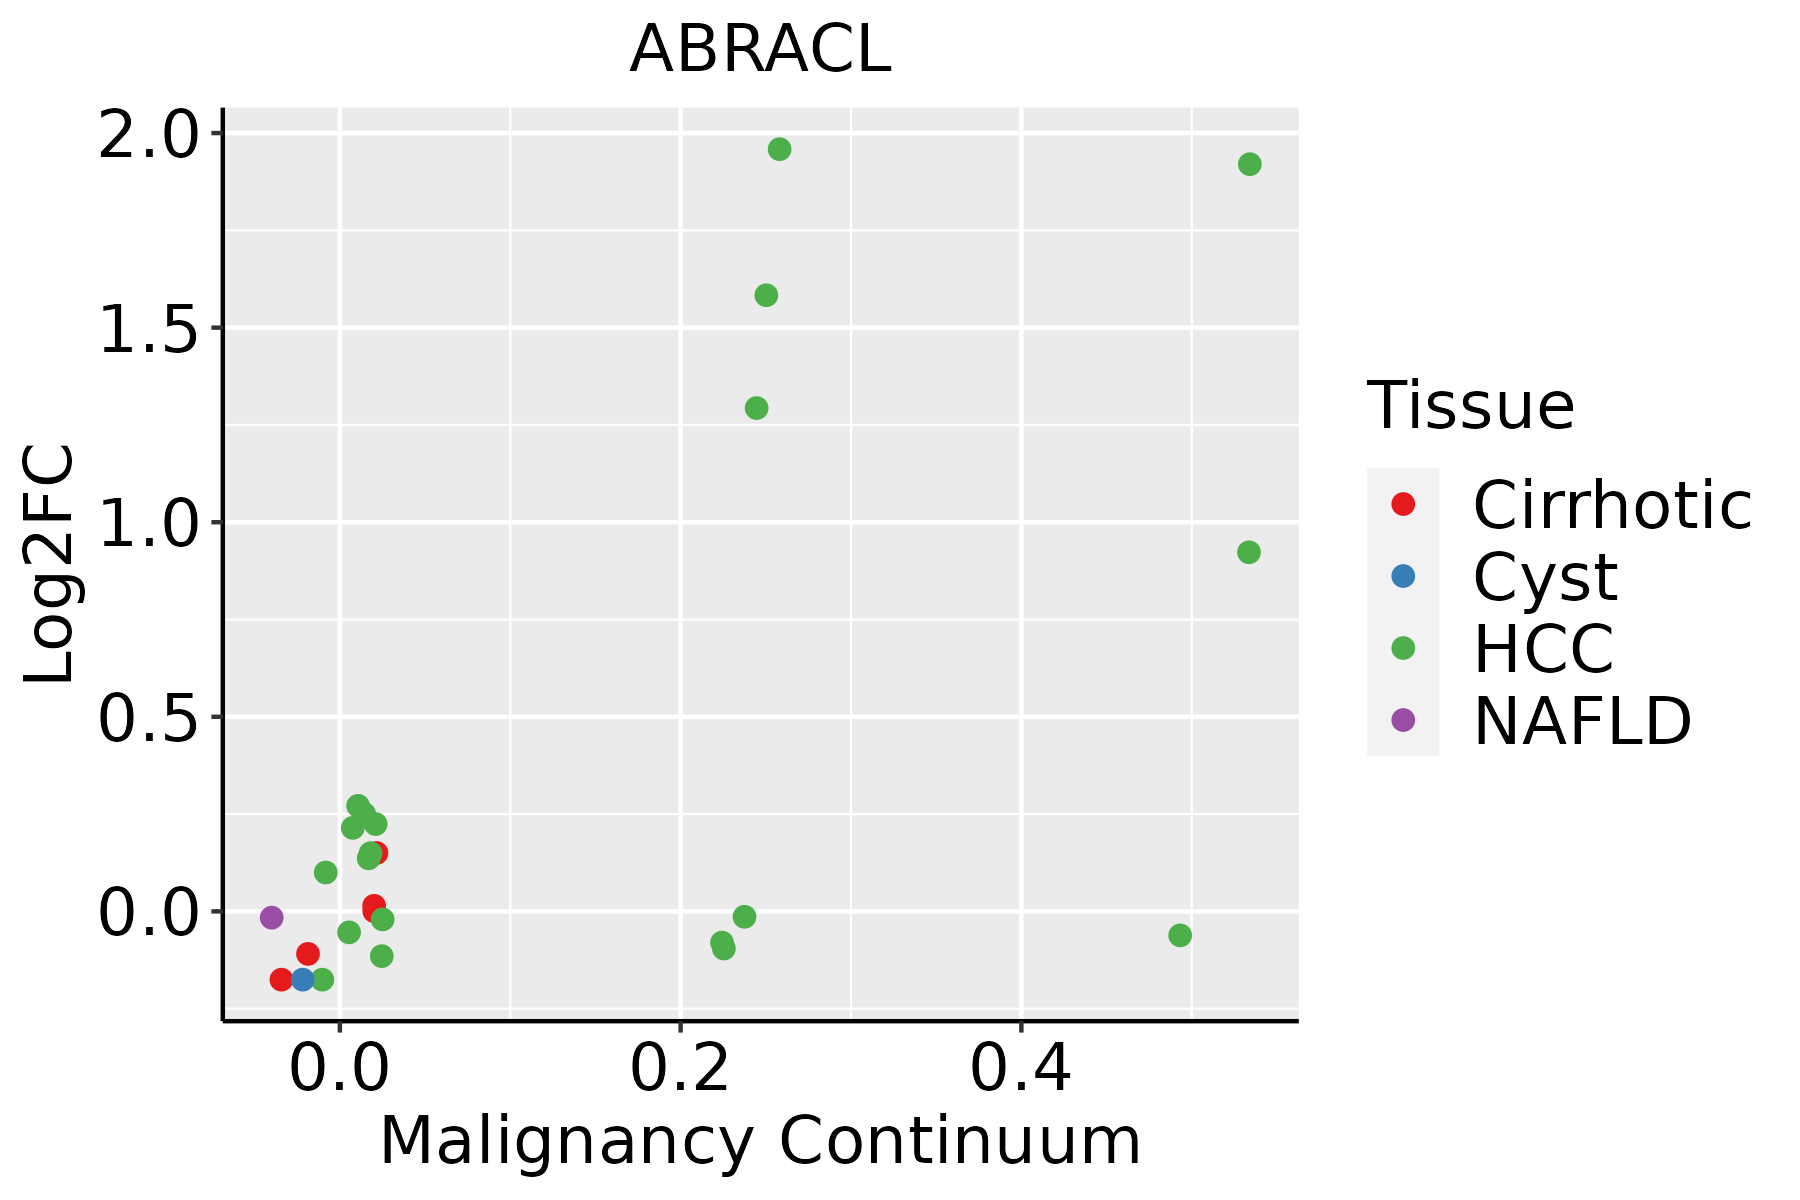 | HCC: Hepatocellular carcinoma |
| NAFLD: Non-alcoholic fatty liver disease | ||
| Oral Cavity | 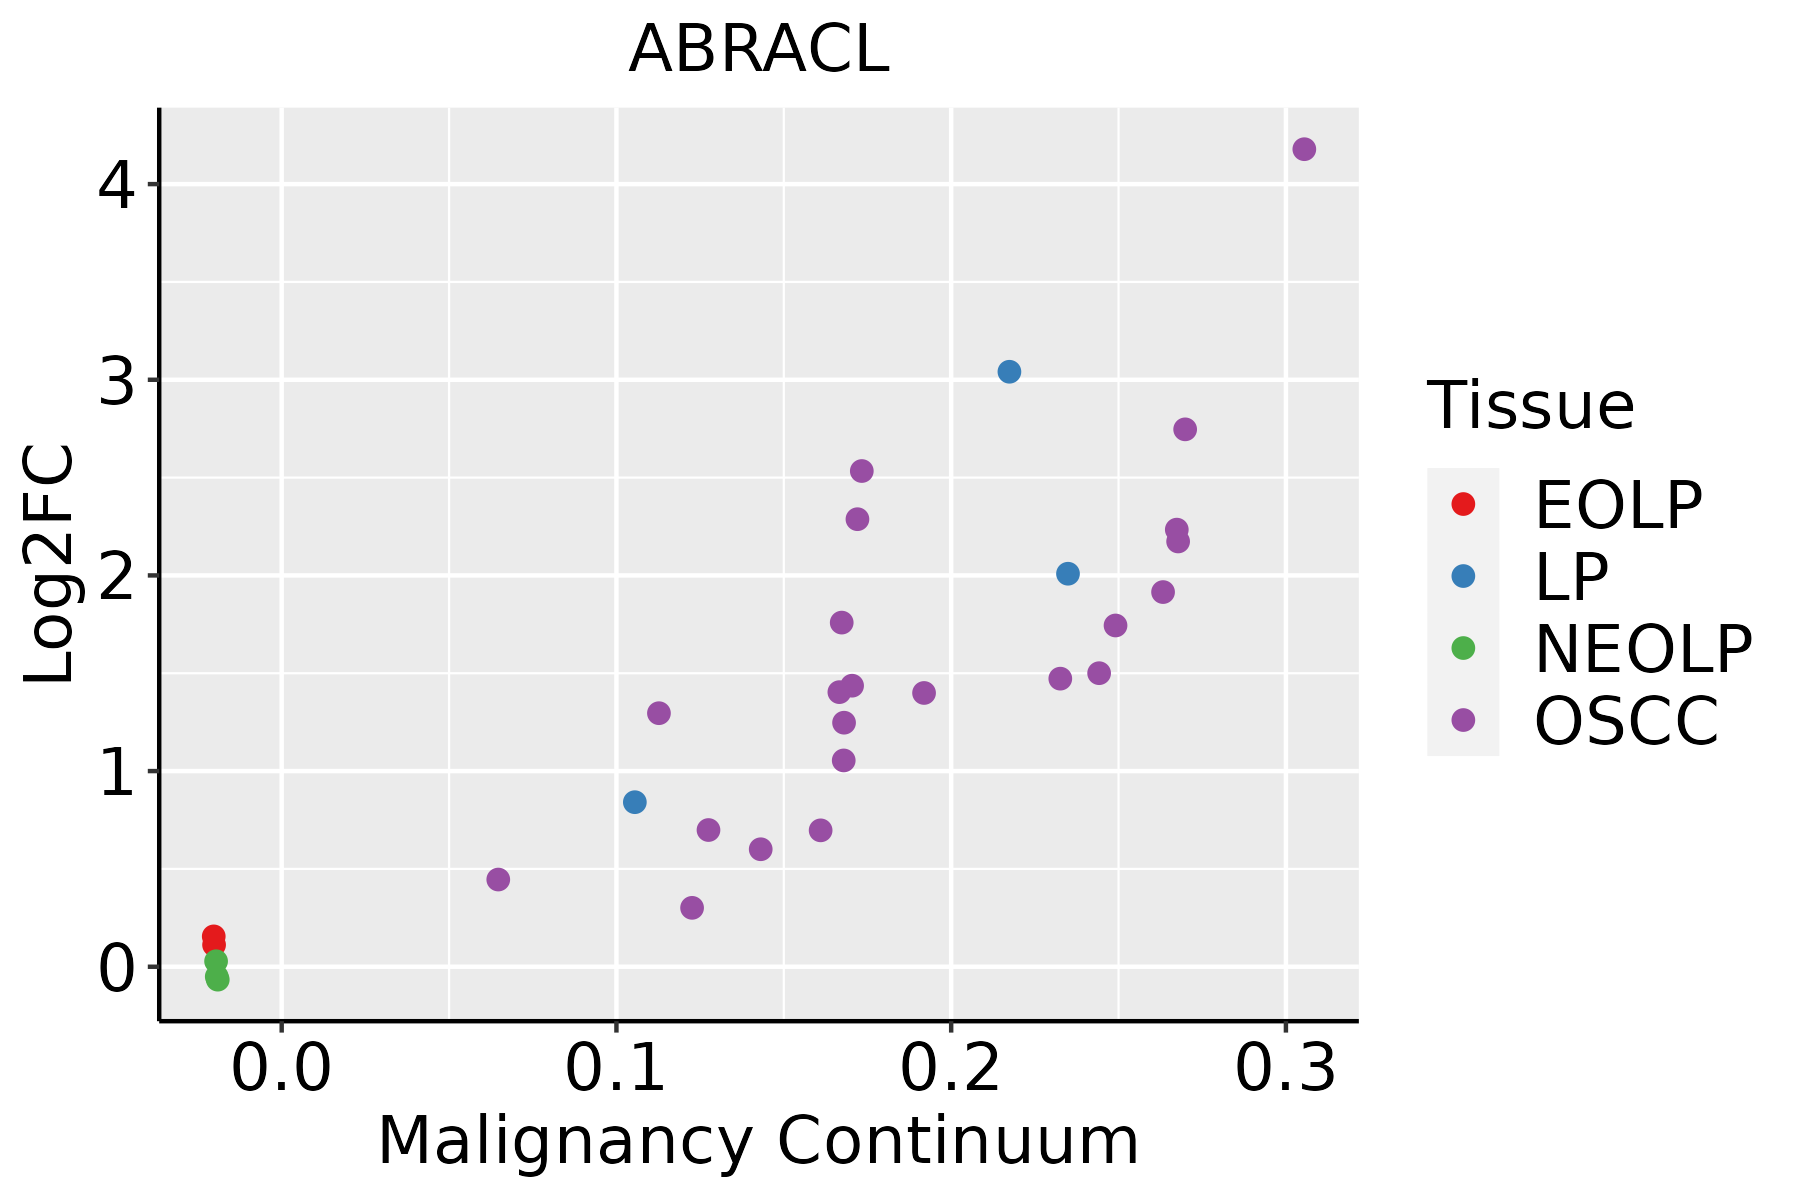 | EOLP: Erosive Oral lichen planus |
| LP: leukoplakia | ||
| NEOLP: Non-erosive oral lichen planus | ||
| OSCC: Oral squamous cell carcinoma | ||
| Prostate |  | BPH: Benign Prostatic Hyperplasia |
| Skin |  | AK: Actinic keratosis |
| cSCC: Cutaneous squamous cell carcinoma | ||
| SCCIS:squamous cell carcinoma in situ | ||
| Thyroid | 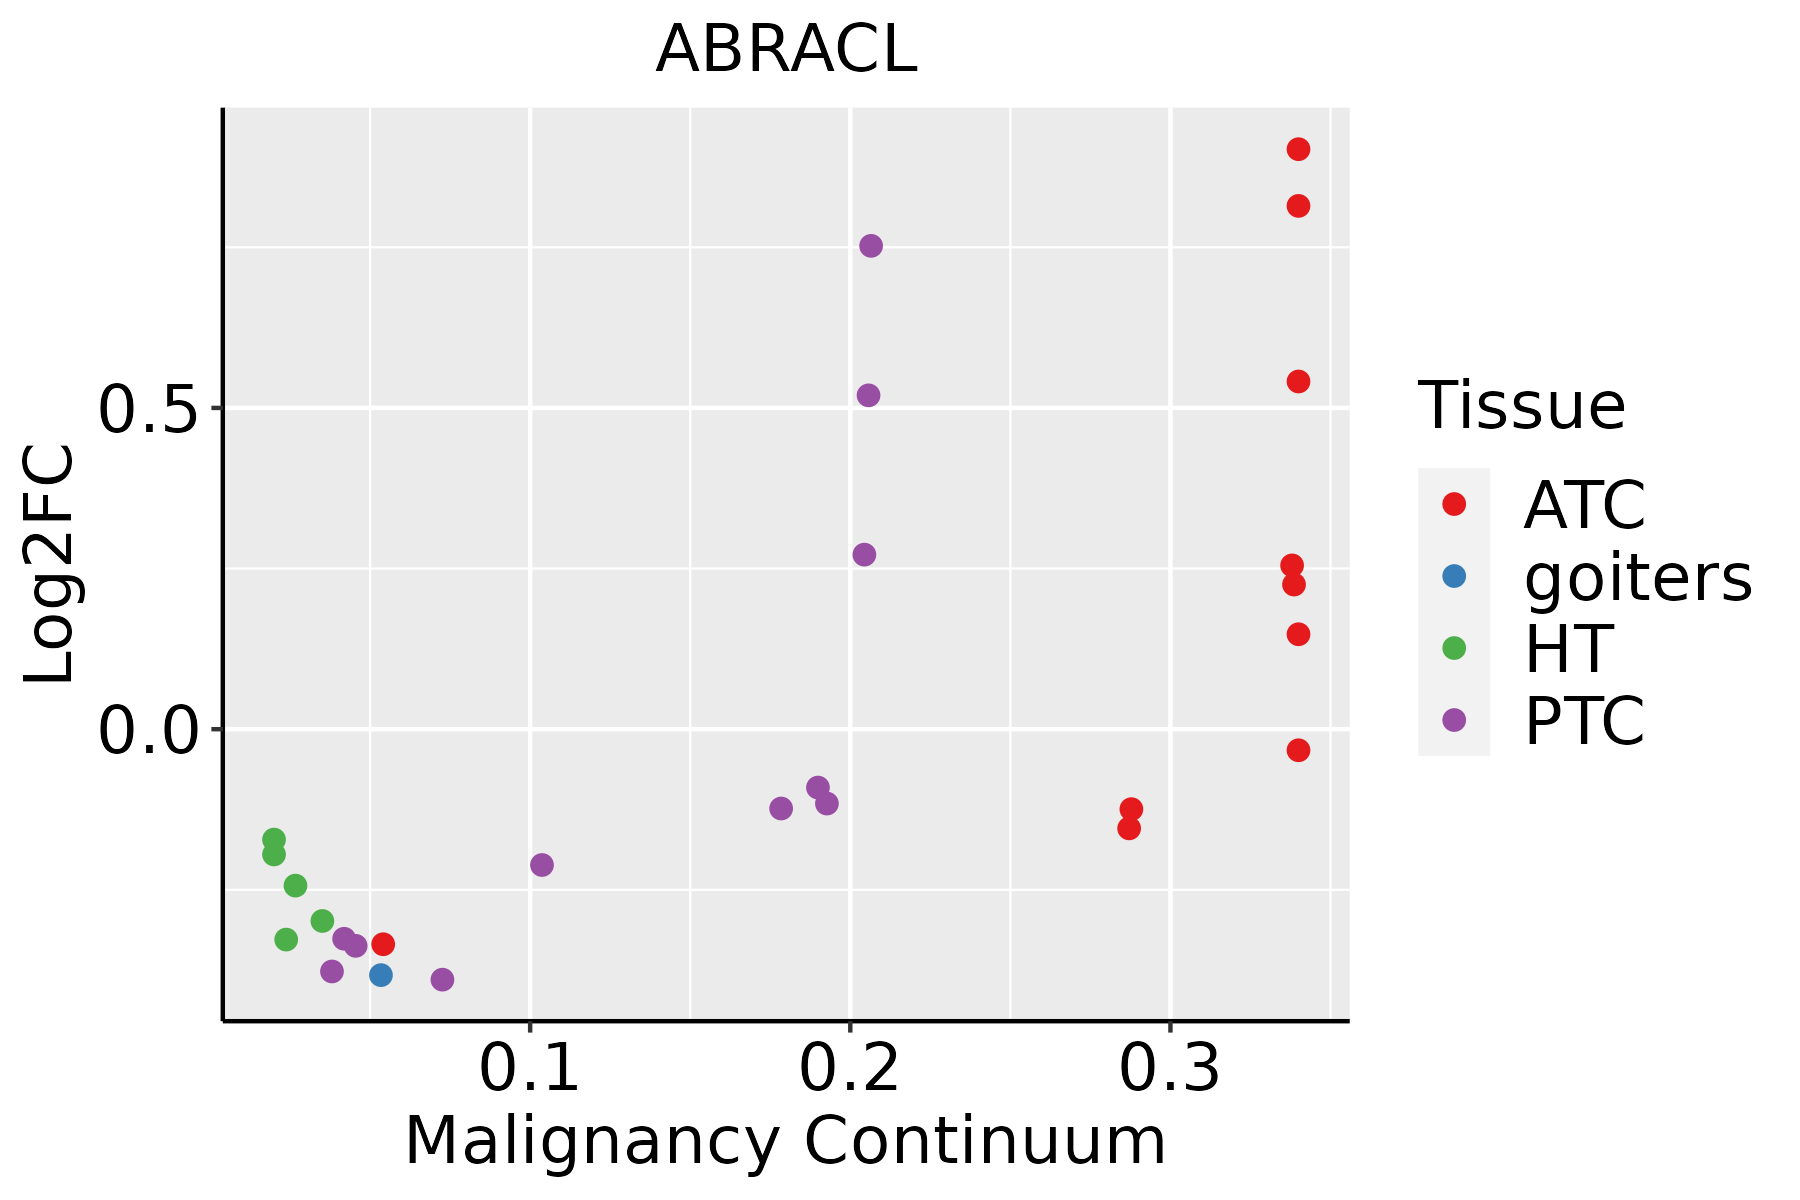 | ATC: Anaplastic thyroid cancer |
| HT: Hashimoto's thyroiditis | ||
| PTC: Papillary thyroid cancer |
| ∗log2FC in expression of this searched gene in stem-like cells from each diseased tissue sample relative to stem-like cells in normal samples in each tissue plotted against the malignancy continuum. Samples are colored based on if they are from different disease stage. |
Top |
Malignant transformation related pathway analysis |
| Find out the enriched GO biological processes and KEGG pathways involved in transition from healthy to precancer to cancer |
| Tissue | Disease Stage | Enriched GO biological Processes |
| Colorectum | AD |  |
| Colorectum | SER |  |
| Colorectum | MSS |  |
| Colorectum | MSI-H |  |
| Colorectum | FAP |  |
| ∗Top 15 enriched GO BP terms are showed in the bar plot of each disease state in each tissue. Each row represents a significant GO biological process which is colored according to the -log10(p.adjust). |
| Page: 1 2 3 4 5 6 7 8 9 |
| GO ID | Tissue | Disease Stage | Description | Gene Ratio | Bg Ratio | pvalue | p.adjust | Count |
| GO:00329709 | Breast | Precancer | regulation of actin filament-based process | 42/1080 | 397/18723 | 1.11e-04 | 2.01e-03 | 42 |
| GO:003297014 | Breast | IDC | regulation of actin filament-based process | 56/1434 | 397/18723 | 6.37e-06 | 1.99e-04 | 56 |
| GO:003297024 | Breast | DCIS | regulation of actin filament-based process | 56/1390 | 397/18723 | 2.50e-06 | 8.74e-05 | 56 |
| GO:0032970 | Colorectum | AD | regulation of actin filament-based process | 142/3918 | 397/18723 | 4.05e-12 | 5.90e-10 | 142 |
| GO:00329702 | Colorectum | MSS | regulation of actin filament-based process | 128/3467 | 397/18723 | 2.47e-11 | 3.49e-09 | 128 |
| GO:00329704 | Colorectum | FAP | regulation of actin filament-based process | 105/2622 | 397/18723 | 3.15e-11 | 1.38e-08 | 105 |
| GO:003297027 | Esophagus | HGIN | regulation of actin filament-based process | 77/2587 | 397/18723 | 1.14e-03 | 1.39e-02 | 77 |
| GO:0032970111 | Esophagus | ESCC | regulation of actin filament-based process | 231/8552 | 397/18723 | 2.91e-07 | 4.20e-06 | 231 |
| GO:003297012 | Liver | Cirrhotic | regulation of actin filament-based process | 152/4634 | 397/18723 | 1.12e-09 | 5.00e-08 | 152 |
| GO:003297022 | Liver | HCC | regulation of actin filament-based process | 222/7958 | 397/18723 | 3.81e-08 | 8.30e-07 | 222 |
| GO:003297020 | Oral cavity | OSCC | regulation of actin filament-based process | 209/7305 | 397/18723 | 1.89e-08 | 3.72e-07 | 209 |
| GO:0032970110 | Oral cavity | LP | regulation of actin filament-based process | 133/4623 | 397/18723 | 4.21e-05 | 6.09e-04 | 133 |
| GO:003297018 | Prostate | BPH | regulation of actin filament-based process | 133/3107 | 397/18723 | 7.07e-17 | 1.62e-14 | 133 |
| GO:003297019 | Prostate | Tumor | regulation of actin filament-based process | 133/3246 | 397/18723 | 2.59e-15 | 4.35e-13 | 133 |
| GO:003297029 | Skin | cSCC | regulation of actin filament-based process | 142/4864 | 397/18723 | 8.50e-06 | 1.13e-04 | 142 |
| GO:0032970113 | Thyroid | PTC | regulation of actin filament-based process | 197/5968 | 397/18723 | 8.91e-14 | 4.89e-12 | 197 |
| GO:0032970210 | Thyroid | ATC | regulation of actin filament-based process | 208/6293 | 397/18723 | 5.82e-15 | 3.80e-13 | 208 |
| Page: 1 |
| Pathway ID | Tissue | Disease Stage | Description | Gene Ratio | Bg Ratio | pvalue | p.adjust | qvalue | Count |
| Page: 1 |
Top |
Cell-cell communication analysis |
| Identification of potential cell-cell interactions between two cell types and their ligand-receptor pairs for different disease states |
| Ligand | Receptor | LRpair | Pathway | Tissue | Disease Stage |
| Page: 1 |
Top |
Single-cell gene regulatory network inference analysis |
| Find out the significant the regulons (TFs) and the target genes of each regulon across cell types for different disease states |
| TF | Cell Type | Tissue | Disease Stage | Target Gene | RSS | Regulon Activity |
| ∗The dot plots of a searched regulon are shown for all cell subpopulations in each disease state of each tissue based on the regulon specific score inferred using pySCENIC and by calculating the average expression. |
| Page: 1 |
Top |
Somatic mutation of malignant transformation related genes |
| Annotation of somatic variants for genes involved in malignant transformation |
| Hugo Symbol | Variant Class | Variant Classification | dbSNP RS | HGVSc | HGVSp | HGVSp Short | SWISSPROT | BIOTYPE | SIFT | PolyPhen | Tumor Sample Barcode | Tissue | Histology | Sex | Age | Stage | Therapy Types | Drugs | Outcome |
| ABRACL | SNV | Missense_Mutation | novel | c.37G>A | p.Glu13Lys | p.E13K | Q9P1F3 | protein_coding | tolerated(0.41) | benign(0.242) | TCGA-2W-A8YY-01 | Cervix | cervical & endocervical cancer | Female | <65 | I/II | Chemotherapy | cisplatin | CR |
| ABRACL | SNV | Missense_Mutation | rs772960368 | c.164N>A | p.Arg55Gln | p.R55Q | Q9P1F3 | protein_coding | tolerated(0.07) | benign(0.044) | TCGA-AA-3984-01 | Colorectum | colon adenocarcinoma | Female | <65 | I/II | Unknown | Unknown | SD |
| ABRACL | SNV | Missense_Mutation | novel | c.132N>C | p.Glu44Asp | p.E44D | Q9P1F3 | protein_coding | deleterious(0.04) | probably_damaging(0.996) | TCGA-A5-A0G2-01 | Endometrium | uterine corpus endometrioid carcinoma | Female | <65 | III/IV | Unknown | Unknown | SD |
| ABRACL | SNV | Missense_Mutation | c.31G>C | p.Val11Leu | p.V11L | Q9P1F3 | protein_coding | tolerated(0.4) | benign(0.059) | TCGA-44-3918-01 | Lung | lung adenocarcinoma | Female | <65 | I/II | Chemotherapy | carboplatin | SD | |
| ABRACL | SNV | Missense_Mutation | novel | c.154N>T | p.Ala52Ser | p.A52S | Q9P1F3 | protein_coding | tolerated(0.07) | benign(0.103) | TCGA-VQ-A91S-01 | Stomach | stomach adenocarcinoma | Male | <65 | III/IV | Chemotherapy | fluorouracil | CR |
| Page: 1 |
Top |
Related drugs of malignant transformation related genes |
| Identification of chemicals and drugs interact with genes involved in malignant transfromation |
| (DGIdb 4.0) |
| Entrez ID | Symbol | Category | Interaction Types | Drug Claim Name | Drug Name | PMIDs |
| Page: 1 |

Copyright 2023-Present -The University of Texas Health Science Center at Houston |