
|
|||||
|
 | |
| |
| |
| |
| |
| |
|
Gene: ABR |
Gene summary for ABR |
| Gene information | Species | Human | Gene symbol | ABR | Gene ID | 29 |
| Gene name | ABR activator of RhoGEF and GTPase | |
| Gene Alias | MDB | |
| Cytomap | 17p13.3 | |
| Gene Type | protein-coding | GO ID | GO:0007154 | UniProtAcc | B7Z2X0 |
Top |
Malignant transformation analysis |
| Identification of the aberrant gene expression in precancerous and cancerous lesions by comparing the gene expression of stem-like cells in diseased tissues with normal stem cells |
| Entrez ID | Symbol | Replicates | Species | Organ | Tissue | Adj P-value | Log2FC | Malignancy |
| 29 | ABR | HTA11_2487_2000001011 | Human | Colorectum | SER | 1.34e-03 | 4.32e-01 | -0.1808 |
| 29 | ABR | HTA11_2951_2000001011 | Human | Colorectum | AD | 3.14e-02 | 3.36e-01 | 0.0216 |
| 29 | ABR | HTA11_1938_2000001011 | Human | Colorectum | AD | 8.46e-13 | 6.76e-01 | -0.0811 |
| 29 | ABR | HTA11_347_2000001011 | Human | Colorectum | AD | 1.39e-20 | 8.89e-01 | -0.1954 |
| 29 | ABR | HTA11_3361_2000001011 | Human | Colorectum | AD | 2.75e-11 | 6.03e-01 | -0.1207 |
| 29 | ABR | HTA11_83_2000001011 | Human | Colorectum | SER | 1.54e-19 | 9.29e-01 | -0.1526 |
| 29 | ABR | HTA11_696_2000001011 | Human | Colorectum | AD | 8.32e-16 | 8.81e-01 | -0.1464 |
| 29 | ABR | HTA11_866_2000001011 | Human | Colorectum | AD | 2.67e-17 | 7.56e-01 | -0.1001 |
| 29 | ABR | HTA11_1391_2000001011 | Human | Colorectum | AD | 7.75e-13 | 1.07e+00 | -0.059 |
| 29 | ABR | HTA11_2992_2000001011 | Human | Colorectum | SER | 2.97e-03 | 3.52e-01 | -0.1706 |
| 29 | ABR | HTA11_546_2000001011 | Human | Colorectum | AD | 1.53e-16 | 1.31e+00 | -0.0842 |
| 29 | ABR | HTA11_9341_2000001011 | Human | Colorectum | SER | 1.22e-11 | 7.24e-01 | -0.00410000000000005 |
| 29 | ABR | HTA11_7862_2000001011 | Human | Colorectum | AD | 9.44e-05 | 4.69e-01 | -0.0179 |
| 29 | ABR | HTA11_4255_2000001011 | Human | Colorectum | SER | 5.61e-16 | 7.28e-01 | 0.0446 |
| 29 | ABR | HTA11_9408_2000001011 | Human | Colorectum | AD | 9.03e-07 | 7.17e-01 | 0.0451 |
| 29 | ABR | HTA11_8622_2000001021 | Human | Colorectum | SER | 6.78e-13 | 8.45e-01 | 0.0528 |
| 29 | ABR | HTA11_7663_2000001011 | Human | Colorectum | SER | 1.65e-14 | 1.02e+00 | 0.0131 |
| 29 | ABR | HTA11_10623_2000001011 | Human | Colorectum | AD | 1.30e-22 | 1.22e+00 | -0.0177 |
| 29 | ABR | HTA11_10711_2000001011 | Human | Colorectum | AD | 4.53e-25 | 1.12e+00 | 0.0338 |
| 29 | ABR | HTA11_7696_3000711011 | Human | Colorectum | AD | 7.85e-29 | 1.15e+00 | 0.0674 |
| Page: 1 2 3 4 5 6 7 |
| Tissue | Expression Dynamics | Abbreviation |
| Colorectum (GSE201348) |  | FAP: Familial adenomatous polyposis |
| CRC: Colorectal cancer | ||
| Colorectum (HTA11) |  | AD: Adenomas |
| SER: Sessile serrated lesions | ||
| MSI-H: Microsatellite-high colorectal cancer | ||
| MSS: Microsatellite stable colorectal cancer | ||
| Endometrium | 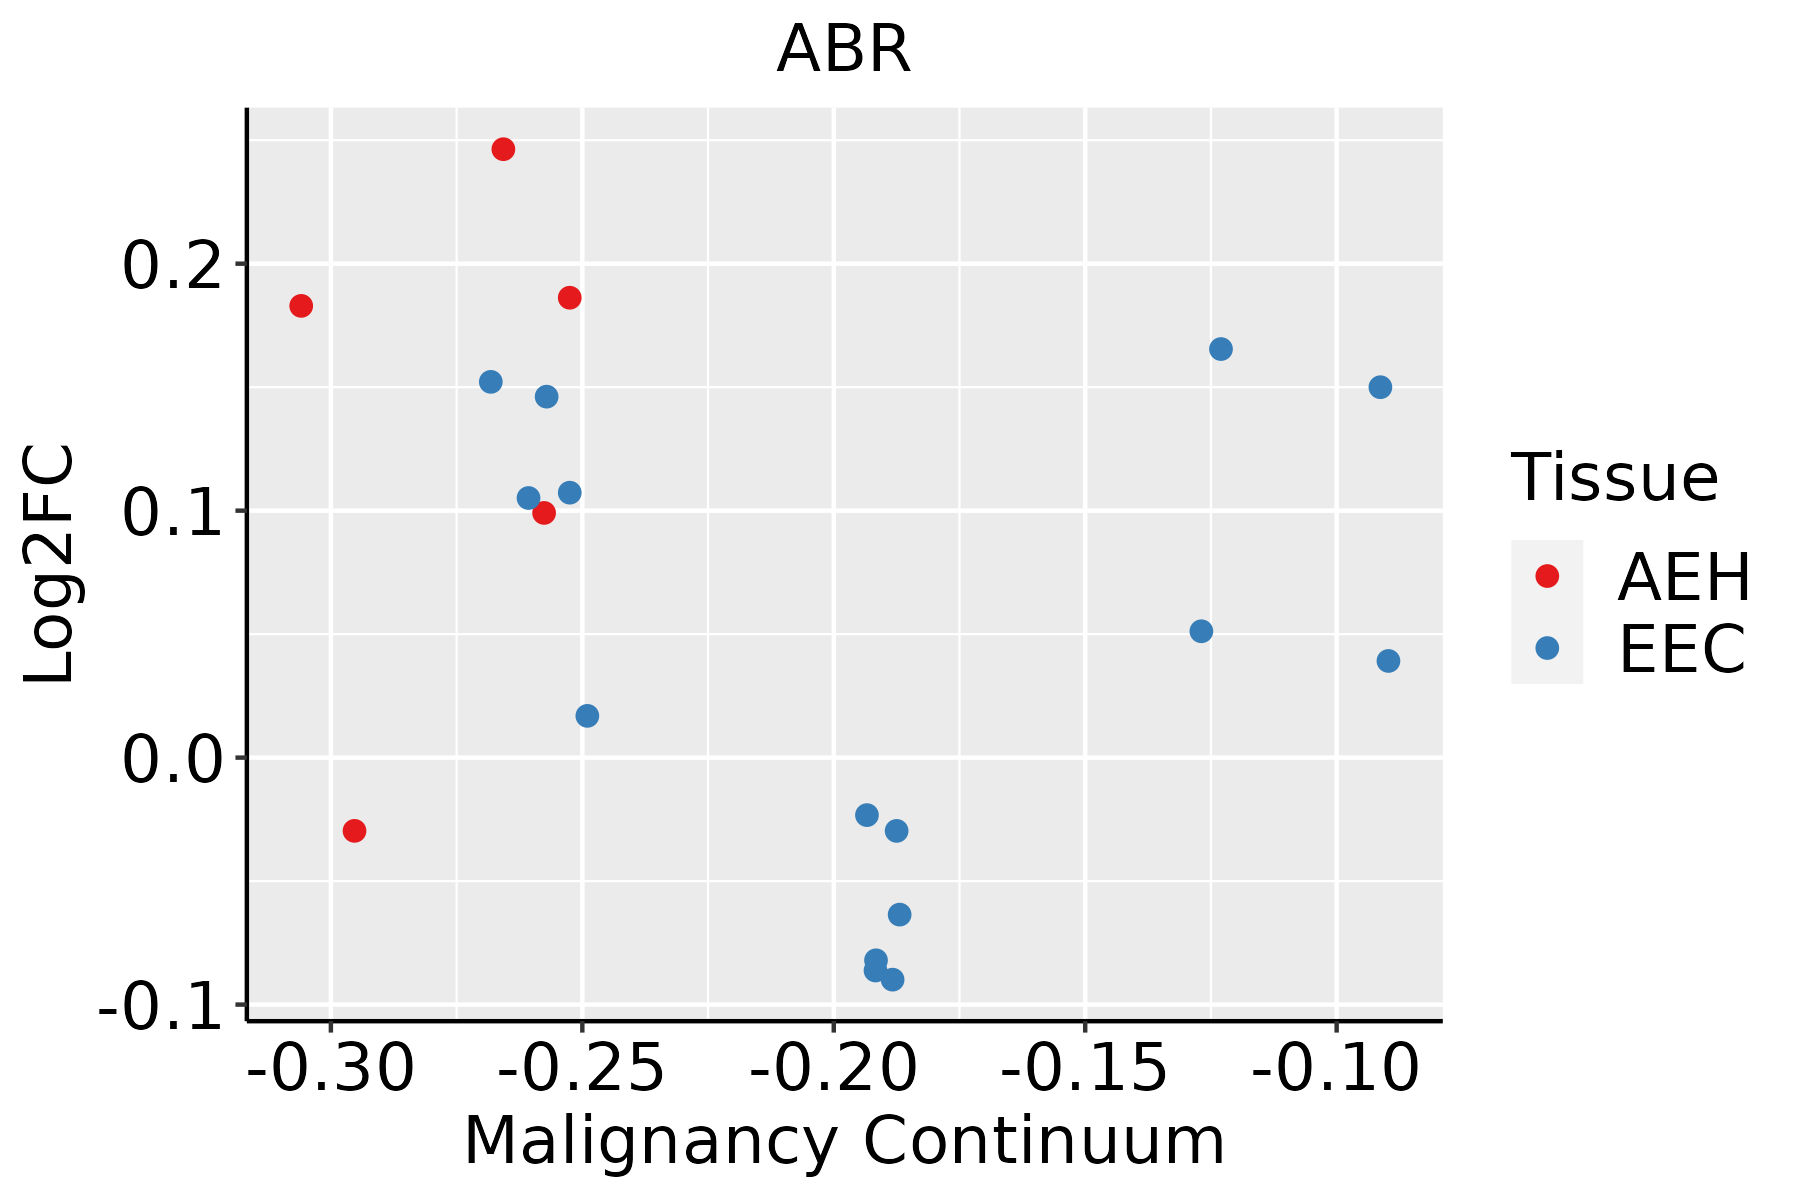 | AEH: Atypical endometrial hyperplasia |
| EEC: Endometrioid Cancer | ||
| Esophagus |  | ESCC: Esophageal squamous cell carcinoma |
| HGIN: High-grade intraepithelial neoplasias | ||
| LGIN: Low-grade intraepithelial neoplasias | ||
| Lung | 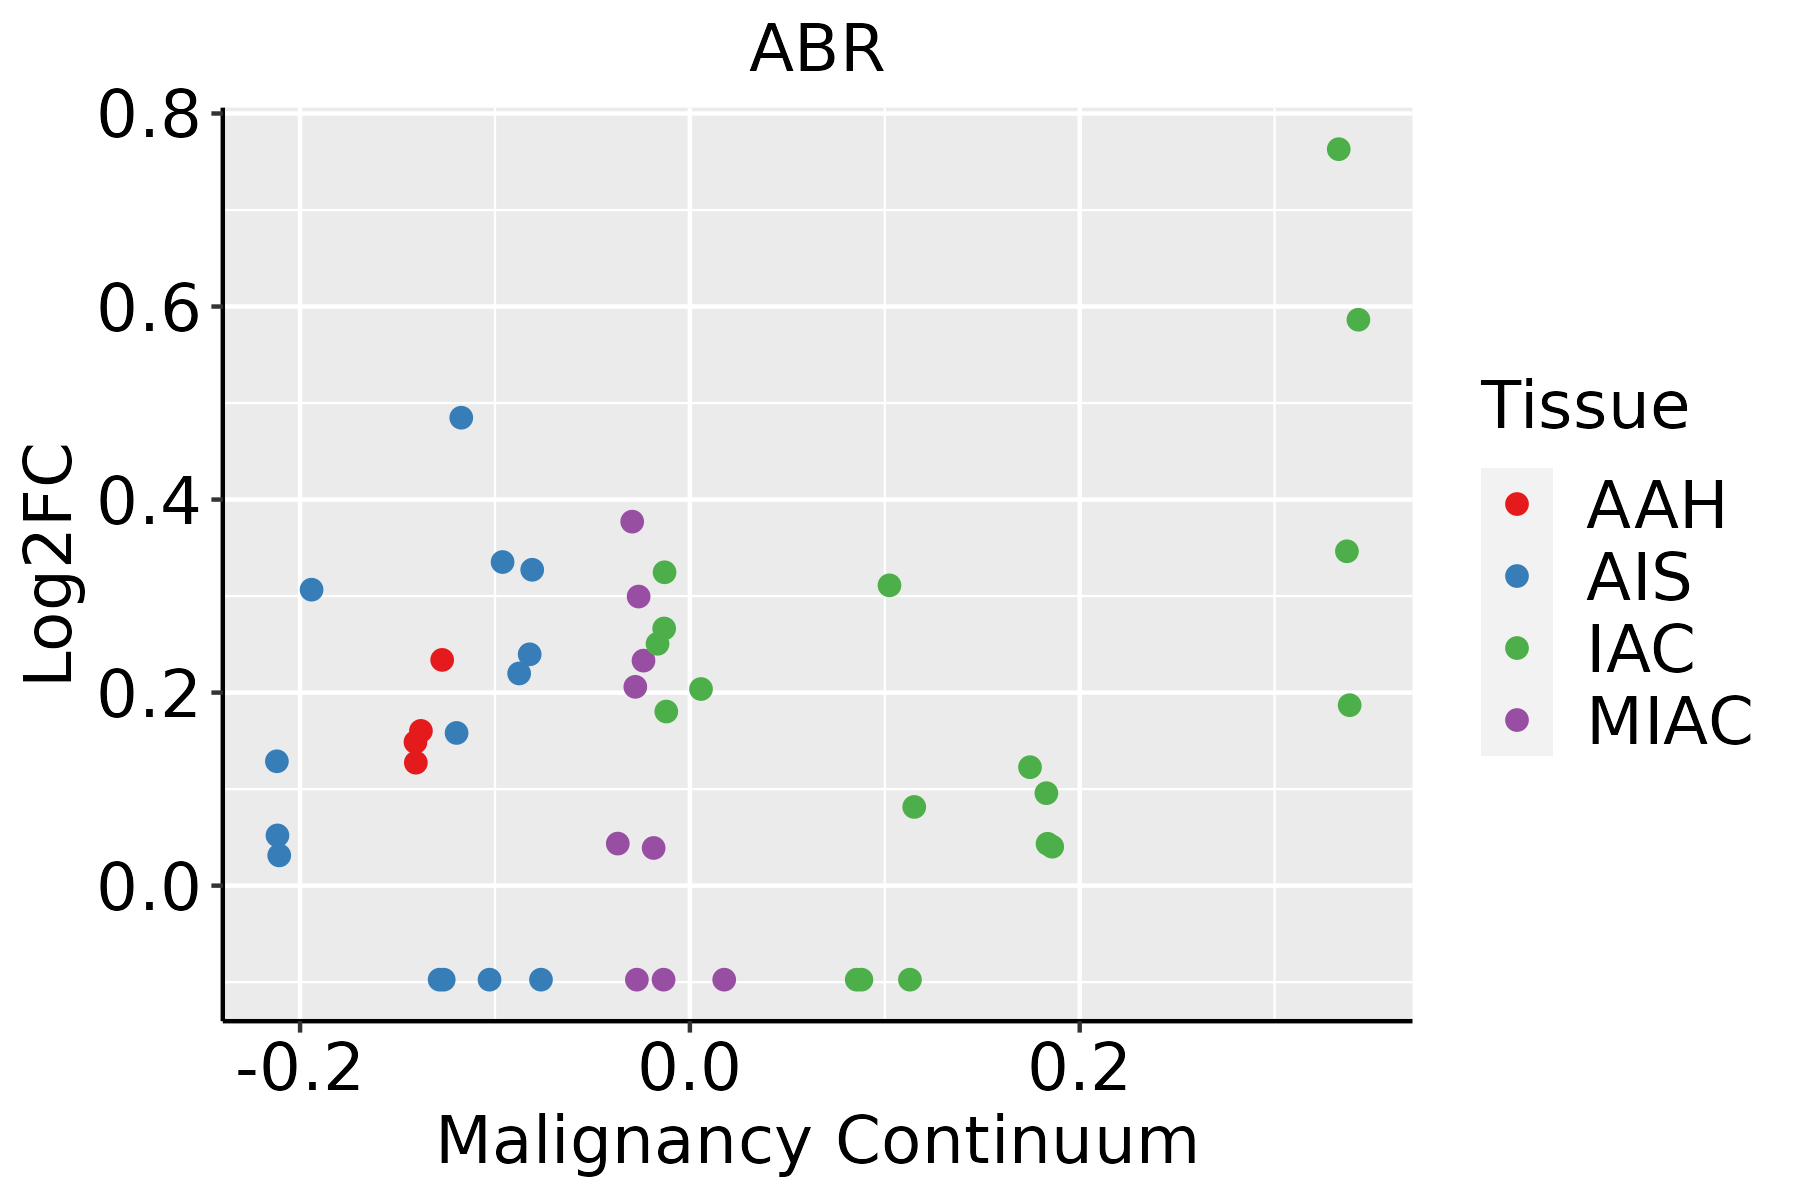 | AAH: Atypical adenomatous hyperplasia |
| AIS: Adenocarcinoma in situ | ||
| IAC: Invasive lung adenocarcinoma | ||
| MIA: Minimally invasive adenocarcinoma | ||
| Prostate | 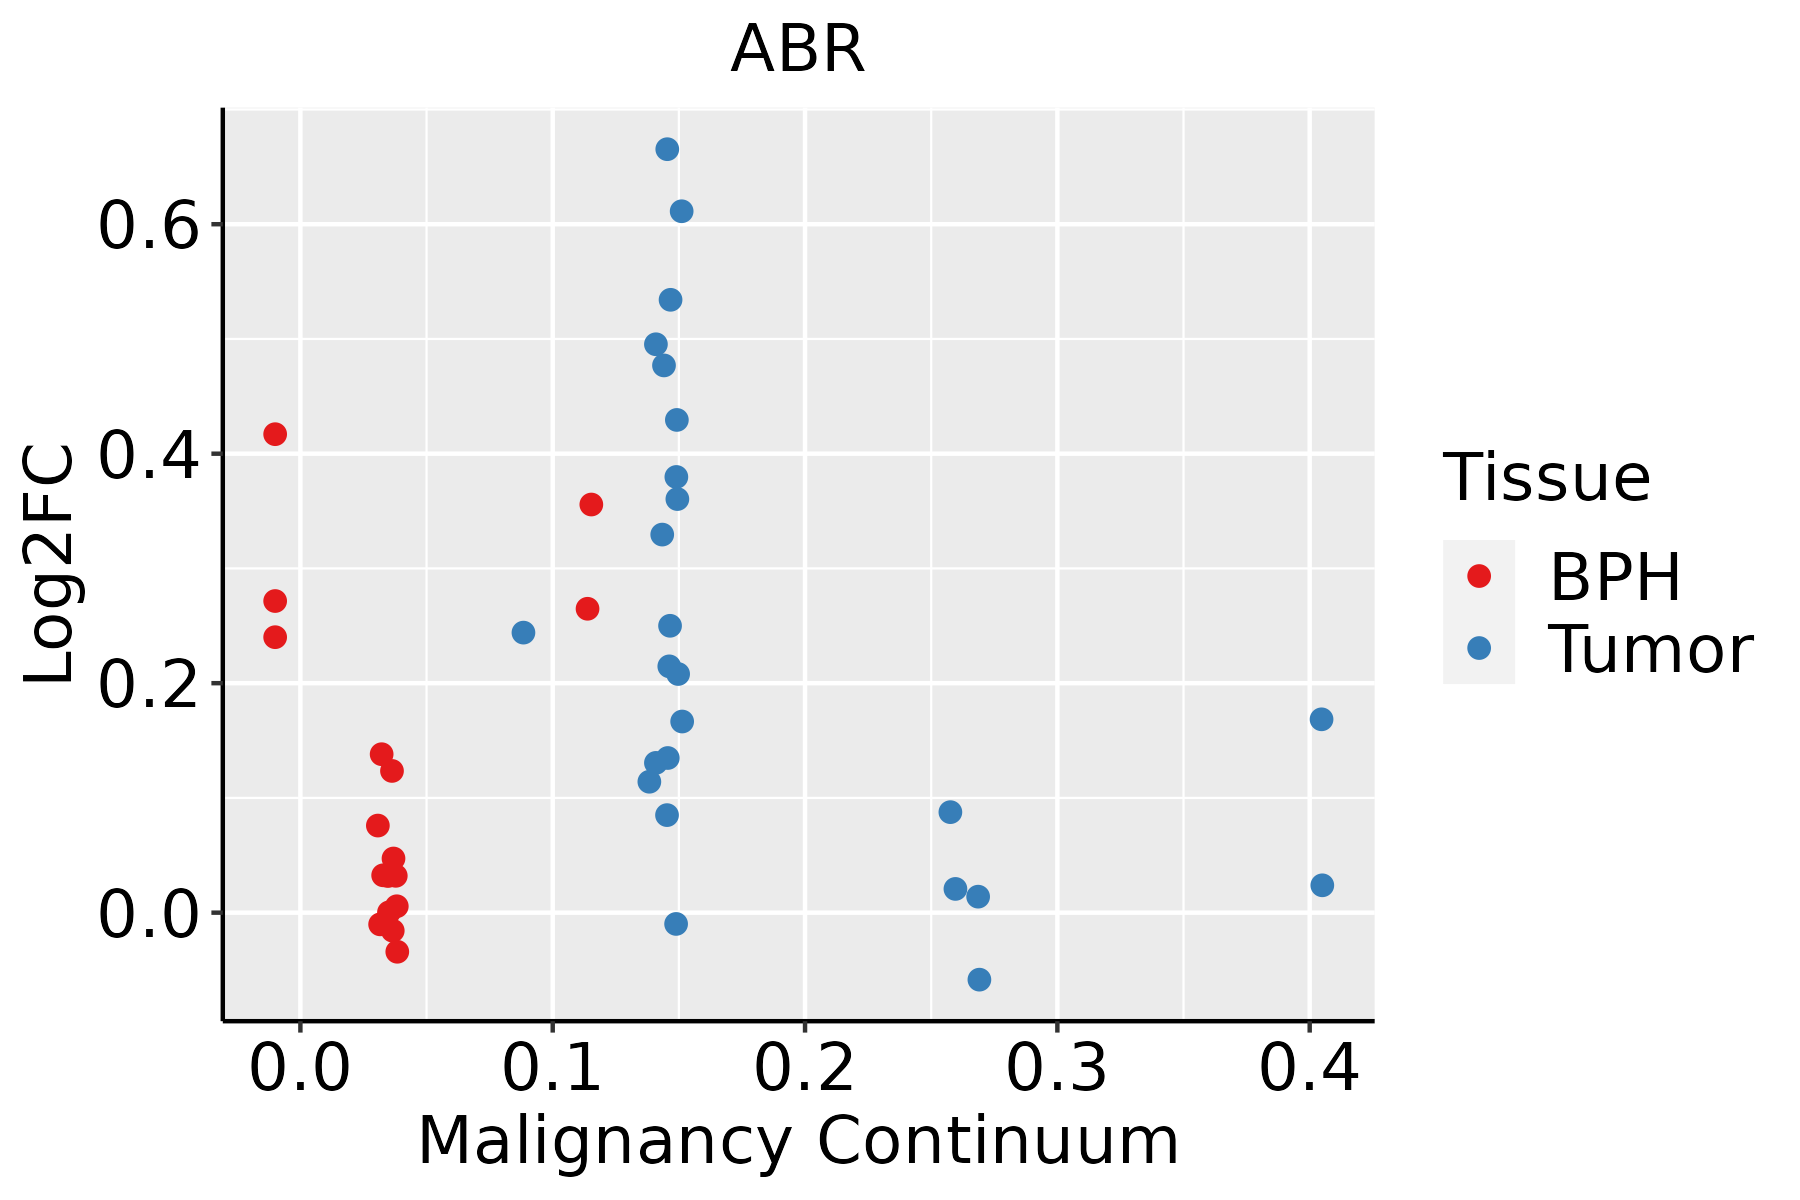 | BPH: Benign Prostatic Hyperplasia |
| ∗log2FC in expression of this searched gene in stem-like cells from each diseased tissue sample relative to stem-like cells in normal samples in each tissue plotted against the malignancy continuum. Samples are colored based on if they are from different disease stage. |
Top |
Malignant transformation related pathway analysis |
| Find out the enriched GO biological processes and KEGG pathways involved in transition from healthy to precancer to cancer |
| Tissue | Disease Stage | Enriched GO biological Processes |
| Colorectum | AD |  |
| Colorectum | SER |  |
| Colorectum | MSS |  |
| Colorectum | MSI-H |  |
| Colorectum | FAP |  |
| ∗Top 15 enriched GO BP terms are showed in the bar plot of each disease state in each tissue. Each row represents a significant GO biological process which is colored according to the -log10(p.adjust). |
| Page: 1 2 3 4 5 6 7 8 9 |
| GO ID | Tissue | Disease Stage | Description | Gene Ratio | Bg Ratio | pvalue | p.adjust | Count |
| GO:00329709 | Breast | Precancer | regulation of actin filament-based process | 42/1080 | 397/18723 | 1.11e-04 | 2.01e-03 | 42 |
| GO:003297014 | Breast | IDC | regulation of actin filament-based process | 56/1434 | 397/18723 | 6.37e-06 | 1.99e-04 | 56 |
| GO:00423912 | Breast | IDC | regulation of membrane potential | 49/1434 | 434/18723 | 4.04e-03 | 3.25e-02 | 49 |
| GO:003297024 | Breast | DCIS | regulation of actin filament-based process | 56/1390 | 397/18723 | 2.50e-06 | 8.74e-05 | 56 |
| GO:00423911 | Breast | DCIS | regulation of membrane potential | 47/1390 | 434/18723 | 5.87e-03 | 4.20e-02 | 47 |
| GO:0032970 | Colorectum | AD | regulation of actin filament-based process | 142/3918 | 397/18723 | 4.05e-12 | 5.90e-10 | 142 |
| GO:0034329 | Colorectum | AD | cell junction assembly | 136/3918 | 420/18723 | 2.02e-08 | 1.15e-06 | 136 |
| GO:0009636 | Colorectum | AD | response to toxic substance | 88/3918 | 262/18723 | 1.12e-06 | 3.72e-05 | 88 |
| GO:0043087 | Colorectum | AD | regulation of GTPase activity | 110/3918 | 348/18723 | 1.64e-06 | 5.03e-05 | 110 |
| GO:0048511 | Colorectum | AD | rhythmic process | 94/3918 | 298/18723 | 1.00e-05 | 2.34e-04 | 94 |
| GO:0048545 | Colorectum | AD | response to steroid hormone | 104/3918 | 339/18723 | 1.33e-05 | 2.90e-04 | 104 |
| GO:0051056 | Colorectum | AD | regulation of small GTPase mediated signal transduction | 94/3918 | 302/18723 | 1.81e-05 | 3.76e-04 | 94 |
| GO:0043547 | Colorectum | AD | positive regulation of GTPase activity | 75/3918 | 255/18723 | 7.95e-04 | 7.91e-03 | 75 |
| GO:1901654 | Colorectum | AD | response to ketone | 59/3918 | 194/18723 | 1.14e-03 | 1.04e-02 | 59 |
| GO:0050808 | Colorectum | AD | synapse organization | 112/3918 | 426/18723 | 4.25e-03 | 2.92e-02 | 112 |
| GO:0015698 | Colorectum | AD | inorganic anion transport | 52/3918 | 180/18723 | 6.83e-03 | 4.22e-02 | 52 |
| GO:00096361 | Colorectum | SER | response to toxic substance | 71/2897 | 262/18723 | 8.63e-07 | 4.07e-05 | 71 |
| GO:00485451 | Colorectum | SER | response to steroid hormone | 80/2897 | 339/18723 | 5.15e-05 | 1.25e-03 | 80 |
| GO:00430871 | Colorectum | SER | regulation of GTPase activity | 77/2897 | 348/18723 | 5.90e-04 | 8.07e-03 | 77 |
| GO:00485111 | Colorectum | SER | rhythmic process | 65/2897 | 298/18723 | 2.18e-03 | 2.11e-02 | 65 |
| Page: 1 2 3 4 5 6 |
| Pathway ID | Tissue | Disease Stage | Description | Gene Ratio | Bg Ratio | pvalue | p.adjust | qvalue | Count |
| Page: 1 |
Top |
Cell-cell communication analysis |
| Identification of potential cell-cell interactions between two cell types and their ligand-receptor pairs for different disease states |
| Ligand | Receptor | LRpair | Pathway | Tissue | Disease Stage |
| Page: 1 |
Top |
Single-cell gene regulatory network inference analysis |
| Find out the significant the regulons (TFs) and the target genes of each regulon across cell types for different disease states |
| TF | Cell Type | Tissue | Disease Stage | Target Gene | RSS | Regulon Activity |
| ∗The dot plots of a searched regulon are shown for all cell subpopulations in each disease state of each tissue based on the regulon specific score inferred using pySCENIC and by calculating the average expression. |
| Page: 1 |
Top |
Somatic mutation of malignant transformation related genes |
| Annotation of somatic variants for genes involved in malignant transformation |
| Hugo Symbol | Variant Class | Variant Classification | dbSNP RS | HGVSc | HGVSp | HGVSp Short | SWISSPROT | BIOTYPE | SIFT | PolyPhen | Tumor Sample Barcode | Tissue | Histology | Sex | Age | Stage | Therapy Types | Drugs | Outcome |
| ABR | SNV | Missense_Mutation | c.1535C>T | p.Ser512Phe | p.S512F | Q12979 | protein_coding | deleterious(0.04) | probably_damaging(0.996) | TCGA-A8-A09G-01 | Breast | breast invasive carcinoma | Female | >=65 | III/IV | Unknown | Unknown | SD | |
| ABR | SNV | Missense_Mutation | c.1535N>G | p.Ser512Cys | p.S512C | Q12979 | protein_coding | deleterious(0) | probably_damaging(0.996) | TCGA-AC-A23H-01 | Breast | breast invasive carcinoma | Female | >=65 | I/II | Unknown | Unknown | PD | |
| ABR | SNV | Missense_Mutation | c.1650N>T | p.Lys550Asn | p.K550N | Q12979 | protein_coding | tolerated(0.97) | benign(0.005) | TCGA-AN-A0FT-01 | Breast | breast invasive carcinoma | Female | <65 | I/II | Unknown | Unknown | SD | |
| ABR | SNV | Missense_Mutation | c.370N>A | p.Ala124Thr | p.A124T | Q12979 | protein_coding | deleterious(0) | possibly_damaging(0.763) | TCGA-AN-A0FV-01 | Breast | breast invasive carcinoma | Female | <65 | I/II | Unknown | Unknown | SD | |
| ABR | SNV | Missense_Mutation | c.2482A>T | p.Met828Leu | p.M828L | Q12979 | protein_coding | tolerated(0.14) | benign(0.074) | TCGA-D8-A1XK-01 | Breast | breast invasive carcinoma | Female | <65 | I/II | Chemotherapy | doxorubicine+cyclophosphamide | SD | |
| ABR | SNV | Missense_Mutation | novel | c.85N>C | p.Tyr29His | p.Y29H | Q12979 | protein_coding | deleterious_low_confidence(0.01) | possibly_damaging(0.797) | TCGA-D8-A1XQ-01 | Breast | breast invasive carcinoma | Female | >=65 | I/II | Unknown | Unknown | SD |
| ABR | deletion | Frame_Shift_Del | novel | c.555delN | p.Ala186ArgfsTer32 | p.A186Rfs*32 | Q12979 | protein_coding | TCGA-D8-A27V-01 | Breast | breast invasive carcinoma | Female | <65 | I/II | Hormone Therapy | tamoxiphen | SD | ||
| ABR | SNV | Missense_Mutation | novel | c.1076N>T | p.Ser359Phe | p.S359F | Q12979 | protein_coding | tolerated(0.17) | possibly_damaging(0.601) | TCGA-2W-A8YY-01 | Cervix | cervical & endocervical cancer | Female | <65 | I/II | Chemotherapy | cisplatin | CR |
| ABR | SNV | Missense_Mutation | c.1742N>C | p.Lys581Thr | p.K581T | Q12979 | protein_coding | deleterious(0.01) | possibly_damaging(0.719) | TCGA-BI-A0VS-01 | Cervix | cervical & endocervical cancer | Female | <65 | I/II | Unknown | Unknown | SD | |
| ABR | SNV | Missense_Mutation | c.2051N>G | p.Ile684Arg | p.I684R | Q12979 | protein_coding | deleterious(0) | possibly_damaging(0.616) | TCGA-FU-A3HZ-01 | Cervix | cervical & endocervical cancer | Female | <65 | I/II | Chemotherapy | cisplatin | CR |
| Page: 1 2 3 4 5 6 7 8 9 10 11 |
Top |
Related drugs of malignant transformation related genes |
| Identification of chemicals and drugs interact with genes involved in malignant transfromation |
| (DGIdb 4.0) |
| Entrez ID | Symbol | Category | Interaction Types | Drug Claim Name | Drug Name | PMIDs |
| Page: 1 |

Copyright 2023-Present -The University of Texas Health Science Center at Houston |