
|
|||||
|
 | |
| |
| |
| |
| |
| |
|
Gene: ABO |
Gene summary for ABO |
| Gene information | Species | Human | Gene symbol | ABO | Gene ID | 28 |
| Gene name | ABO, alpha 1-3-N-acetylgalactosaminyltransferase and alpha 1-3-galactosyltransferase | |
| Gene Alias | A3GALNT | |
| Cytomap | 9q34.2 | |
| Gene Type | protein-coding | GO ID | GO:0005975 | UniProtAcc | A0A089QDC1 |
Top |
Malignant transformation analysis |
| Identification of the aberrant gene expression in precancerous and cancerous lesions by comparing the gene expression of stem-like cells in diseased tissues with normal stem cells |
| Entrez ID | Symbol | Replicates | Species | Organ | Tissue | Adj P-value | Log2FC | Malignancy |
| 28 | ABO | CCI_1 | Human | Cervix | CC | 2.11e-05 | 6.27e-01 | 0.528 |
| 28 | ABO | CCI_2 | Human | Cervix | CC | 1.78e-16 | 1.15e+00 | 0.5249 |
| 28 | ABO | CCI_3 | Human | Cervix | CC | 1.48e-09 | 6.38e-01 | 0.516 |
| 28 | ABO | HTA11_3410_2000001011 | Human | Colorectum | AD | 1.54e-05 | -3.17e-01 | 0.0155 |
| 28 | ABO | HTA11_347_2000001011 | Human | Colorectum | AD | 8.33e-17 | 7.48e-01 | -0.1954 |
| 28 | ABO | HTA11_2112_2000001011 | Human | Colorectum | SER | 4.22e-03 | -4.12e-01 | -0.2196 |
| 28 | ABO | HTA11_1391_2000001011 | Human | Colorectum | AD | 3.69e-03 | 5.29e-01 | -0.059 |
| 28 | ABO | HTA11_5212_2000001011 | Human | Colorectum | AD | 2.46e-02 | -4.41e-01 | -0.2061 |
| 28 | ABO | HTA11_99999965062_69753 | Human | Colorectum | MSI-H | 4.43e-03 | 7.65e-01 | 0.3487 |
| 28 | ABO | HTA11_99999973899_84307 | Human | Colorectum | MSS | 1.32e-12 | -8.87e-01 | 0.2585 |
| 28 | ABO | HTA11_99999974143_84620 | Human | Colorectum | MSS | 4.00e-20 | -5.93e-01 | 0.3005 |
| 28 | ABO | F007 | Human | Colorectum | FAP | 3.97e-06 | -5.25e-01 | 0.1176 |
| 28 | ABO | A001-C-207 | Human | Colorectum | FAP | 1.91e-13 | -6.09e-01 | 0.1278 |
| 28 | ABO | A015-C-203 | Human | Colorectum | FAP | 2.97e-43 | -7.66e-01 | -0.1294 |
| 28 | ABO | A015-C-204 | Human | Colorectum | FAP | 3.67e-17 | -6.88e-01 | -0.0228 |
| 28 | ABO | A014-C-040 | Human | Colorectum | FAP | 3.78e-07 | -6.00e-01 | -0.1184 |
| 28 | ABO | A002-C-201 | Human | Colorectum | FAP | 2.95e-23 | -6.58e-01 | 0.0324 |
| 28 | ABO | A002-C-203 | Human | Colorectum | FAP | 4.76e-07 | -3.75e-01 | 0.2786 |
| 28 | ABO | A001-C-119 | Human | Colorectum | FAP | 2.62e-08 | -4.33e-01 | -0.1557 |
| 28 | ABO | A001-C-108 | Human | Colorectum | FAP | 1.02e-21 | -5.40e-01 | -0.0272 |
| Page: 1 2 3 4 5 |
| Tissue | Expression Dynamics | Abbreviation |
| Cervix |  | CC: Cervix cancer |
| HSIL_HPV: HPV-infected high-grade squamous intraepithelial lesions | ||
| N_HPV: HPV-infected normal cervix | ||
| Colorectum (GSE201348) |  | FAP: Familial adenomatous polyposis |
| CRC: Colorectal cancer | ||
| Colorectum (HTA11) |  | AD: Adenomas |
| SER: Sessile serrated lesions | ||
| MSI-H: Microsatellite-high colorectal cancer | ||
| MSS: Microsatellite stable colorectal cancer | ||
| Esophagus | 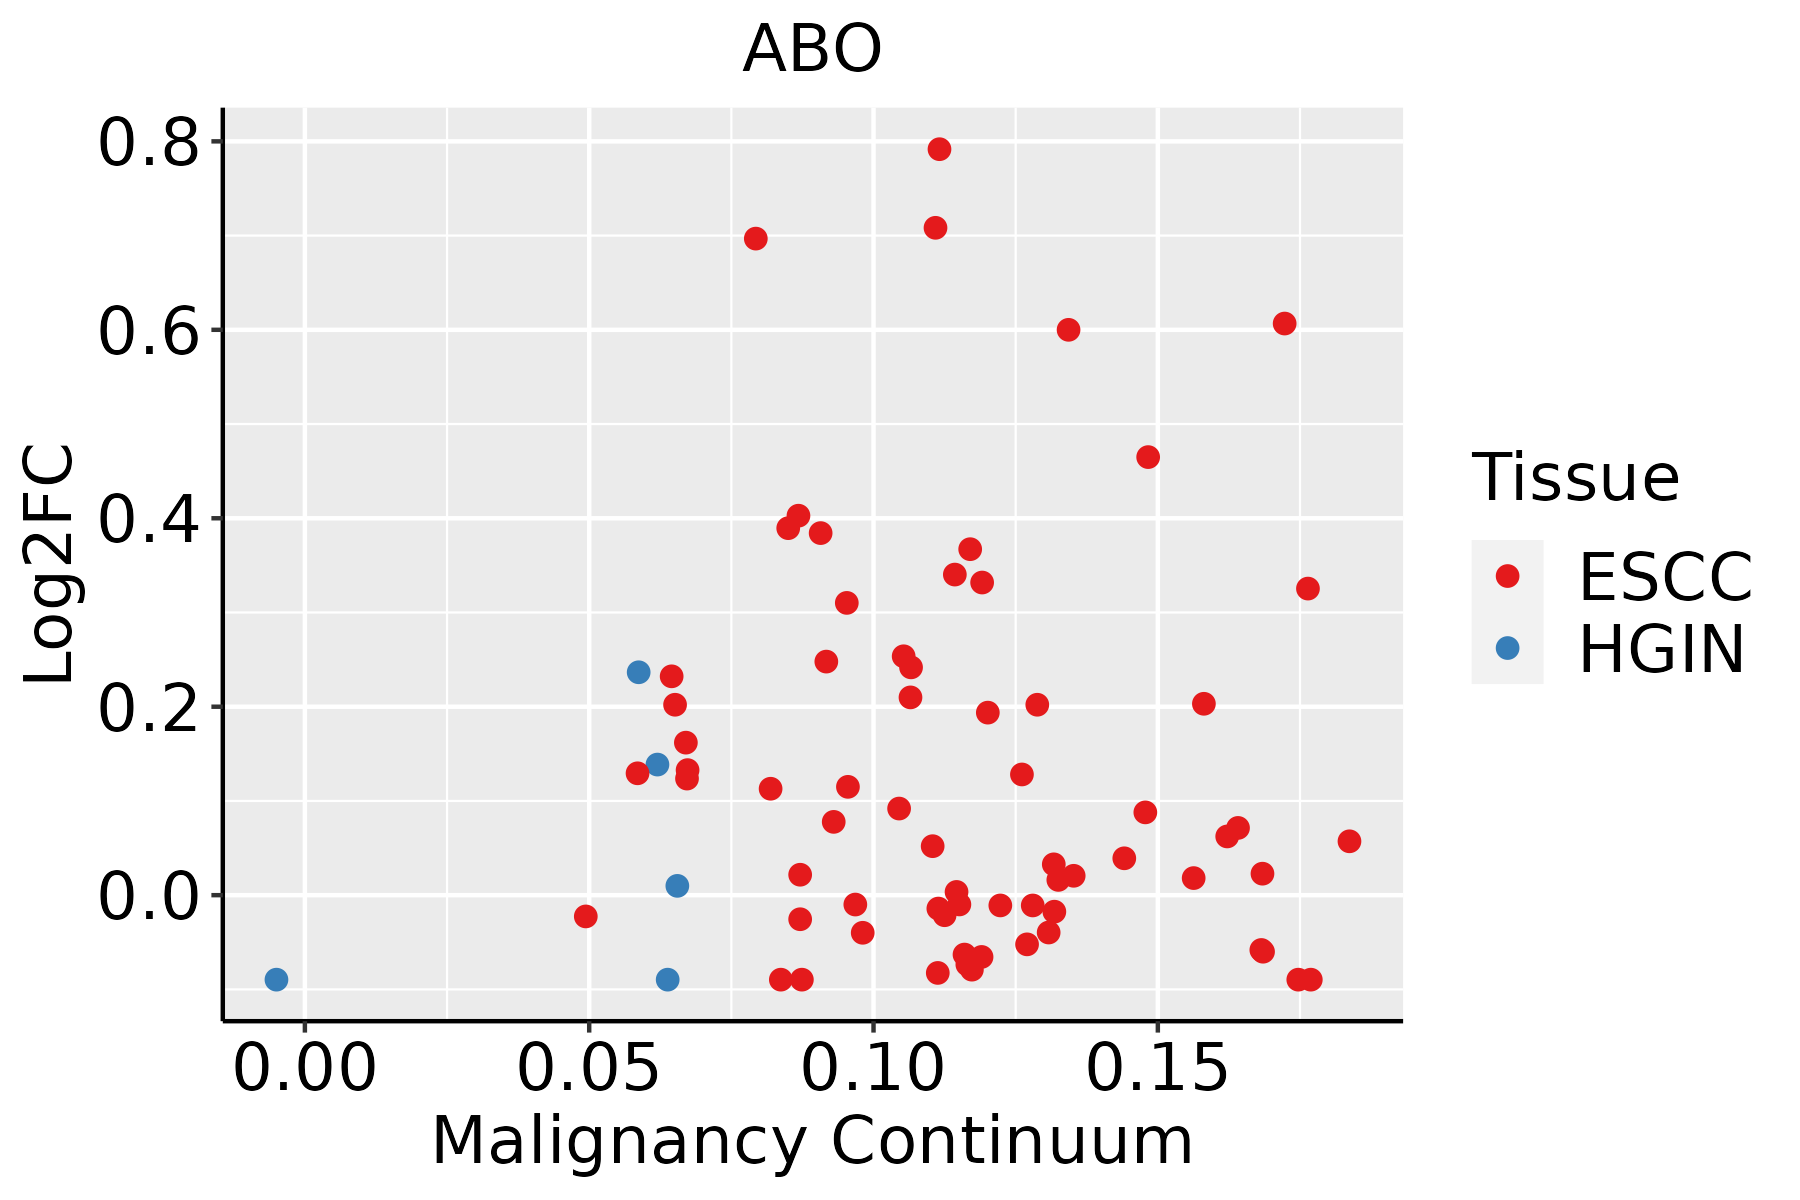 | ESCC: Esophageal squamous cell carcinoma |
| HGIN: High-grade intraepithelial neoplasias | ||
| LGIN: Low-grade intraepithelial neoplasias | ||
| Oral Cavity | 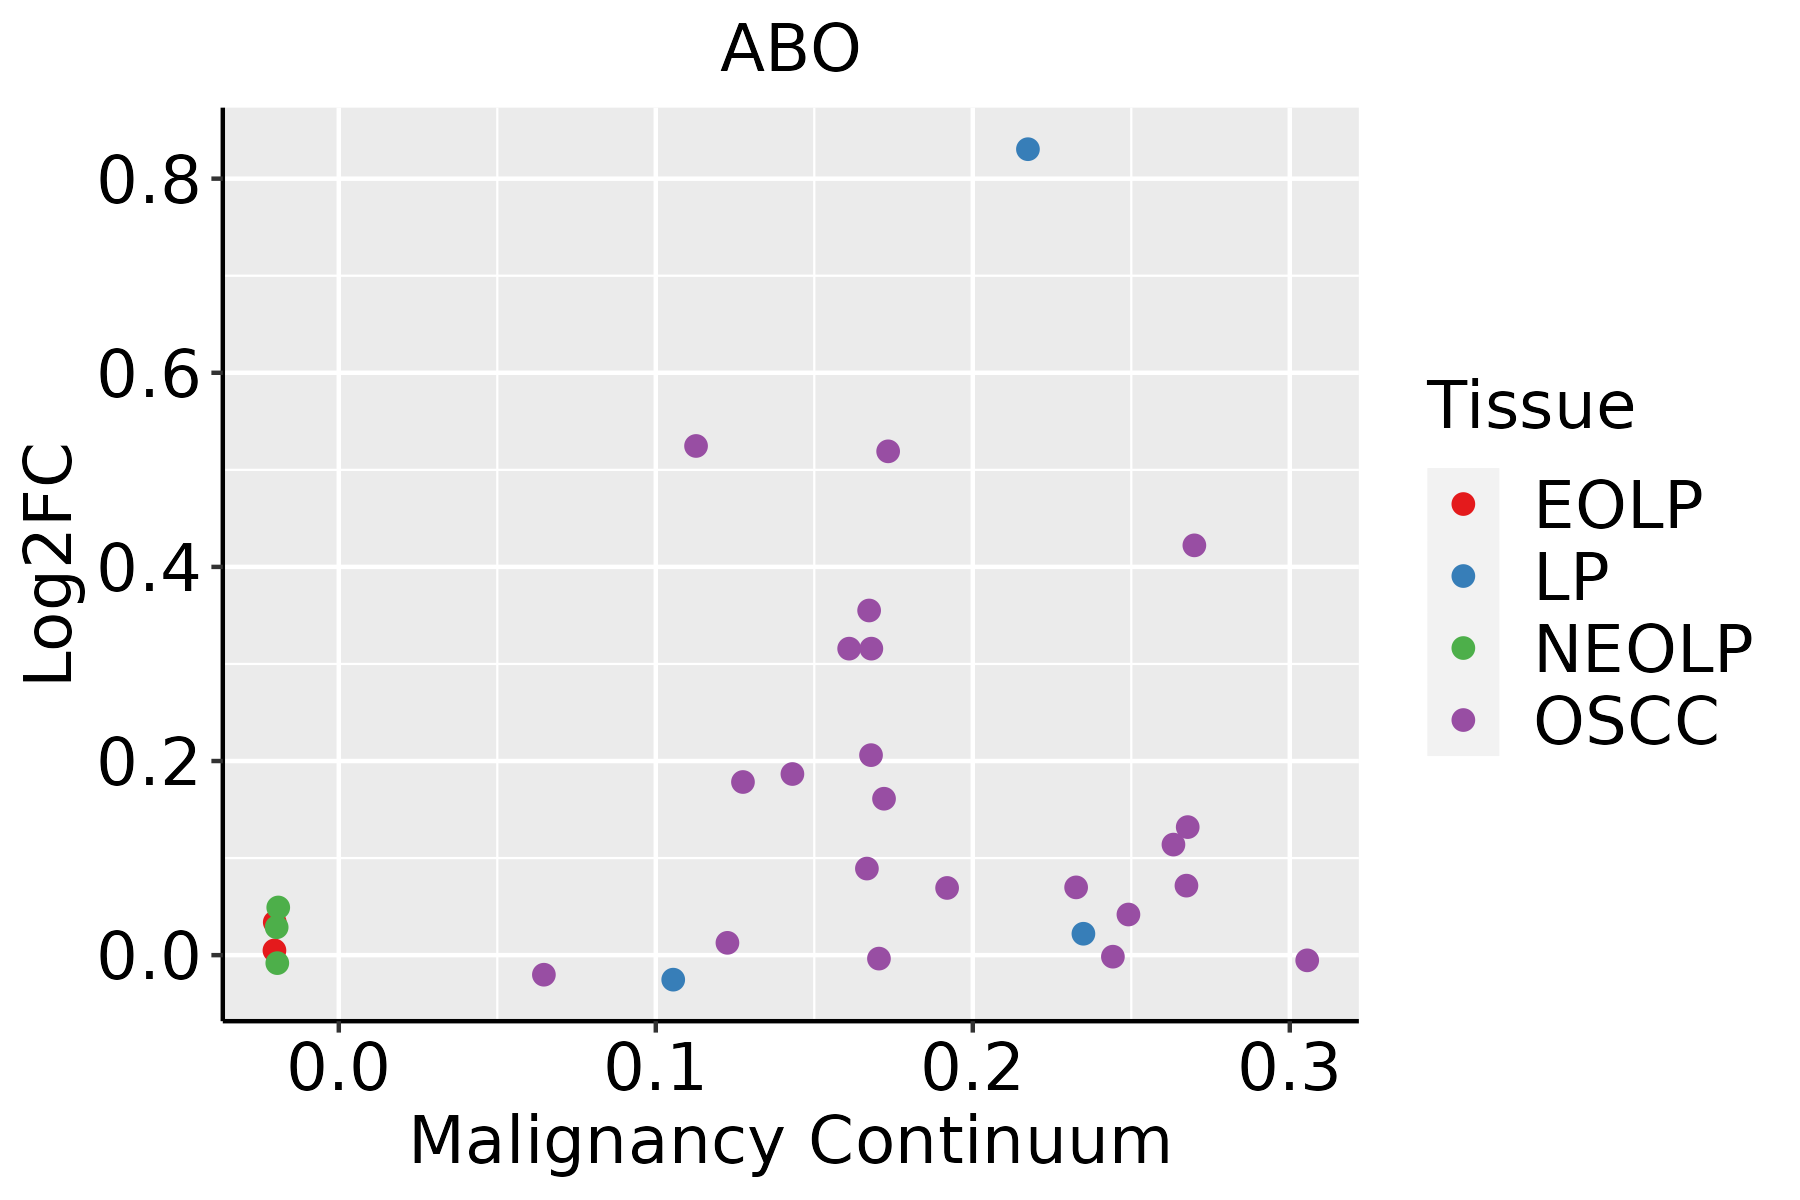 | EOLP: Erosive Oral lichen planus |
| LP: leukoplakia | ||
| NEOLP: Non-erosive oral lichen planus | ||
| OSCC: Oral squamous cell carcinoma |
| ∗log2FC in expression of this searched gene in stem-like cells from each diseased tissue sample relative to stem-like cells in normal samples in each tissue plotted against the malignancy continuum. Samples are colored based on if they are from different disease stage. |
Top |
Malignant transformation related pathway analysis |
| Find out the enriched GO biological processes and KEGG pathways involved in transition from healthy to precancer to cancer |
| Tissue | Disease Stage | Enriched GO biological Processes |
| Colorectum | AD |  |
| Colorectum | SER |  |
| Colorectum | MSS |  |
| Colorectum | MSI-H |  |
| Colorectum | FAP |  |
| ∗Top 15 enriched GO BP terms are showed in the bar plot of each disease state in each tissue. Each row represents a significant GO biological process which is colored according to the -log10(p.adjust). |
| Page: 1 2 3 4 5 6 7 8 9 |
| GO ID | Tissue | Disease Stage | Description | Gene Ratio | Bg Ratio | pvalue | p.adjust | Count |
| GO:0030258 | Colorectum | AD | lipid modification | 67/3918 | 212/18723 | 1.66e-04 | 2.27e-03 | 67 |
| GO:0006486 | Colorectum | AD | protein glycosylation | 64/3918 | 226/18723 | 4.86e-03 | 3.27e-02 | 64 |
| GO:0043413 | Colorectum | AD | macromolecule glycosylation | 64/3918 | 226/18723 | 4.86e-03 | 3.27e-02 | 64 |
| GO:0070085 | Colorectum | AD | glycosylation | 67/3918 | 240/18723 | 5.78e-03 | 3.67e-02 | 67 |
| GO:00302581 | Colorectum | SER | lipid modification | 47/2897 | 212/18723 | 6.01e-03 | 4.38e-02 | 47 |
| GO:00302582 | Colorectum | MSS | lipid modification | 57/3467 | 212/18723 | 1.64e-03 | 1.49e-02 | 57 |
| GO:00302583 | Colorectum | FAP | lipid modification | 52/2622 | 212/18723 | 2.84e-05 | 6.49e-04 | 52 |
| GO:00064861 | Colorectum | FAP | protein glycosylation | 48/2622 | 226/18723 | 1.85e-03 | 1.57e-02 | 48 |
| GO:00434131 | Colorectum | FAP | macromolecule glycosylation | 48/2622 | 226/18723 | 1.85e-03 | 1.57e-02 | 48 |
| GO:00700851 | Colorectum | FAP | glycosylation | 50/2622 | 240/18723 | 2.30e-03 | 1.85e-02 | 50 |
| GO:0009101 | Colorectum | FAP | glycoprotein biosynthetic process | 63/2622 | 317/18723 | 2.31e-03 | 1.86e-02 | 63 |
| GO:00302584 | Colorectum | CRC | lipid modification | 41/2078 | 212/18723 | 2.73e-04 | 4.38e-03 | 41 |
| GO:00091002 | Esophagus | ESCC | glycoprotein metabolic process | 226/8552 | 387/18723 | 2.64e-07 | 3.94e-06 | 226 |
| GO:00700854 | Esophagus | ESCC | glycosylation | 144/8552 | 240/18723 | 5.12e-06 | 5.38e-05 | 144 |
| GO:00064865 | Esophagus | ESCC | protein glycosylation | 135/8552 | 226/18723 | 1.36e-05 | 1.24e-04 | 135 |
| GO:00434135 | Esophagus | ESCC | macromolecule glycosylation | 135/8552 | 226/18723 | 1.36e-05 | 1.24e-04 | 135 |
| GO:00091012 | Esophagus | ESCC | glycoprotein biosynthetic process | 181/8552 | 317/18723 | 2.54e-05 | 2.15e-04 | 181 |
| GO:00302586 | Esophagus | ESCC | lipid modification | 116/8552 | 212/18723 | 4.90e-03 | 1.89e-02 | 116 |
| GO:00091001 | Oral cavity | OSCC | glycoprotein metabolic process | 185/7305 | 387/18723 | 2.37e-04 | 1.54e-03 | 185 |
| GO:00091011 | Oral cavity | OSCC | glycoprotein biosynthetic process | 151/7305 | 317/18723 | 1.01e-03 | 5.26e-03 | 151 |
| Page: 1 2 |
| Pathway ID | Tissue | Disease Stage | Description | Gene Ratio | Bg Ratio | pvalue | p.adjust | qvalue | Count |
| Page: 1 |
Top |
Cell-cell communication analysis |
| Identification of potential cell-cell interactions between two cell types and their ligand-receptor pairs for different disease states |
| Ligand | Receptor | LRpair | Pathway | Tissue | Disease Stage |
| Page: 1 |
Top |
Single-cell gene regulatory network inference analysis |
| Find out the significant the regulons (TFs) and the target genes of each regulon across cell types for different disease states |
| TF | Cell Type | Tissue | Disease Stage | Target Gene | RSS | Regulon Activity |
| ∗The dot plots of a searched regulon are shown for all cell subpopulations in each disease state of each tissue based on the regulon specific score inferred using pySCENIC and by calculating the average expression. |
| Page: 1 |
Top |
Somatic mutation of malignant transformation related genes |
| Annotation of somatic variants for genes involved in malignant transformation |
| Hugo Symbol | Variant Class | Variant Classification | dbSNP RS | HGVSc | HGVSp | HGVSp Short | SWISSPROT | BIOTYPE | SIFT | PolyPhen | Tumor Sample Barcode | Tissue | Histology | Sex | Age | Stage | Therapy Types | Drugs | Outcome |
| ABO | SNV | Missense_Mutation | novel | c.906N>T | p.Glu302Asp | p.E302D | protein_coding | deleterious(0) | probably_damaging(0.958) | TCGA-AN-A046-01 | Breast | breast invasive carcinoma | Female | >=65 | I/II | Unknown | Unknown | SD | |
| ABO | SNV | Missense_Mutation | rs377147187 | c.434N>A | p.Arg145His | p.R145H | protein_coding | deleterious(0.02) | probably_damaging(0.981) | TCGA-BH-A0E2-01 | Breast | breast invasive carcinoma | Female | <65 | III/IV | Chemotherapy | doxorubicin | SD | |
| ABO | insertion | In_Frame_Ins | novel | c.403_404insAGTACT | p.Thr135delinsLysTyrSer | p.T135delinsKYS | protein_coding | TCGA-A8-A090-01 | Breast | breast invasive carcinoma | Female | >=65 | I/II | Unknown | Unknown | SD | |||
| ABO | SNV | Missense_Mutation | rs370138477 | c.886N>A | p.Glu296Lys | p.E296K | protein_coding | deleterious(0.01) | possibly_damaging(0.686) | TCGA-AA-3864-01 | Colorectum | colon adenocarcinoma | Male | >=65 | I/II | Unknown | Unknown | SD | |
| ABO | SNV | Missense_Mutation | novel | c.362N>A | p.Ala121Asp | p.A121D | protein_coding | deleterious(0) | probably_damaging(0.973) | TCGA-AA-3864-01 | Colorectum | colon adenocarcinoma | Male | >=65 | I/II | Unknown | Unknown | SD | |
| ABO | SNV | Missense_Mutation | novel | c.929N>C | p.Leu310Pro | p.L310P | protein_coding | deleterious(0) | probably_damaging(0.998) | TCGA-AA-3947-01 | Colorectum | colon adenocarcinoma | Female | <65 | I/II | Unknown | Unknown | SD | |
| ABO | SNV | Missense_Mutation | rs866584466 | c.556N>T | p.Arg186Cys | p.R186C | protein_coding | deleterious(0.01) | probably_damaging(0.939) | TCGA-AD-A5EJ-01 | Colorectum | colon adenocarcinoma | Female | >=65 | I/II | Unknown | Unknown | SD | |
| ABO | SNV | Missense_Mutation | rs781789696 | c.868N>A | p.Asp290Asn | p.D290N | protein_coding | deleterious(0.01) | probably_damaging(0.911) | TCGA-AD-A5EK-01 | Colorectum | colon adenocarcinoma | Male | <65 | I/II | Unknown | Unknown | SD | |
| ABO | SNV | Missense_Mutation | novel | c.586N>A | p.Glu196Lys | p.E196K | protein_coding | tolerated(0.41) | benign(0.043) | TCGA-CM-6171-01 | Colorectum | colon adenocarcinoma | Female | >=65 | I/II | Unknown | Unknown | SD | |
| ABO | SNV | Missense_Mutation | novel | c.481N>A | p.Val161Met | p.V161M | protein_coding | tolerated(0.07) | possibly_damaging(0.601) | TCGA-CM-6674-01 | Colorectum | colon adenocarcinoma | Male | <65 | I/II | Unknown | Unknown | SD |
| Page: 1 2 3 4 |
Top |
Related drugs of malignant transformation related genes |
| Identification of chemicals and drugs interact with genes involved in malignant transfromation |
| (DGIdb 4.0) |
| Entrez ID | Symbol | Category | Interaction Types | Drug Claim Name | Drug Name | PMIDs |
| 28 | ABO | NA | Ace Inhibitors, Plain | 21832968 | ||
| 28 | ABO | NA | hormonal contraceptives for systemic use | 28750087 |
| Page: 1 |

Copyright 2023-Present -The University of Texas Health Science Center at Houston |