
|
|||||
|
 | |
| |
| |
| |
| |
| |
|
Gene: ABL2 |
Gene summary for ABL2 |
| Gene information | Species | Human | Gene symbol | ABL2 | Gene ID | 27 |
| Gene name | ABL proto-oncogene 2, non-receptor tyrosine kinase | |
| Gene Alias | ABLL | |
| Cytomap | 1q25.2 | |
| Gene Type | protein-coding | GO ID | GO:0006464 | UniProtAcc | P42684 |
Top |
Malignant transformation analysis |
| Identification of the aberrant gene expression in precancerous and cancerous lesions by comparing the gene expression of stem-like cells in diseased tissues with normal stem cells |
| Entrez ID | Symbol | Replicates | Species | Organ | Tissue | Adj P-value | Log2FC | Malignancy |
| 27 | ABL2 | CCI_2 | Human | Cervix | CC | 1.03e-08 | 9.52e-01 | 0.5249 |
| 27 | ABL2 | CCI_3 | Human | Cervix | CC | 8.30e-08 | 7.76e-01 | 0.516 |
| 27 | ABL2 | T1 | Human | Cervix | CC | 2.05e-02 | 3.01e-01 | 0.0918 |
| 27 | ABL2 | HTA11_3410_2000001011 | Human | Colorectum | AD | 2.77e-15 | -4.39e-01 | 0.0155 |
| 27 | ABL2 | HTA11_866_3004761011 | Human | Colorectum | AD | 4.41e-08 | -4.06e-01 | 0.096 |
| 27 | ABL2 | HTA11_7696_3000711011 | Human | Colorectum | AD | 6.01e-05 | -3.41e-01 | 0.0674 |
| 27 | ABL2 | HTA11_99999970781_79442 | Human | Colorectum | MSS | 2.39e-05 | -3.00e-01 | 0.294 |
| 27 | ABL2 | HTA11_99999974143_84620 | Human | Colorectum | MSS | 7.15e-13 | -4.59e-01 | 0.3005 |
| 27 | ABL2 | F007 | Human | Colorectum | FAP | 1.92e-04 | -3.31e-01 | 0.1176 |
| 27 | ABL2 | A002-C-010 | Human | Colorectum | FAP | 7.57e-03 | -2.15e-01 | 0.242 |
| 27 | ABL2 | A001-C-207 | Human | Colorectum | FAP | 2.08e-09 | -3.72e-01 | 0.1278 |
| 27 | ABL2 | A015-C-203 | Human | Colorectum | FAP | 4.93e-32 | -5.07e-01 | -0.1294 |
| 27 | ABL2 | A015-C-204 | Human | Colorectum | FAP | 6.71e-11 | -3.82e-01 | -0.0228 |
| 27 | ABL2 | A014-C-040 | Human | Colorectum | FAP | 1.46e-03 | -2.71e-01 | -0.1184 |
| 27 | ABL2 | A002-C-201 | Human | Colorectum | FAP | 2.73e-19 | -4.31e-01 | 0.0324 |
| 27 | ABL2 | A002-C-203 | Human | Colorectum | FAP | 8.29e-09 | -2.92e-01 | 0.2786 |
| 27 | ABL2 | A001-C-119 | Human | Colorectum | FAP | 2.16e-06 | -1.87e-01 | -0.1557 |
| 27 | ABL2 | A001-C-108 | Human | Colorectum | FAP | 2.23e-17 | -3.54e-01 | -0.0272 |
| 27 | ABL2 | A002-C-205 | Human | Colorectum | FAP | 1.80e-24 | -4.61e-01 | -0.1236 |
| 27 | ABL2 | A001-C-104 | Human | Colorectum | FAP | 1.98e-06 | -3.33e-01 | 0.0184 |
| Page: 1 2 3 4 5 6 7 8 |
| Tissue | Expression Dynamics | Abbreviation |
| Cervix | 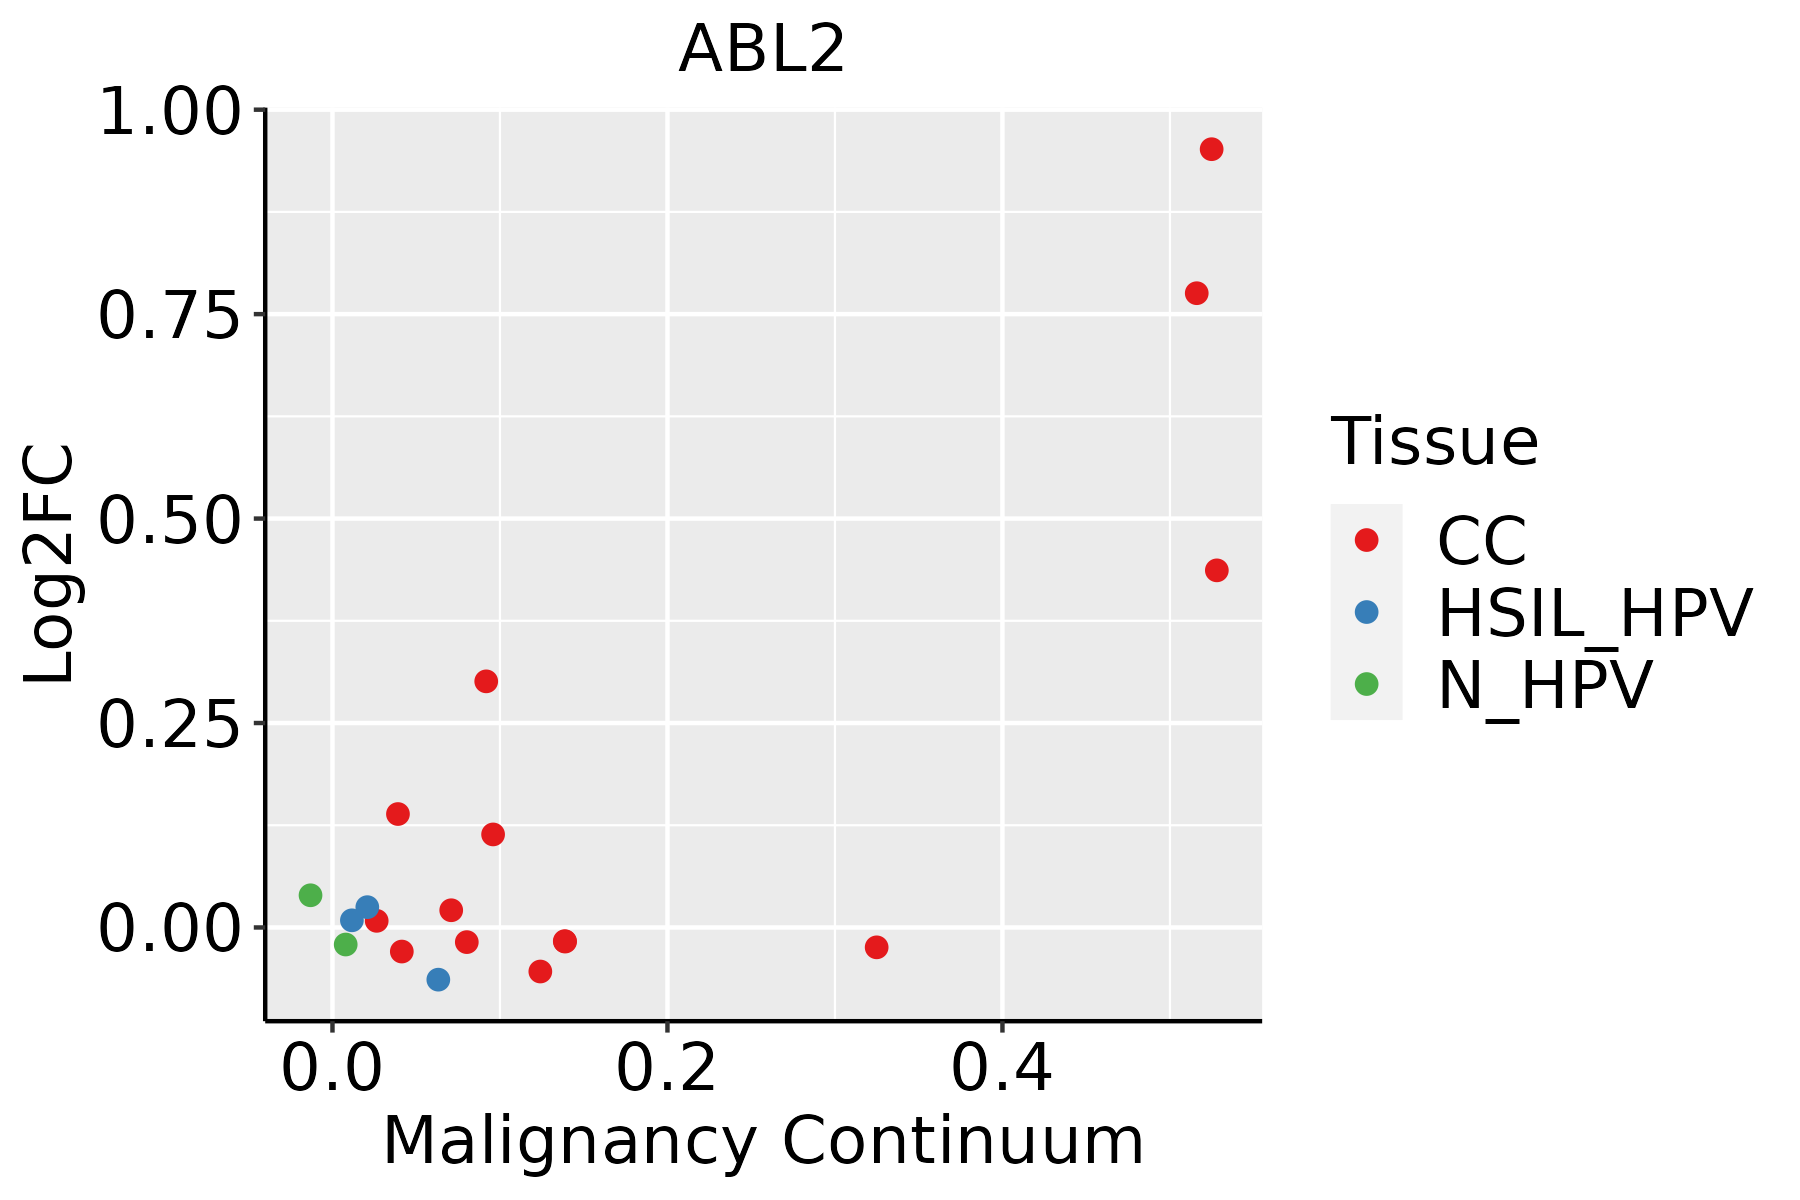 | CC: Cervix cancer |
| HSIL_HPV: HPV-infected high-grade squamous intraepithelial lesions | ||
| N_HPV: HPV-infected normal cervix | ||
| Colorectum (GSE201348) |  | FAP: Familial adenomatous polyposis |
| CRC: Colorectal cancer | ||
| Colorectum (HTA11) |  | AD: Adenomas |
| SER: Sessile serrated lesions | ||
| MSI-H: Microsatellite-high colorectal cancer | ||
| MSS: Microsatellite stable colorectal cancer | ||
| Endometrium | 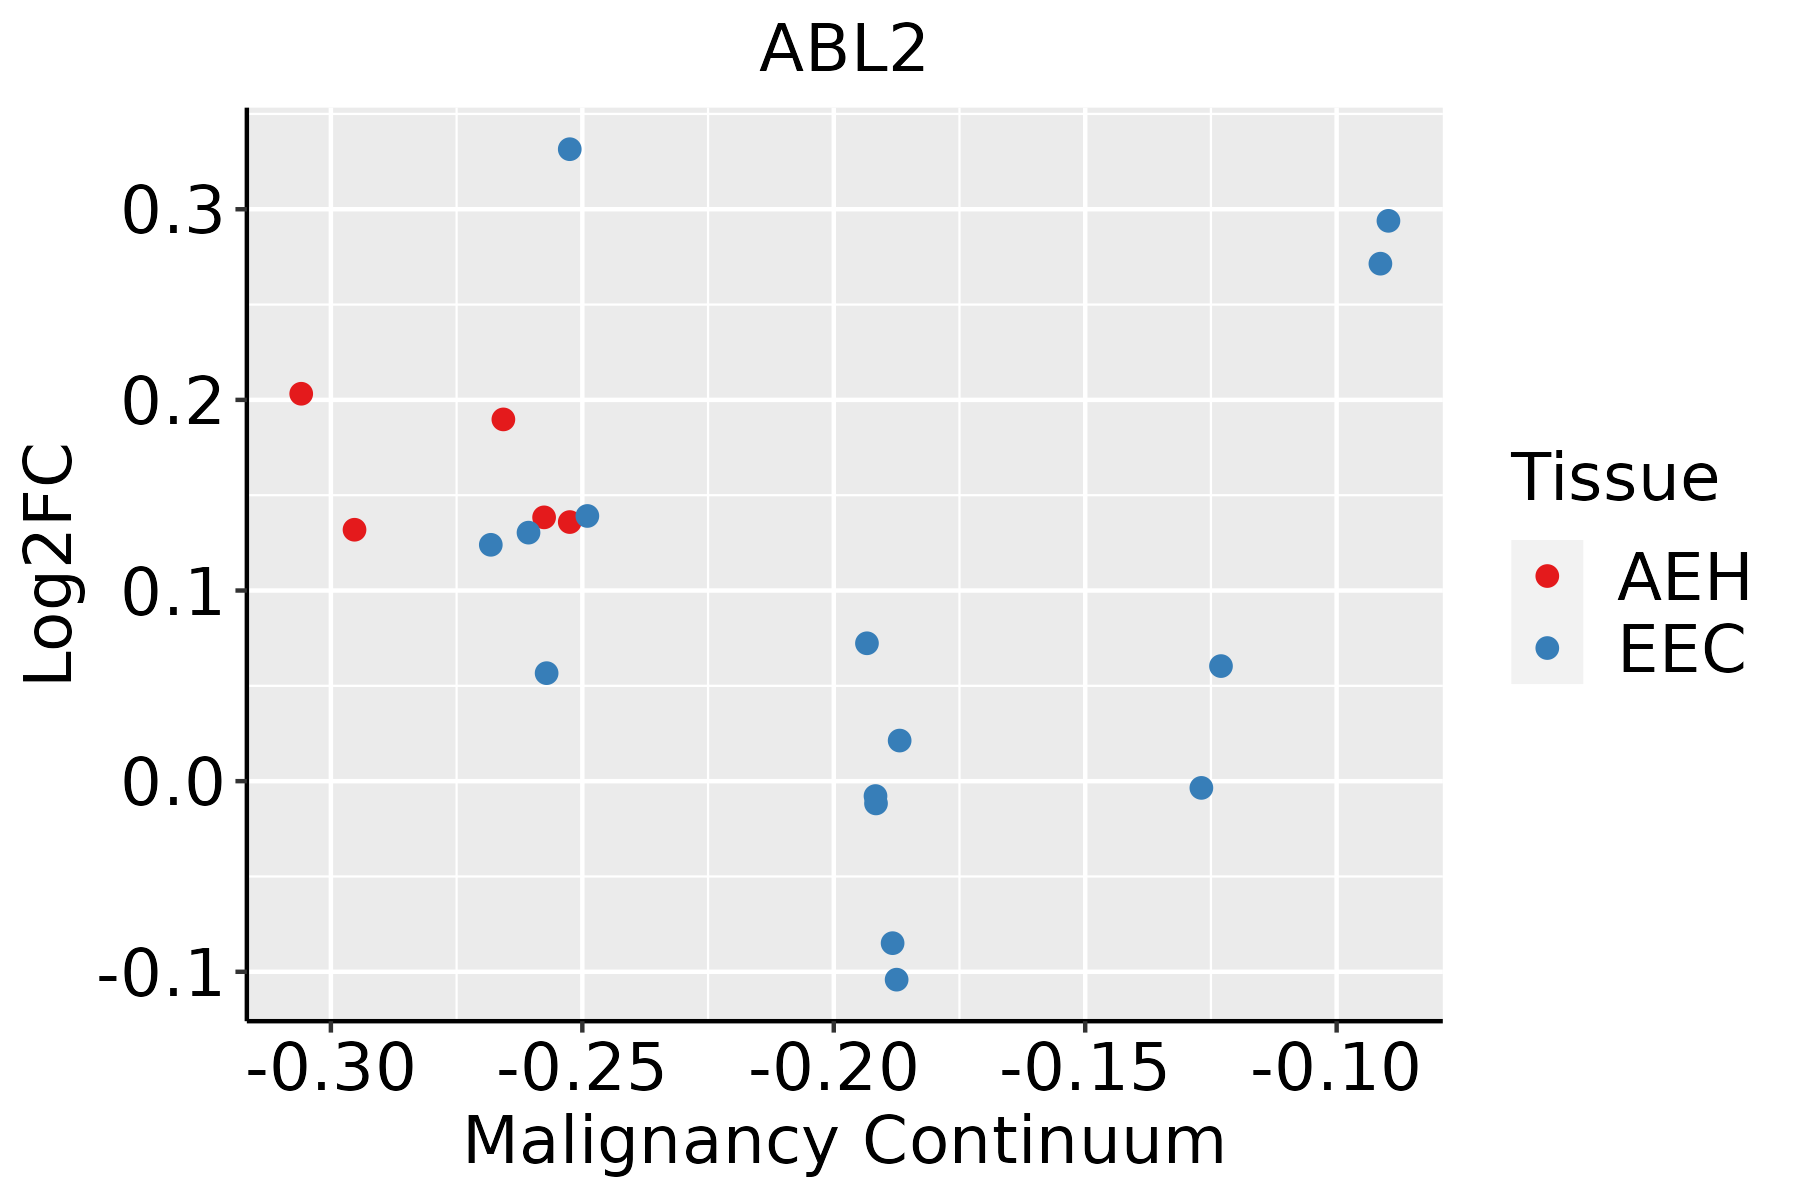 | AEH: Atypical endometrial hyperplasia |
| EEC: Endometrioid Cancer | ||
| Esophagus | 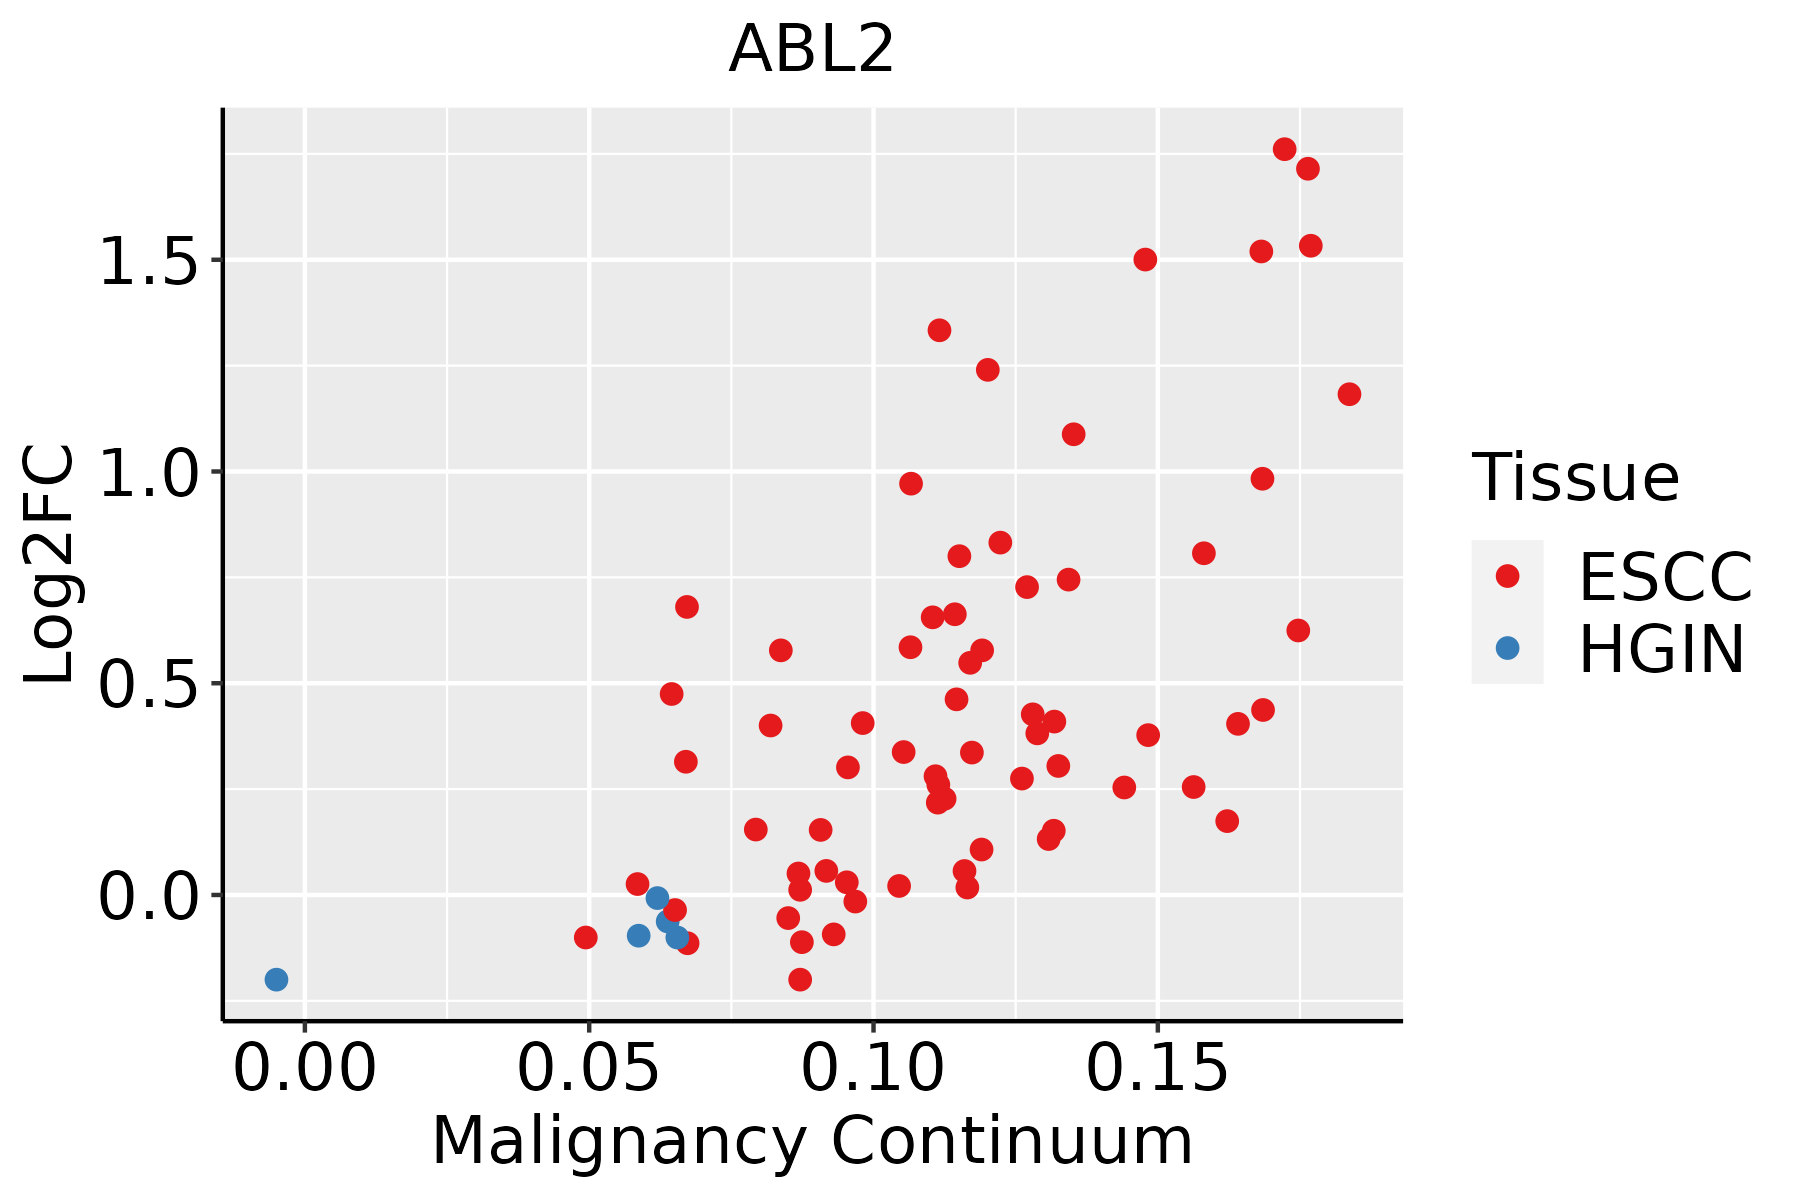 | ESCC: Esophageal squamous cell carcinoma |
| HGIN: High-grade intraepithelial neoplasias | ||
| LGIN: Low-grade intraepithelial neoplasias | ||
| Liver | 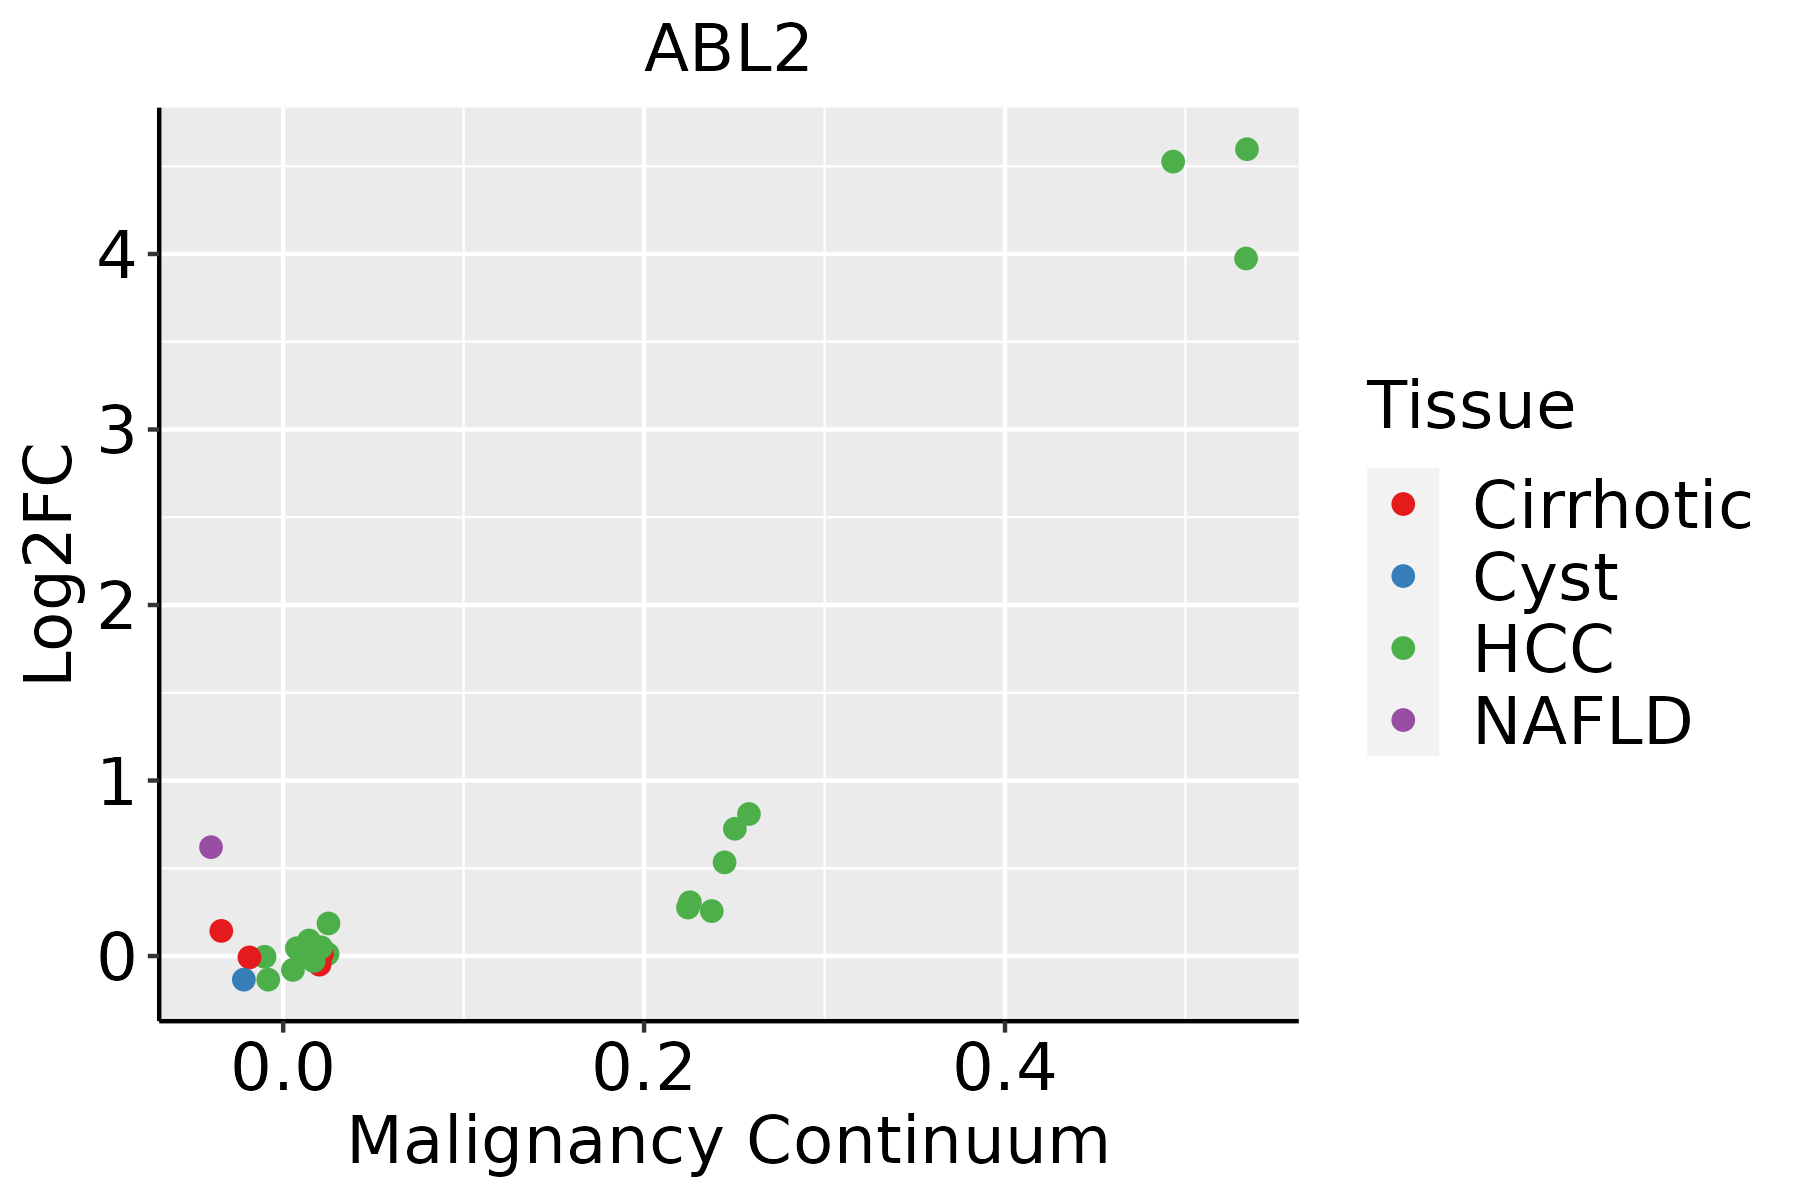 | HCC: Hepatocellular carcinoma |
| NAFLD: Non-alcoholic fatty liver disease | ||
| Lung | 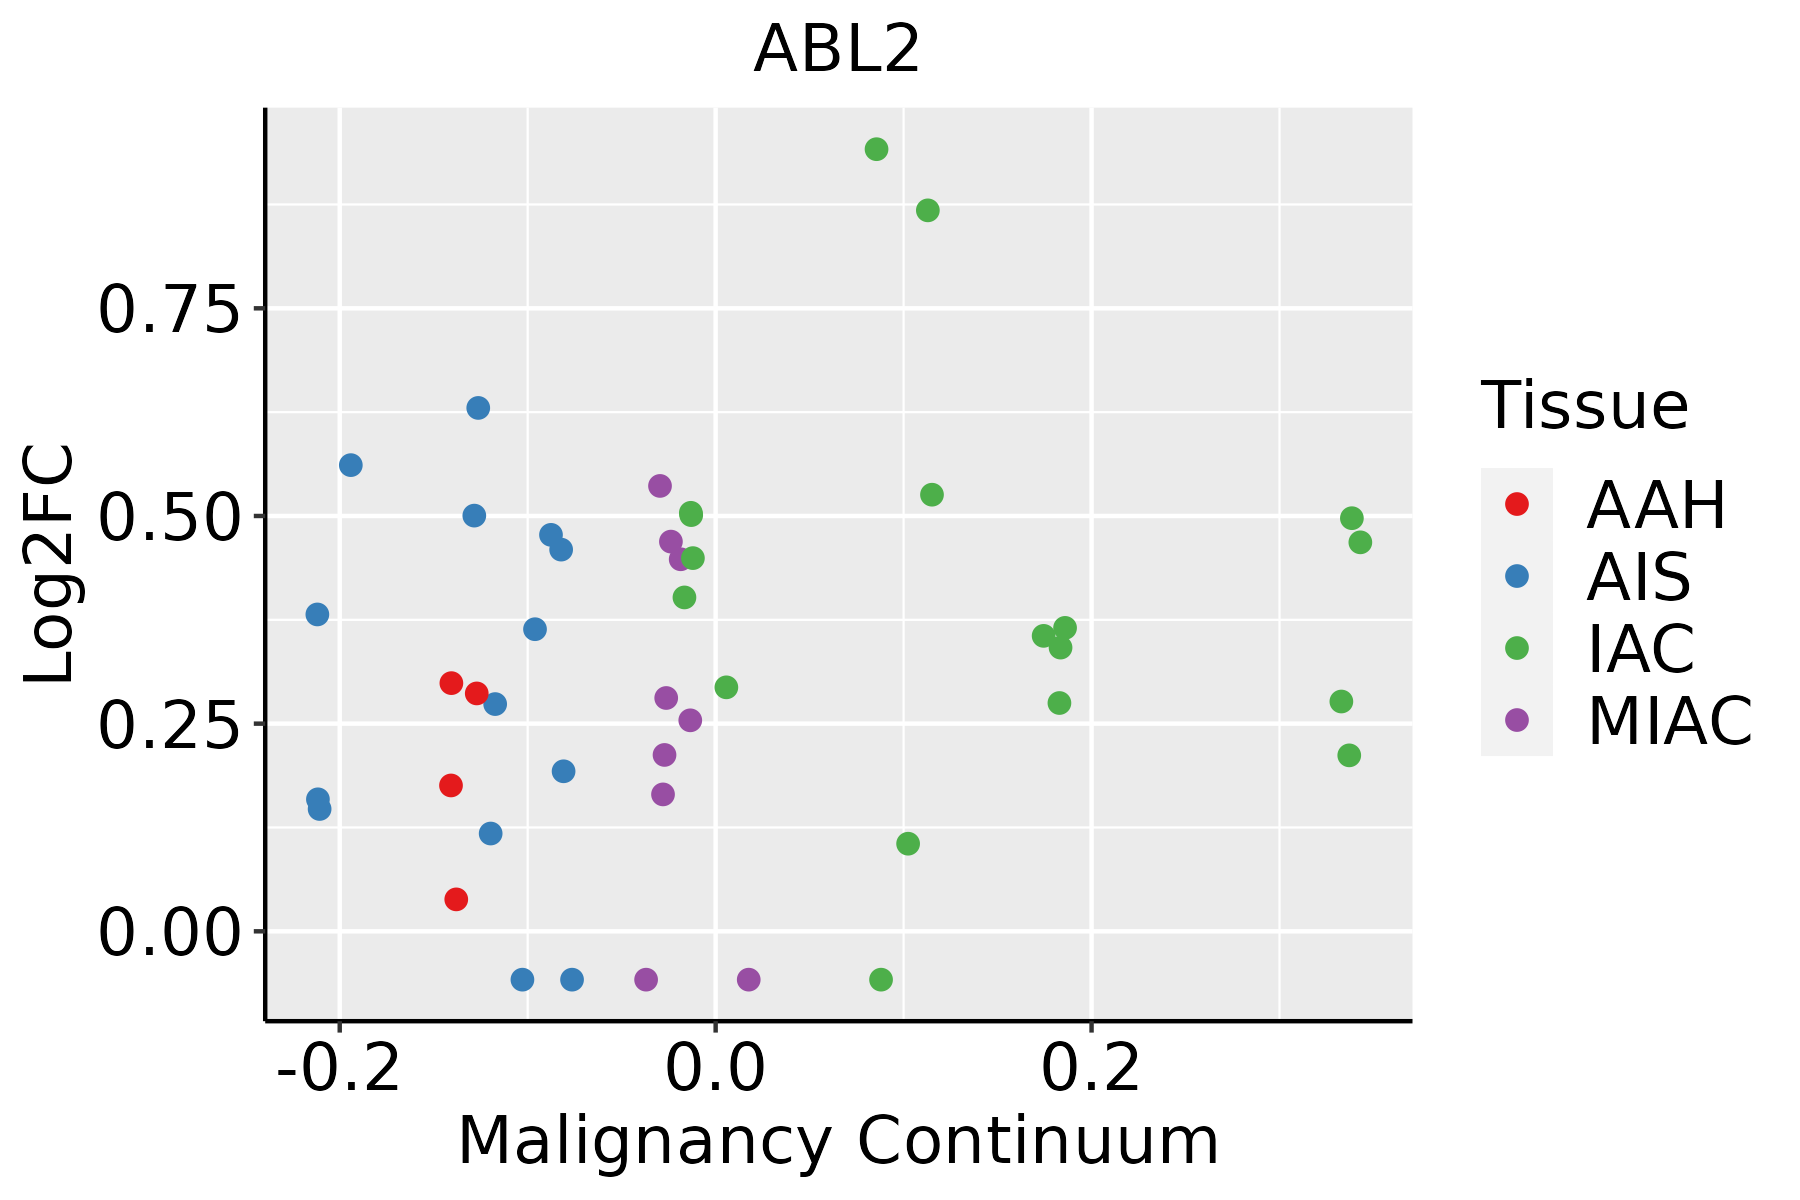 | AAH: Atypical adenomatous hyperplasia |
| AIS: Adenocarcinoma in situ | ||
| IAC: Invasive lung adenocarcinoma | ||
| MIA: Minimally invasive adenocarcinoma | ||
| Oral Cavity |  | EOLP: Erosive Oral lichen planus |
| LP: leukoplakia | ||
| NEOLP: Non-erosive oral lichen planus | ||
| OSCC: Oral squamous cell carcinoma | ||
| Thyroid | 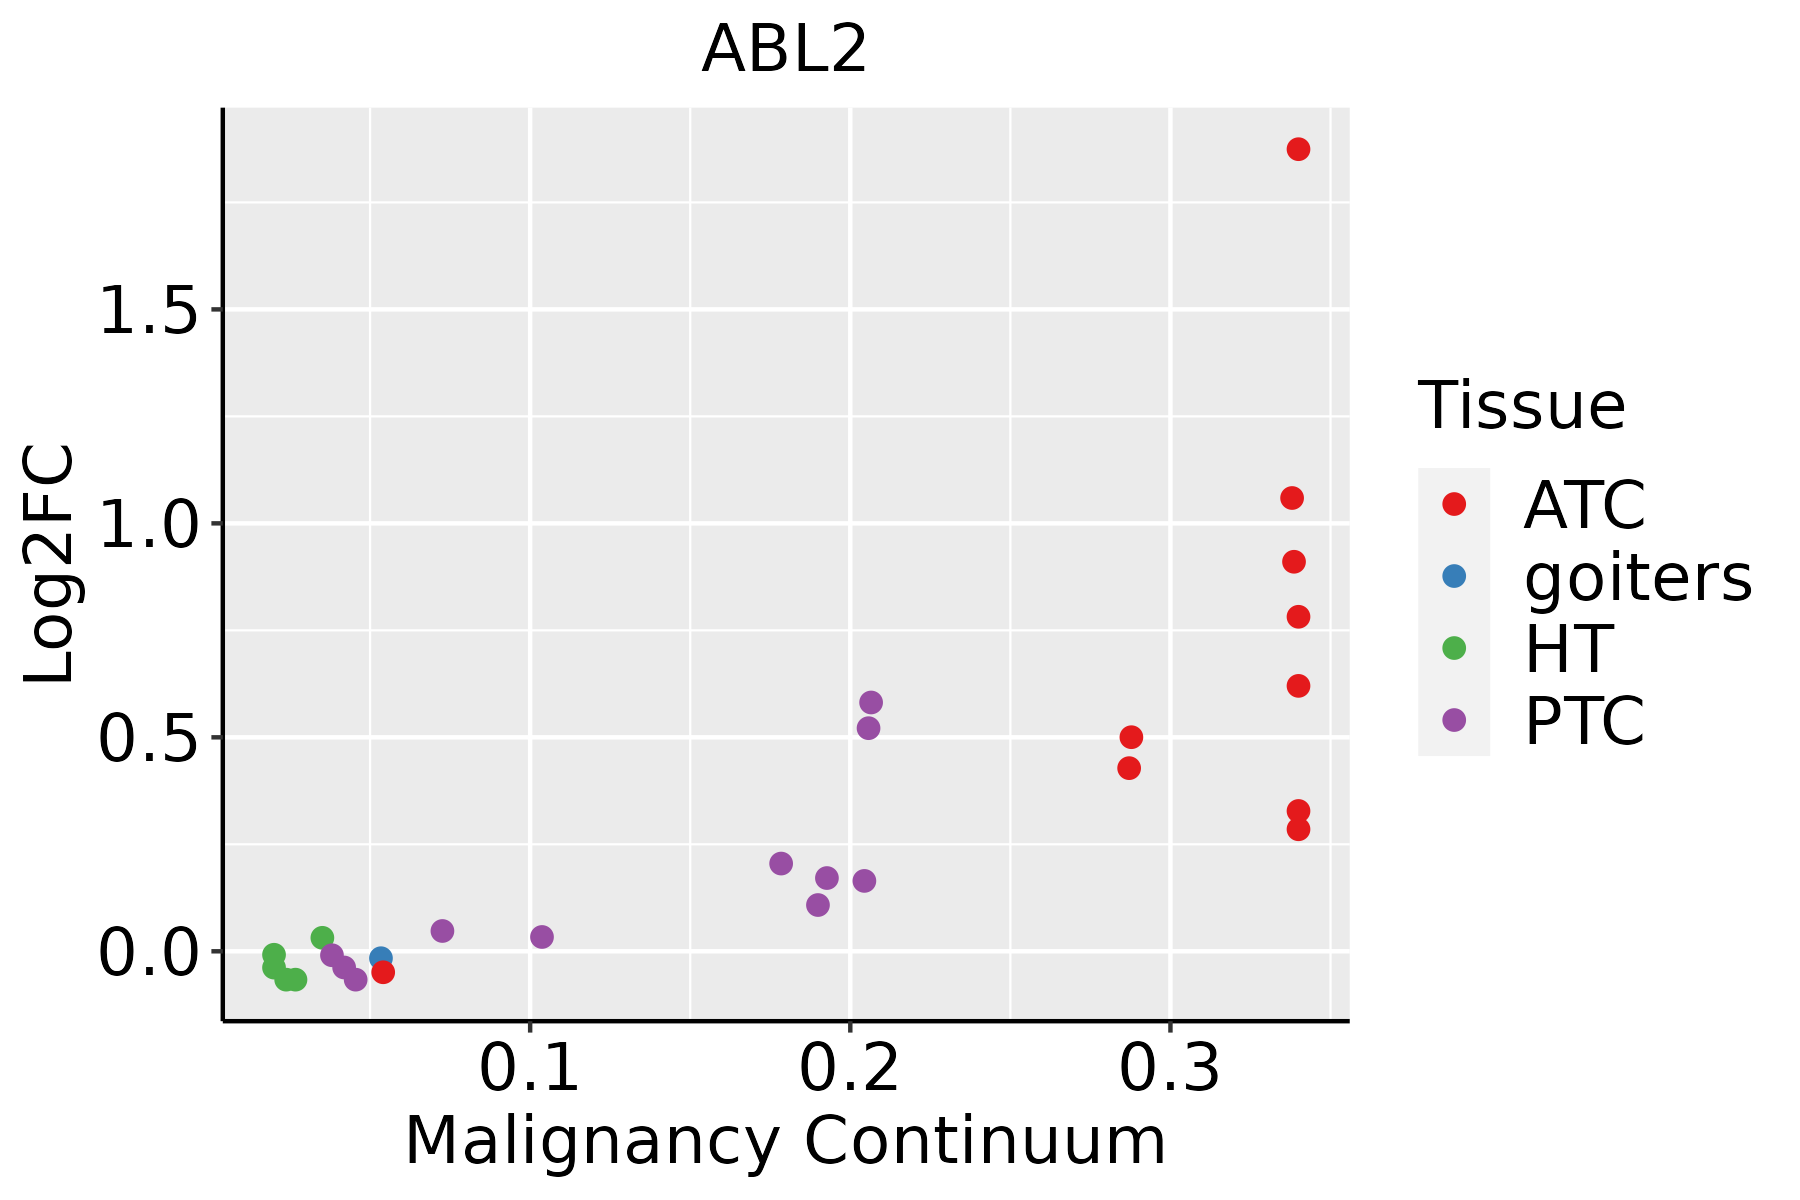 | ATC: Anaplastic thyroid cancer |
| HT: Hashimoto's thyroiditis | ||
| PTC: Papillary thyroid cancer |
| ∗log2FC in expression of this searched gene in stem-like cells from each diseased tissue sample relative to stem-like cells in normal samples in each tissue plotted against the malignancy continuum. Samples are colored based on if they are from different disease stage. |
Top |
Malignant transformation related pathway analysis |
| Find out the enriched GO biological processes and KEGG pathways involved in transition from healthy to precancer to cancer |
| Tissue | Disease Stage | Enriched GO biological Processes |
| Colorectum | AD |  |
| Colorectum | SER |  |
| Colorectum | MSS |  |
| Colorectum | MSI-H |  |
| Colorectum | FAP |  |
| ∗Top 15 enriched GO BP terms are showed in the bar plot of each disease state in each tissue. Each row represents a significant GO biological process which is colored according to the -log10(p.adjust). |
| Page: 1 2 3 4 5 6 7 8 9 |
| GO ID | Tissue | Disease Stage | Description | Gene Ratio | Bg Ratio | pvalue | p.adjust | Count |
| GO:003297010 | Cervix | CC | regulation of actin filament-based process | 96/2311 | 397/18723 | 4.00e-11 | 8.54e-09 | 96 |
| GO:003295610 | Cervix | CC | regulation of actin cytoskeleton organization | 86/2311 | 358/18723 | 5.90e-10 | 7.51e-08 | 86 |
| GO:00510566 | Cervix | CC | regulation of small GTPase mediated signal transduction | 75/2311 | 302/18723 | 1.54e-09 | 1.74e-07 | 75 |
| GO:00072656 | Cervix | CC | Ras protein signal transduction | 79/2311 | 337/18723 | 9.49e-09 | 7.77e-07 | 79 |
| GO:00315328 | Cervix | CC | actin cytoskeleton reorganization | 31/2311 | 107/18723 | 3.34e-06 | 8.99e-05 | 31 |
| GO:00109757 | Cervix | CC | regulation of neuron projection development | 88/2311 | 445/18723 | 4.26e-06 | 1.09e-04 | 88 |
| GO:00313467 | Cervix | CC | positive regulation of cell projection organization | 72/2311 | 353/18723 | 1.04e-05 | 2.32e-04 | 72 |
| GO:00072666 | Cervix | CC | Rho protein signal transduction | 35/2311 | 137/18723 | 1.77e-05 | 3.33e-04 | 35 |
| GO:00465785 | Cervix | CC | regulation of Ras protein signal transduction | 44/2311 | 189/18723 | 2.05e-05 | 3.73e-04 | 44 |
| GO:00301008 | Cervix | CC | regulation of endocytosis | 47/2311 | 211/18723 | 3.65e-05 | 5.82e-04 | 47 |
| GO:20002493 | Cervix | CC | regulation of actin cytoskeleton reorganization | 14/2311 | 39/18723 | 1.36e-04 | 1.66e-03 | 14 |
| GO:00105067 | Cervix | CC | regulation of autophagy | 61/2311 | 317/18723 | 2.61e-04 | 2.87e-03 | 61 |
| GO:00350235 | Cervix | CC | regulation of Rho protein signal transduction | 22/2311 | 86/18723 | 5.93e-04 | 5.60e-03 | 22 |
| GO:00510585 | Cervix | CC | negative regulation of small GTPase mediated signal transduction | 15/2311 | 56/18723 | 2.60e-03 | 1.80e-02 | 15 |
| GO:00350244 | Cervix | CC | negative regulation of Rho protein signal transduction | 8/2311 | 22/18723 | 3.43e-03 | 2.22e-02 | 8 |
| GO:00465804 | Cervix | CC | negative regulation of Ras protein signal transduction | 13/2311 | 49/18723 | 5.34e-03 | 3.10e-02 | 13 |
| GO:0032970 | Colorectum | AD | regulation of actin filament-based process | 142/3918 | 397/18723 | 4.05e-12 | 5.90e-10 | 142 |
| GO:0032956 | Colorectum | AD | regulation of actin cytoskeleton organization | 127/3918 | 358/18723 | 1.03e-10 | 1.04e-08 | 127 |
| GO:0010506 | Colorectum | AD | regulation of autophagy | 111/3918 | 317/18723 | 3.57e-09 | 2.35e-07 | 111 |
| GO:0007265 | Colorectum | AD | Ras protein signal transduction | 104/3918 | 337/18723 | 1.01e-05 | 2.35e-04 | 104 |
| Page: 1 2 3 4 5 6 7 8 9 10 11 12 13 |
| Pathway ID | Tissue | Disease Stage | Description | Gene Ratio | Bg Ratio | pvalue | p.adjust | qvalue | Count |
| hsa0520820 | Cervix | CC | Chemical carcinogenesis - reactive oxygen species | 92/1267 | 223/8465 | 4.71e-22 | 5.09e-20 | 3.01e-20 | 92 |
| hsa0541620 | Cervix | CC | Viral myocarditis | 27/1267 | 60/8465 | 2.43e-08 | 3.57e-07 | 2.11e-07 | 27 |
| hsa0401210 | Cervix | CC | ErbB signaling pathway | 28/1267 | 85/8465 | 2.40e-05 | 1.82e-04 | 1.08e-04 | 28 |
| hsa040142 | Cervix | CC | Ras signaling pathway | 51/1267 | 236/8465 | 3.55e-03 | 1.34e-02 | 7.91e-03 | 51 |
| hsa05208110 | Cervix | CC | Chemical carcinogenesis - reactive oxygen species | 92/1267 | 223/8465 | 4.71e-22 | 5.09e-20 | 3.01e-20 | 92 |
| hsa05416110 | Cervix | CC | Viral myocarditis | 27/1267 | 60/8465 | 2.43e-08 | 3.57e-07 | 2.11e-07 | 27 |
| hsa0401213 | Cervix | CC | ErbB signaling pathway | 28/1267 | 85/8465 | 2.40e-05 | 1.82e-04 | 1.08e-04 | 28 |
| hsa0401411 | Cervix | CC | Ras signaling pathway | 51/1267 | 236/8465 | 3.55e-03 | 1.34e-02 | 7.91e-03 | 51 |
| hsa05208 | Colorectum | AD | Chemical carcinogenesis - reactive oxygen species | 126/2092 | 223/8465 | 1.01e-24 | 1.68e-22 | 1.07e-22 | 126 |
| hsa04012 | Colorectum | AD | ErbB signaling pathway | 31/2092 | 85/8465 | 1.02e-02 | 3.91e-02 | 2.50e-02 | 31 |
| hsa052081 | Colorectum | AD | Chemical carcinogenesis - reactive oxygen species | 126/2092 | 223/8465 | 1.01e-24 | 1.68e-22 | 1.07e-22 | 126 |
| hsa040121 | Colorectum | AD | ErbB signaling pathway | 31/2092 | 85/8465 | 1.02e-02 | 3.91e-02 | 2.50e-02 | 31 |
| hsa052084 | Colorectum | MSS | Chemical carcinogenesis - reactive oxygen species | 118/1875 | 223/8465 | 2.71e-24 | 4.54e-22 | 2.78e-22 | 118 |
| hsa040122 | Colorectum | MSS | ErbB signaling pathway | 30/1875 | 85/8465 | 3.73e-03 | 1.67e-02 | 1.02e-02 | 30 |
| hsa052085 | Colorectum | MSS | Chemical carcinogenesis - reactive oxygen species | 118/1875 | 223/8465 | 2.71e-24 | 4.54e-22 | 2.78e-22 | 118 |
| hsa040123 | Colorectum | MSS | ErbB signaling pathway | 30/1875 | 85/8465 | 3.73e-03 | 1.67e-02 | 1.02e-02 | 30 |
| hsa052088 | Colorectum | FAP | Chemical carcinogenesis - reactive oxygen species | 78/1404 | 223/8465 | 1.08e-11 | 1.80e-09 | 1.09e-09 | 78 |
| hsa040124 | Colorectum | FAP | ErbB signaling pathway | 26/1404 | 85/8465 | 9.52e-04 | 5.22e-03 | 3.17e-03 | 26 |
| hsa052089 | Colorectum | FAP | Chemical carcinogenesis - reactive oxygen species | 78/1404 | 223/8465 | 1.08e-11 | 1.80e-09 | 1.09e-09 | 78 |
| hsa040125 | Colorectum | FAP | ErbB signaling pathway | 26/1404 | 85/8465 | 9.52e-04 | 5.22e-03 | 3.17e-03 | 26 |
| Page: 1 2 3 |
Top |
Cell-cell communication analysis |
| Identification of potential cell-cell interactions between two cell types and their ligand-receptor pairs for different disease states |
| Ligand | Receptor | LRpair | Pathway | Tissue | Disease Stage |
| Page: 1 |
Top |
Single-cell gene regulatory network inference analysis |
| Find out the significant the regulons (TFs) and the target genes of each regulon across cell types for different disease states |
| TF | Cell Type | Tissue | Disease Stage | Target Gene | RSS | Regulon Activity |
| ∗The dot plots of a searched regulon are shown for all cell subpopulations in each disease state of each tissue based on the regulon specific score inferred using pySCENIC and by calculating the average expression. |
| Page: 1 |
Top |
Somatic mutation of malignant transformation related genes |
| Annotation of somatic variants for genes involved in malignant transformation |
| Hugo Symbol | Variant Class | Variant Classification | dbSNP RS | HGVSc | HGVSp | HGVSp Short | SWISSPROT | BIOTYPE | SIFT | PolyPhen | Tumor Sample Barcode | Tissue | Histology | Sex | Age | Stage | Therapy Types | Drugs | Outcome |
| ABL2 | SNV | Missense_Mutation | c.679N>T | p.Asp227Tyr | p.D227Y | P42684 | protein_coding | deleterious(0) | probably_damaging(0.979) | TCGA-A2-A04W-01 | Breast | breast invasive carcinoma | Female | <65 | I/II | Chemotherapy | cytoxan | SD | |
| ABL2 | SNV | Missense_Mutation | novel | c.2929N>G | p.Arg977Gly | p.R977G | P42684 | protein_coding | tolerated_low_confidence(0.11) | possibly_damaging(0.483) | TCGA-A2-A0EQ-01 | Breast | breast invasive carcinoma | Female | <65 | I/II | Chemotherapy | adriamycin | SD |
| ABL2 | SNV | Missense_Mutation | novel | c.703N>C | p.Glu235Gln | p.E235Q | P42684 | protein_coding | deleterious(0.02) | possibly_damaging(0.726) | TCGA-A2-A0YH-01 | Breast | breast invasive carcinoma | Female | <65 | III/IV | Chemotherapy | adriamycin | SD |
| ABL2 | SNV | Missense_Mutation | novel | c.404N>A | p.Arg135Gln | p.R135Q | P42684 | protein_coding | tolerated(0.1) | benign(0.38) | TCGA-BH-A0HF-01 | Breast | breast invasive carcinoma | Female | >=65 | I/II | Hormone Therapy | arimidex | SD |
| ABL2 | SNV | Missense_Mutation | c.1835N>A | p.Arg612Lys | p.R612K | P42684 | protein_coding | tolerated_low_confidence(0.92) | benign(0.076) | TCGA-BH-A0HL-01 | Breast | breast invasive carcinoma | Female | <65 | I/II | Chemotherapy | cyclophosphamide | SD | |
| ABL2 | SNV | Missense_Mutation | rs752266744 | c.730N>T | p.Leu244Phe | p.L244F | P42684 | protein_coding | deleterious(0.03) | probably_damaging(1) | TCGA-D8-A1JD-01 | Breast | breast invasive carcinoma | Female | <65 | I/II | Chemotherapy | adriamycin | SD |
| ABL2 | SNV | Missense_Mutation | c.1363N>C | p.Glu455Gln | p.E455Q | P42684 | protein_coding | deleterious(0) | probably_damaging(0.998) | TCGA-E2-A1LG-01 | Breast | breast invasive carcinoma | Female | <65 | I/II | Chemotherapy | doxorubicin | SD | |
| ABL2 | SNV | Missense_Mutation | novel | c.2630N>T | p.Pro877Leu | p.P877L | P42684 | protein_coding | deleterious_low_confidence(0.01) | benign(0.01) | TCGA-EW-A1IZ-01 | Breast | breast invasive carcinoma | Female | <65 | III/IV | Chemotherapy | taxotere | SD |
| ABL2 | insertion | Frame_Shift_Ins | novel | c.2993_2994insA | p.Cys999LeufsTer68 | p.C999Lfs*68 | P42684 | protein_coding | TCGA-A8-A07R-01 | Breast | breast invasive carcinoma | Female | >=65 | III/IV | Ancillary | zoledronic | SD | ||
| ABL2 | insertion | Frame_Shift_Ins | novel | c.2992_2993insACAGCCAGCTGGTAGACACTGGACACCAGCTGCTTGAC | p.Ile998AsnfsTer25 | p.I998Nfs*25 | P42684 | protein_coding | TCGA-A8-A07R-01 | Breast | breast invasive carcinoma | Female | >=65 | III/IV | Ancillary | zoledronic | SD |
| Page: 1 2 3 4 5 6 7 8 9 10 11 12 13 14 |
Top |
Related drugs of malignant transformation related genes |
| Identification of chemicals and drugs interact with genes involved in malignant transfromation |
| (DGIdb 4.0) |
| Entrez ID | Symbol | Category | Interaction Types | Drug Claim Name | Drug Name | PMIDs |
| 27 | ABL2 | KINASE, TYROSINE KINASE, CLINICALLY ACTIONABLE, DRUGGABLE GENOME, ENZYME | DASATINIB | DASATINIB | ||
| 27 | ABL2 | KINASE, TYROSINE KINASE, CLINICALLY ACTIONABLE, DRUGGABLE GENOME, ENZYME | inhibitor | TOZASERTIB | TOZASERTIB | 19035792 |
| 27 | ABL2 | KINASE, TYROSINE KINASE, CLINICALLY ACTIONABLE, DRUGGABLE GENOME, ENZYME | PONATINIB | PONATINIB | 20513156 | |
| 27 | ABL2 | KINASE, TYROSINE KINASE, CLINICALLY ACTIONABLE, DRUGGABLE GENOME, ENZYME | DASATINIB | DASATINIB | ||
| 27 | ABL2 | KINASE, TYROSINE KINASE, CLINICALLY ACTIONABLE, DRUGGABLE GENOME, ENZYME | DASATINIB | DASATINIB | 25207766 | |
| 27 | ABL2 | KINASE, TYROSINE KINASE, CLINICALLY ACTIONABLE, DRUGGABLE GENOME, ENZYME | IMATINIB | IMATINIB | 25207766 | |
| 27 | ABL2 | KINASE, TYROSINE KINASE, CLINICALLY ACTIONABLE, DRUGGABLE GENOME, ENZYME | inhibitor | 249565827 | ||
| 27 | ABL2 | KINASE, TYROSINE KINASE, CLINICALLY ACTIONABLE, DRUGGABLE GENOME, ENZYME | inhibitor | 363894211 | PEXMETINIB |
| Page: 1 |

Copyright 2023-Present -The University of Texas Health Science Center at Houston |