
|
|||||
|
 | |
| |
| |
| |
| |
| |
|
Gene: ABI3BP |
Gene summary for ABI3BP |
| Gene information | Species | Human | Gene symbol | ABI3BP | Gene ID | 25890 |
| Gene name | ABI family member 3 binding protein | |
| Gene Alias | NESHBP | |
| Cytomap | 3q12.2 | |
| Gene Type | protein-coding | GO ID | GO:0005575 | UniProtAcc | Q7Z7G0 |
Top |
Malignant transformation analysis |
| Identification of the aberrant gene expression in precancerous and cancerous lesions by comparing the gene expression of stem-like cells in diseased tissues with normal stem cells |
| Entrez ID | Symbol | Replicates | Species | Organ | Tissue | Adj P-value | Log2FC | Malignancy |
| 25890 | ABI3BP | HTA11_4255_2000001011 | Human | Colorectum | SER | 1.54e-05 | 4.17e-01 | 0.0446 |
| 25890 | ABI3BP | HTA11_8622_2000001021 | Human | Colorectum | SER | 4.68e-03 | 2.44e-01 | 0.0528 |
| 25890 | ABI3BP | HTA11_6818_2000001011 | Human | Colorectum | AD | 9.51e-24 | 1.02e+00 | 0.0112 |
| 25890 | ABI3BP | HTA11_6818_2000001021 | Human | Colorectum | AD | 9.91e-26 | 7.44e-01 | 0.0588 |
| 25890 | ABI3BP | LZE2T | Human | Esophagus | ESCC | 4.23e-06 | 5.83e-01 | 0.082 |
| 25890 | ABI3BP | P10T-E | Human | Esophagus | ESCC | 1.61e-57 | 1.38e+00 | 0.116 |
| 25890 | ABI3BP | P11T-E | Human | Esophagus | ESCC | 9.13e-05 | 1.10e-01 | 0.1426 |
| 25890 | ABI3BP | P79T-E | Human | Esophagus | ESCC | 1.76e-59 | 1.97e+00 | 0.1154 |
| 25890 | ABI3BP | PTC07 | Human | Thyroid | PTC | 2.22e-07 | -5.11e-02 | 0.2044 |
| 25890 | ABI3BP | ATC12 | Human | Thyroid | ATC | 2.30e-42 | 1.01e+00 | 0.34 |
| 25890 | ABI3BP | ATC2 | Human | Thyroid | ATC | 4.72e-04 | 9.11e-01 | 0.34 |
| 25890 | ABI3BP | ATC4 | Human | Thyroid | ATC | 6.58e-50 | 1.28e+00 | 0.34 |
| 25890 | ABI3BP | ATC5 | Human | Thyroid | ATC | 1.59e-06 | 3.47e-02 | 0.34 |
| Page: 1 |
| Tissue | Expression Dynamics | Abbreviation |
| Colorectum (GSE201348) |  | FAP: Familial adenomatous polyposis |
| CRC: Colorectal cancer | ||
| Colorectum (HTA11) |  | AD: Adenomas |
| SER: Sessile serrated lesions | ||
| MSI-H: Microsatellite-high colorectal cancer | ||
| MSS: Microsatellite stable colorectal cancer | ||
| Esophagus | 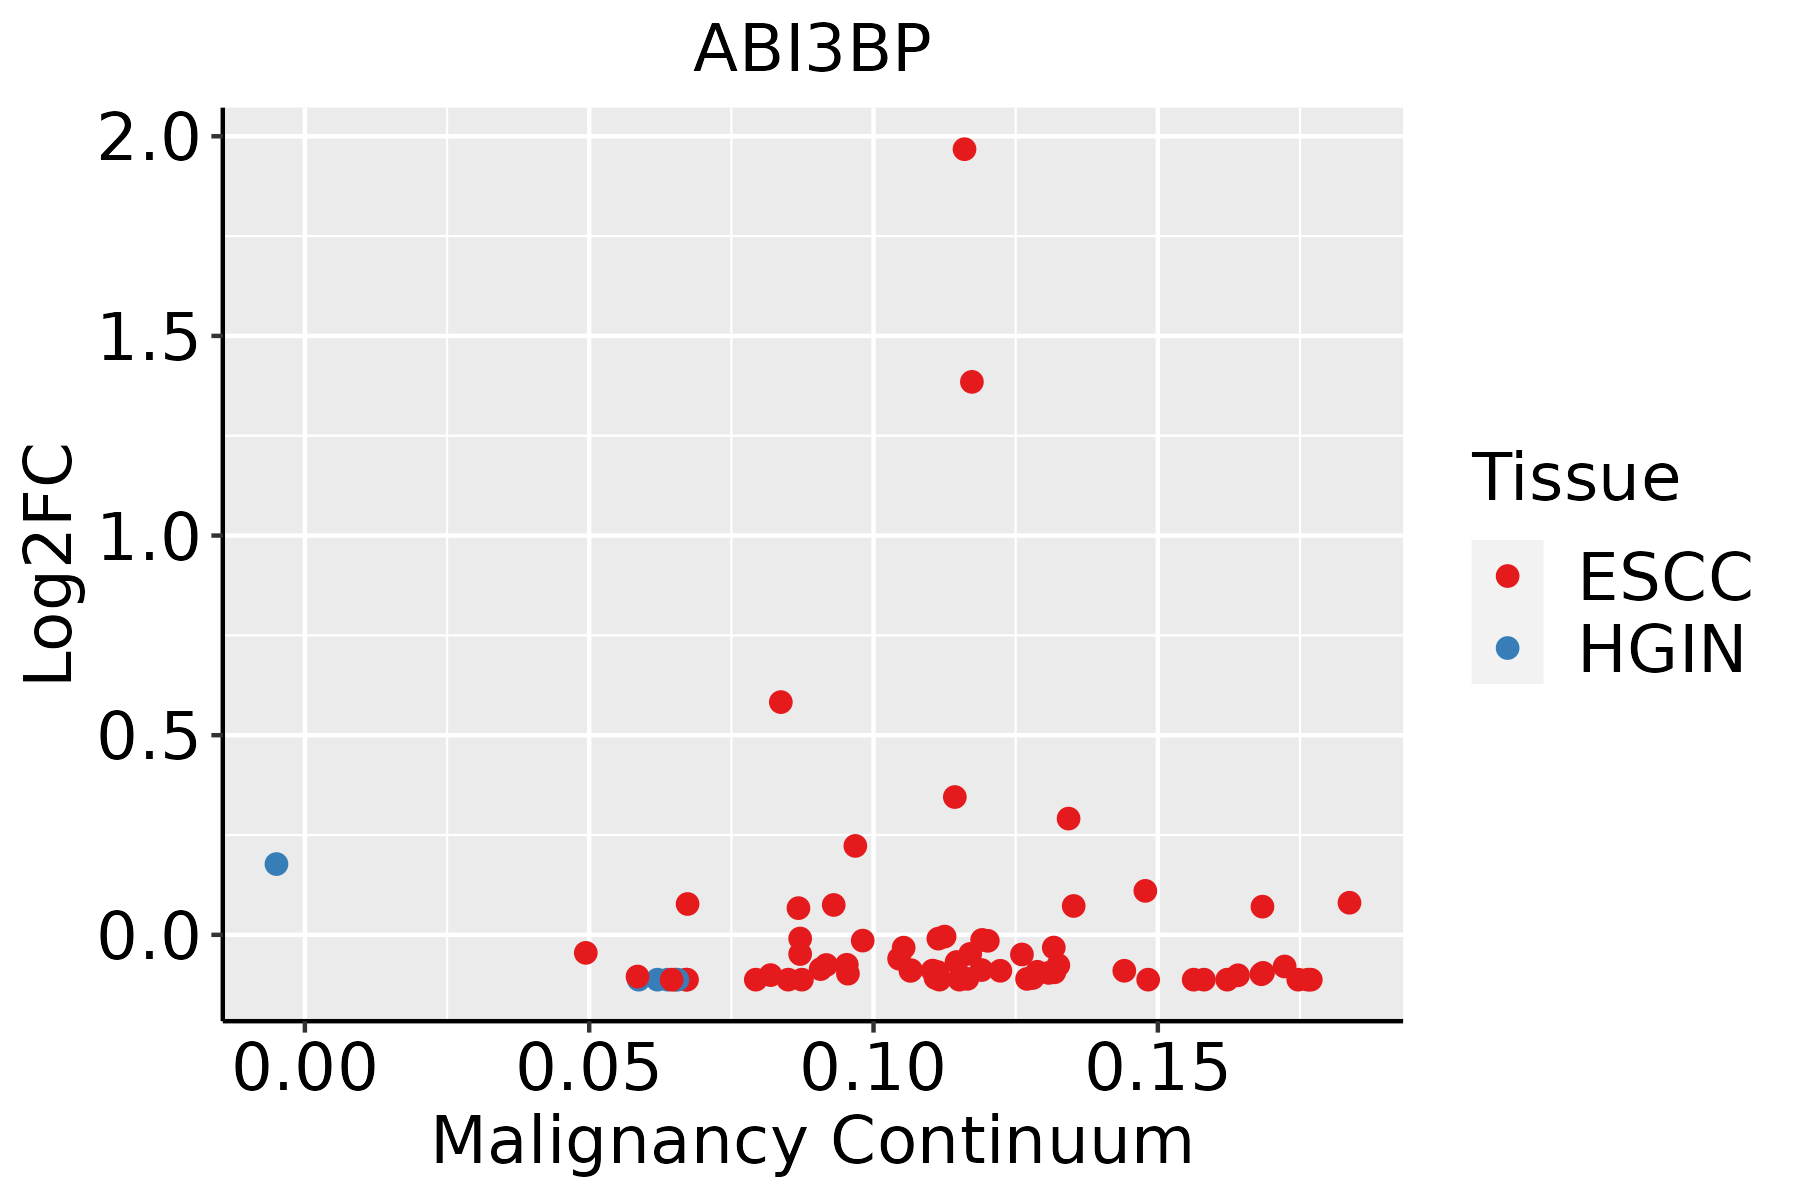 | ESCC: Esophageal squamous cell carcinoma |
| HGIN: High-grade intraepithelial neoplasias | ||
| LGIN: Low-grade intraepithelial neoplasias | ||
| Thyroid | 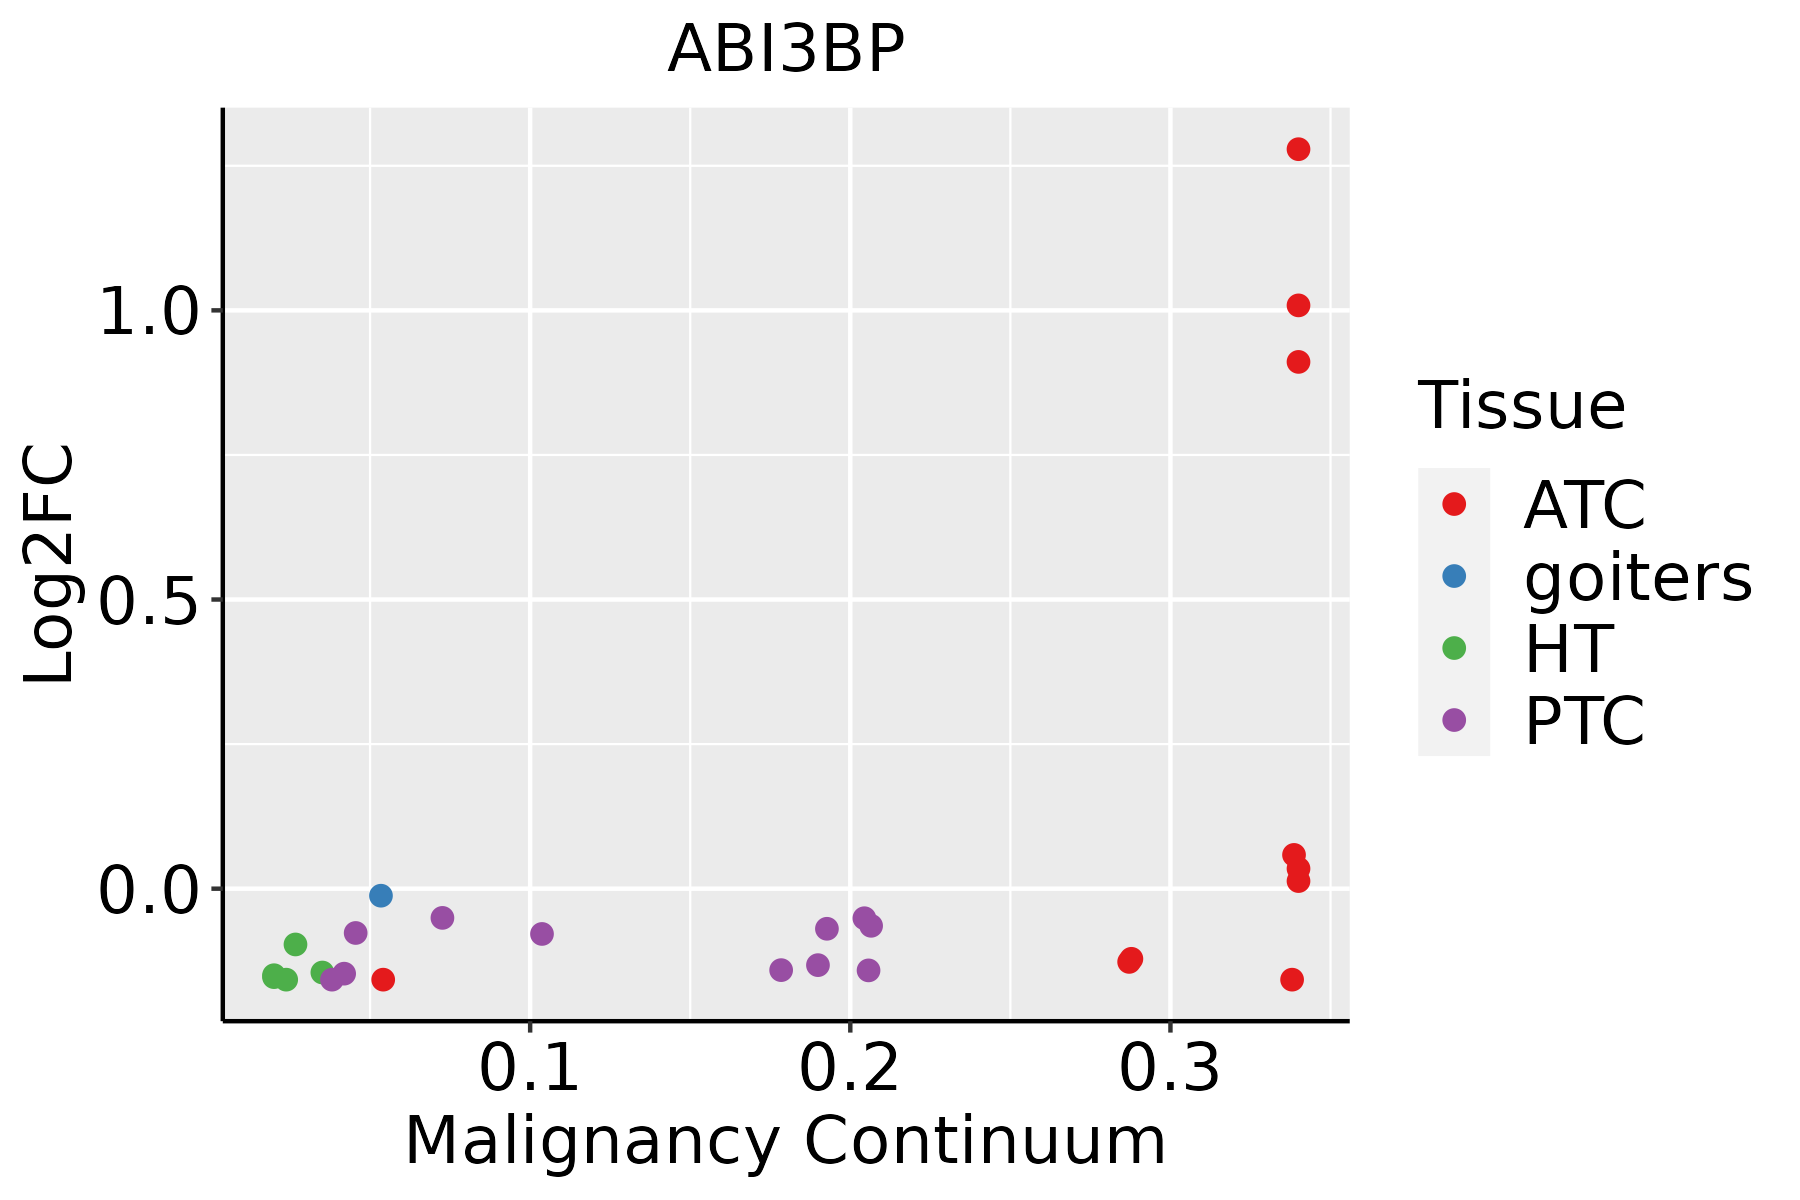 | ATC: Anaplastic thyroid cancer |
| HT: Hashimoto's thyroiditis | ||
| PTC: Papillary thyroid cancer |
| ∗log2FC in expression of this searched gene in stem-like cells from each diseased tissue sample relative to stem-like cells in normal samples in each tissue plotted against the malignancy continuum. Samples are colored based on if they are from different disease stage. |
Top |
Malignant transformation related pathway analysis |
| Find out the enriched GO biological processes and KEGG pathways involved in transition from healthy to precancer to cancer |
| Tissue | Disease Stage | Enriched GO biological Processes |
| Colorectum | AD |  |
| Colorectum | SER |  |
| Colorectum | MSS |  |
| Colorectum | MSI-H |  |
| Colorectum | FAP |  |
| ∗Top 15 enriched GO BP terms are showed in the bar plot of each disease state in each tissue. Each row represents a significant GO biological process which is colored according to the -log10(p.adjust). |
| Page: 1 2 3 4 5 6 7 8 9 |
| GO ID | Tissue | Disease Stage | Description | Gene Ratio | Bg Ratio | pvalue | p.adjust | Count |
| Page: 1 |
| Pathway ID | Tissue | Disease Stage | Description | Gene Ratio | Bg Ratio | pvalue | p.adjust | qvalue | Count |
| Page: 1 |
Top |
Cell-cell communication analysis |
| Identification of potential cell-cell interactions between two cell types and their ligand-receptor pairs for different disease states |
| Ligand | Receptor | LRpair | Pathway | Tissue | Disease Stage |
| Page: 1 |
Top |
Single-cell gene regulatory network inference analysis |
| Find out the significant the regulons (TFs) and the target genes of each regulon across cell types for different disease states |
| TF | Cell Type | Tissue | Disease Stage | Target Gene | RSS | Regulon Activity |
| ∗The dot plots of a searched regulon are shown for all cell subpopulations in each disease state of each tissue based on the regulon specific score inferred using pySCENIC and by calculating the average expression. |
| Page: 1 |
Top |
Somatic mutation of malignant transformation related genes |
| Annotation of somatic variants for genes involved in malignant transformation |
| Hugo Symbol | Variant Class | Variant Classification | dbSNP RS | HGVSc | HGVSp | HGVSp Short | SWISSPROT | BIOTYPE | SIFT | PolyPhen | Tumor Sample Barcode | Tissue | Histology | Sex | Age | Stage | Therapy Types | Drugs | Outcome |
| ABI3BP | SNV | Missense_Mutation | c.976G>C | p.Glu326Gln | p.E326Q | Q7Z7G0 | protein_coding | tolerated(0.06) | possibly_damaging(0.521) | TCGA-A2-A0EQ-01 | Breast | breast invasive carcinoma | Female | <65 | I/II | Chemotherapy | adriamycin | SD | |
| ABI3BP | SNV | Missense_Mutation | novel | c.2747N>A | p.Pro916Gln | p.P916Q | Q7Z7G0 | protein_coding | deleterious(0) | possibly_damaging(0.778) | TCGA-A7-A0DB-01 | Breast | breast invasive carcinoma | Female | <65 | I/II | Hormone Therapy | arimidex | SD |
| ABI3BP | SNV | Missense_Mutation | c.2581N>A | p.Glu861Lys | p.E861K | Q7Z7G0 | protein_coding | deleterious(0.01) | benign(0.217) | TCGA-A8-A09Q-01 | Breast | breast invasive carcinoma | Female | >=65 | III/IV | Hormone Therapy | anastrozole | SD | |
| ABI3BP | SNV | Missense_Mutation | c.1198N>C | p.Glu400Gln | p.E400Q | Q7Z7G0 | protein_coding | deleterious(0.04) | benign(0.229) | TCGA-AC-A23H-01 | Breast | breast invasive carcinoma | Female | >=65 | I/II | Unknown | Unknown | PD | |
| ABI3BP | SNV | Missense_Mutation | c.1132N>A | p.Asp378Asn | p.D378N | Q7Z7G0 | protein_coding | tolerated(0.07) | benign(0.396) | TCGA-AC-A23H-01 | Breast | breast invasive carcinoma | Female | >=65 | I/II | Unknown | Unknown | PD | |
| ABI3BP | SNV | Missense_Mutation | c.1295N>T | p.Thr432Ile | p.T432I | Q7Z7G0 | protein_coding | deleterious(0) | possibly_damaging(0.623) | TCGA-AR-A24U-01 | Breast | breast invasive carcinoma | Female | <65 | I/II | Chemotherapy | doxorubicin | SD | |
| ABI3BP | SNV | Missense_Mutation | c.1805C>T | p.Pro602Leu | p.P602L | Q7Z7G0 | protein_coding | tolerated(0.09) | possibly_damaging(0.476) | TCGA-B6-A1KF-01 | Breast | breast invasive carcinoma | Female | >=65 | I/II | Unknown | Unknown | SD | |
| ABI3BP | SNV | Missense_Mutation | c.2973N>C | p.Leu991Phe | p.L991F | Q7Z7G0 | protein_coding | deleterious(0) | probably_damaging(0.998) | TCGA-C8-A27B-01 | Breast | breast invasive carcinoma | Female | <65 | I/II | Chemotherapy | 5-fluorouracil | CR | |
| ABI3BP | SNV | Missense_Mutation | c.478N>A | p.Asp160Asn | p.D160N | Q7Z7G0 | protein_coding | deleterious(0.02) | possibly_damaging(0.89) | TCGA-D8-A27V-01 | Breast | breast invasive carcinoma | Female | <65 | I/II | Hormone Therapy | tamoxiphen | SD | |
| ABI3BP | SNV | Missense_Mutation | novel | c.496N>T | p.Arg166Cys | p.R166C | Q7Z7G0 | protein_coding | deleterious(0) | probably_damaging(0.997) | TCGA-EW-A1IZ-01 | Breast | breast invasive carcinoma | Female | <65 | III/IV | Chemotherapy | taxotere | SD |
| Page: 1 2 3 4 5 6 7 8 9 10 11 12 13 14 15 16 17 |
Top |
Related drugs of malignant transformation related genes |
| Identification of chemicals and drugs interact with genes involved in malignant transfromation |
| (DGIdb 4.0) |
| Entrez ID | Symbol | Category | Interaction Types | Drug Claim Name | Drug Name | PMIDs |
| Page: 1 |

Copyright 2023-Present -The University of Texas Health Science Center at Houston |