
|
|||||
|
 | |
| |
| |
| |
| |
| |
|
Gene: ABI2 |
Gene summary for ABI2 |
| Gene information | Species | Human | Gene symbol | ABI2 | Gene ID | 10152 |
| Gene name | abl interactor 2 | |
| Gene Alias | ABI-2 | |
| Cytomap | 2q33.2 | |
| Gene Type | protein-coding | GO ID | GO:0000902 | UniProtAcc | F8WAL6 |
Top |
Malignant transformation analysis |
| Identification of the aberrant gene expression in precancerous and cancerous lesions by comparing the gene expression of stem-like cells in diseased tissues with normal stem cells |
| Entrez ID | Symbol | Replicates | Species | Organ | Tissue | Adj P-value | Log2FC | Malignancy |
| 10152 | ABI2 | LZE7T | Human | Esophagus | ESCC | 4.32e-14 | 4.83e-01 | 0.0667 |
| 10152 | ABI2 | LZE20T | Human | Esophagus | ESCC | 1.71e-03 | 6.07e-02 | 0.0662 |
| 10152 | ABI2 | LZE24T | Human | Esophagus | ESCC | 1.53e-14 | 4.69e-01 | 0.0596 |
| 10152 | ABI2 | P1T-E | Human | Esophagus | ESCC | 1.03e-02 | 3.34e-01 | 0.0875 |
| 10152 | ABI2 | P2T-E | Human | Esophagus | ESCC | 8.19e-37 | 7.02e-01 | 0.1177 |
| 10152 | ABI2 | P4T-E | Human | Esophagus | ESCC | 1.28e-27 | 6.33e-01 | 0.1323 |
| 10152 | ABI2 | P5T-E | Human | Esophagus | ESCC | 6.16e-11 | 2.27e-01 | 0.1327 |
| 10152 | ABI2 | P8T-E | Human | Esophagus | ESCC | 1.30e-21 | 4.23e-01 | 0.0889 |
| 10152 | ABI2 | P9T-E | Human | Esophagus | ESCC | 1.95e-09 | 3.15e-01 | 0.1131 |
| 10152 | ABI2 | P10T-E | Human | Esophagus | ESCC | 7.36e-38 | 5.71e-01 | 0.116 |
| 10152 | ABI2 | P11T-E | Human | Esophagus | ESCC | 4.29e-08 | 4.45e-01 | 0.1426 |
| 10152 | ABI2 | P12T-E | Human | Esophagus | ESCC | 1.80e-37 | 7.29e-01 | 0.1122 |
| 10152 | ABI2 | P15T-E | Human | Esophagus | ESCC | 7.06e-34 | 8.19e-01 | 0.1149 |
| 10152 | ABI2 | P16T-E | Human | Esophagus | ESCC | 4.74e-35 | 6.66e-01 | 0.1153 |
| 10152 | ABI2 | P17T-E | Human | Esophagus | ESCC | 4.83e-04 | 2.91e-01 | 0.1278 |
| 10152 | ABI2 | P20T-E | Human | Esophagus | ESCC | 2.18e-11 | 3.14e-01 | 0.1124 |
| 10152 | ABI2 | P21T-E | Human | Esophagus | ESCC | 3.77e-13 | 2.75e-01 | 0.1617 |
| 10152 | ABI2 | P22T-E | Human | Esophagus | ESCC | 2.64e-30 | 5.39e-01 | 0.1236 |
| 10152 | ABI2 | P23T-E | Human | Esophagus | ESCC | 4.58e-11 | 2.42e-01 | 0.108 |
| 10152 | ABI2 | P24T-E | Human | Esophagus | ESCC | 1.26e-28 | 4.86e-01 | 0.1287 |
| Page: 1 2 3 4 5 6 7 |
| Tissue | Expression Dynamics | Abbreviation |
| Esophagus | 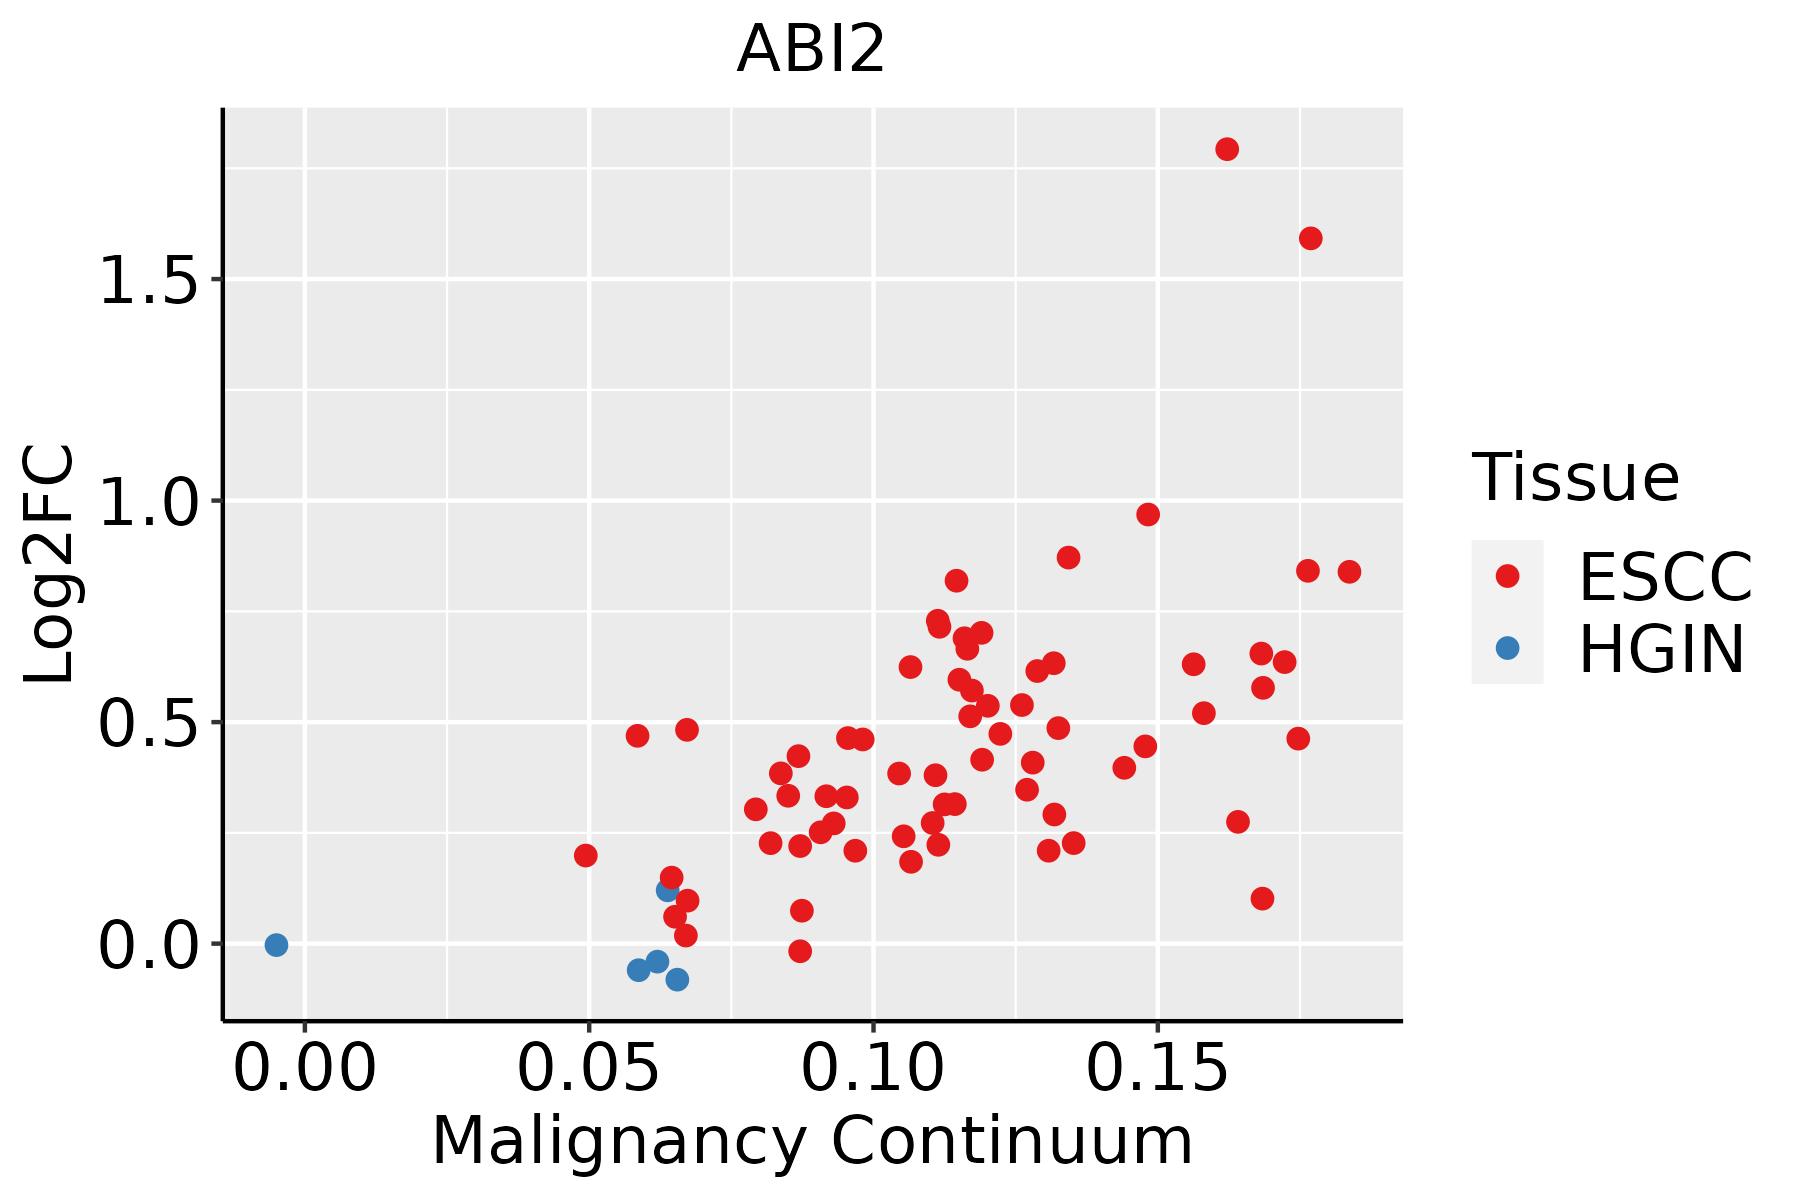 | ESCC: Esophageal squamous cell carcinoma |
| HGIN: High-grade intraepithelial neoplasias | ||
| LGIN: Low-grade intraepithelial neoplasias | ||
| Liver |  | HCC: Hepatocellular carcinoma |
| NAFLD: Non-alcoholic fatty liver disease | ||
| Oral Cavity | 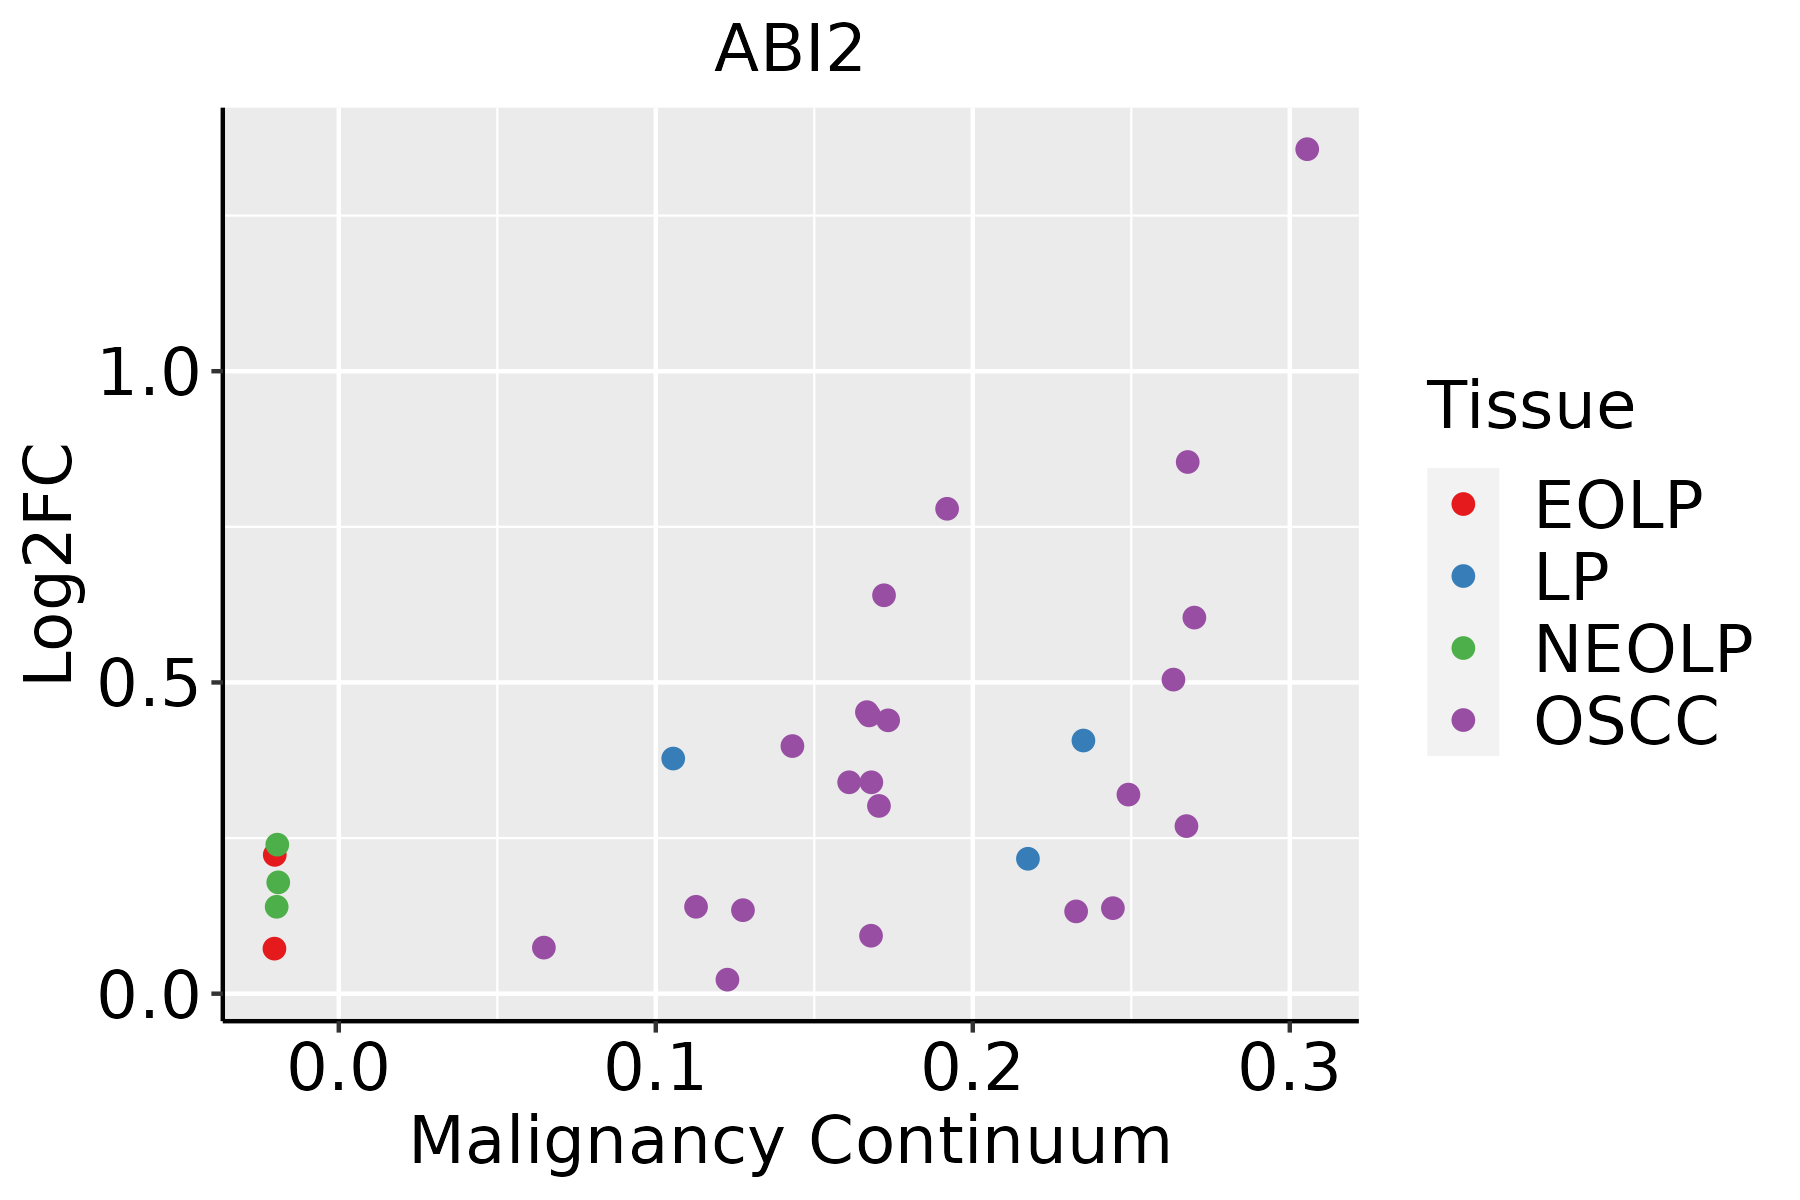 | EOLP: Erosive Oral lichen planus |
| LP: leukoplakia | ||
| NEOLP: Non-erosive oral lichen planus | ||
| OSCC: Oral squamous cell carcinoma | ||
| Prostate | 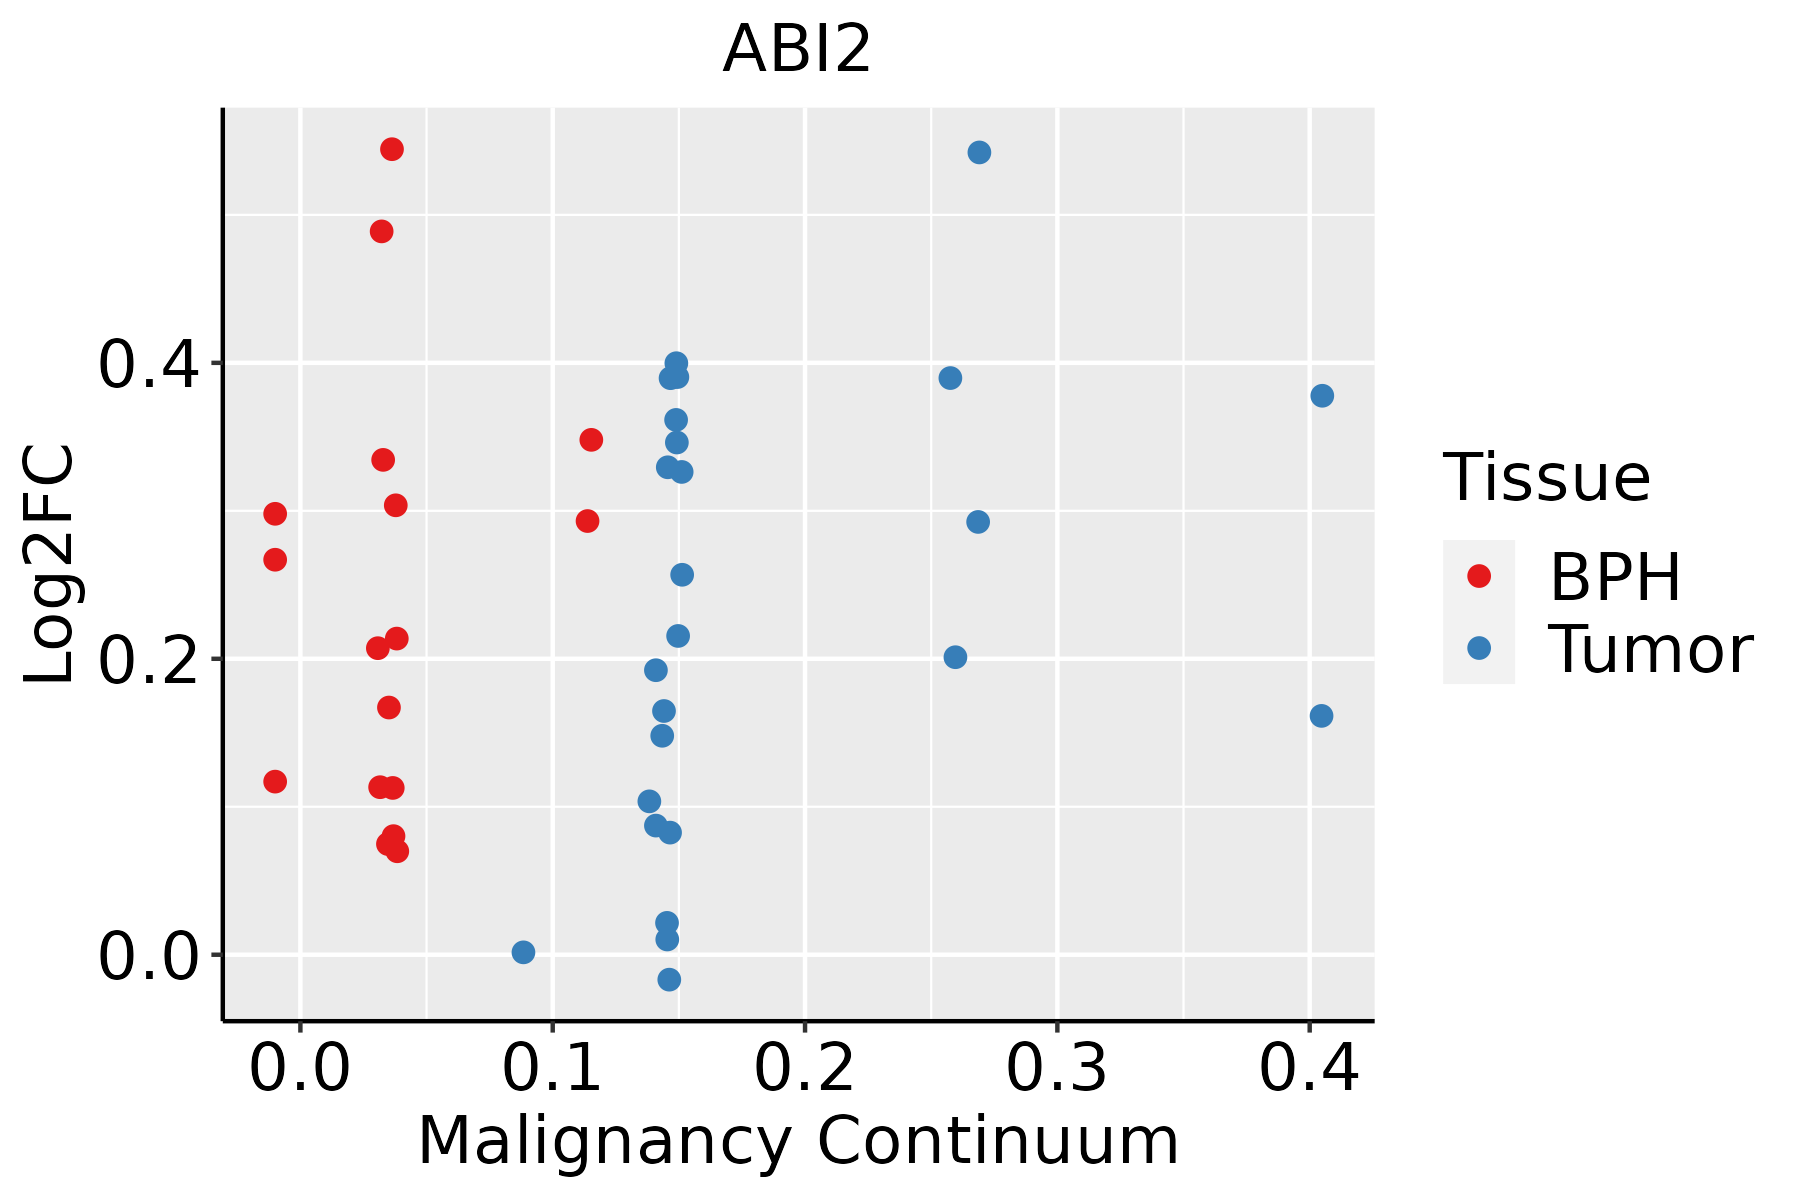 | BPH: Benign Prostatic Hyperplasia |
| Thyroid | 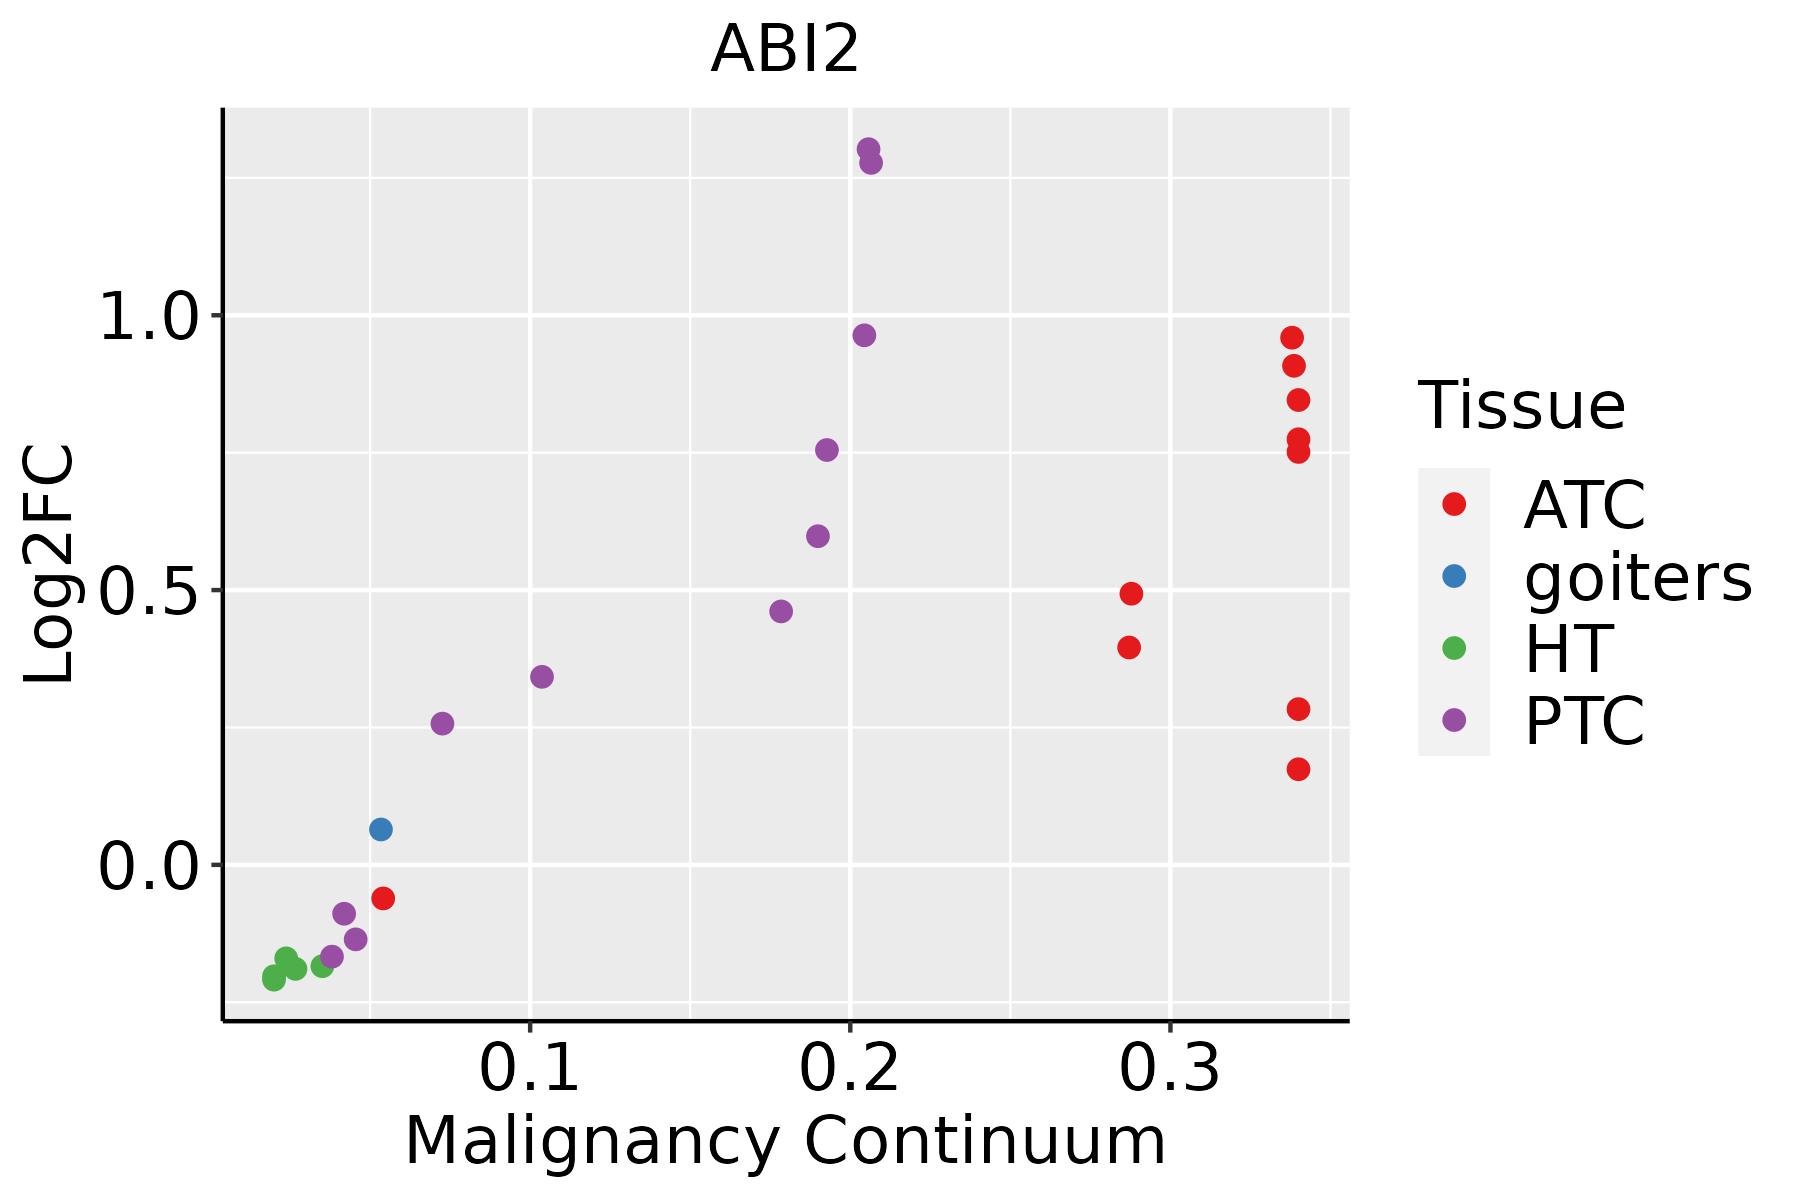 | ATC: Anaplastic thyroid cancer |
| HT: Hashimoto's thyroiditis | ||
| PTC: Papillary thyroid cancer |
| ∗log2FC in expression of this searched gene in stem-like cells from each diseased tissue sample relative to stem-like cells in normal samples in each tissue plotted against the malignancy continuum. Samples are colored based on if they are from different disease stage. |
Top |
Malignant transformation related pathway analysis |
| Find out the enriched GO biological processes and KEGG pathways involved in transition from healthy to precancer to cancer |
| Tissue | Disease Stage | Enriched GO biological Processes |
| Colorectum | AD |  |
| Colorectum | SER |  |
| Colorectum | MSS |  |
| Colorectum | MSI-H |  |
| Colorectum | FAP |  |
| ∗Top 15 enriched GO BP terms are showed in the bar plot of each disease state in each tissue. Each row represents a significant GO biological process which is colored according to the -log10(p.adjust). |
| Page: 1 2 3 4 5 6 7 8 9 |
| GO ID | Tissue | Disease Stage | Description | Gene Ratio | Bg Ratio | pvalue | p.adjust | Count |
| GO:0043254111 | Esophagus | ESCC | regulation of protein-containing complex assembly | 278/8552 | 428/18723 | 3.81e-16 | 2.77e-14 | 278 |
| GO:0031334111 | Esophagus | ESCC | positive regulation of protein-containing complex assembly | 166/8552 | 237/18723 | 2.06e-14 | 1.07e-12 | 166 |
| GO:1902905111 | Esophagus | ESCC | positive regulation of supramolecular fiber organization | 142/8552 | 209/18723 | 5.51e-11 | 1.76e-09 | 142 |
| GO:1902903111 | Esophagus | ESCC | regulation of supramolecular fiber organization | 237/8552 | 383/18723 | 9.06e-11 | 2.75e-09 | 237 |
| GO:005149520 | Esophagus | ESCC | positive regulation of cytoskeleton organization | 147/8552 | 226/18723 | 2.93e-09 | 6.38e-08 | 147 |
| GO:0051258111 | Esophagus | ESCC | protein polymerization | 183/8552 | 297/18723 | 1.94e-08 | 3.75e-07 | 183 |
| GO:000701527 | Esophagus | ESCC | actin filament organization | 259/8552 | 442/18723 | 2.37e-08 | 4.50e-07 | 259 |
| GO:0032273111 | Esophagus | ESCC | positive regulation of protein polymerization | 95/8552 | 138/18723 | 2.97e-08 | 5.57e-07 | 95 |
| GO:003253520 | Esophagus | ESCC | regulation of cellular component size | 227/8552 | 383/18723 | 4.77e-08 | 8.60e-07 | 227 |
| GO:000726510 | Esophagus | ESCC | Ras protein signal transduction | 201/8552 | 337/18723 | 1.44e-07 | 2.30e-06 | 201 |
| GO:0032970111 | Esophagus | ESCC | regulation of actin filament-based process | 231/8552 | 397/18723 | 2.91e-07 | 4.20e-06 | 231 |
| GO:0032956111 | Esophagus | ESCC | regulation of actin cytoskeleton organization | 210/8552 | 358/18723 | 4.40e-07 | 6.00e-06 | 210 |
| GO:0032271111 | Esophagus | ESCC | regulation of protein polymerization | 143/8552 | 233/18723 | 9.21e-07 | 1.17e-05 | 143 |
| GO:000206420 | Esophagus | ESCC | epithelial cell development | 136/8552 | 220/18723 | 9.50e-07 | 1.21e-05 | 136 |
| GO:011005327 | Esophagus | ESCC | regulation of actin filament organization | 166/8552 | 278/18723 | 1.54e-06 | 1.85e-05 | 166 |
| GO:003134616 | Esophagus | ESCC | positive regulation of cell projection organization | 201/8552 | 353/18723 | 1.19e-05 | 1.11e-04 | 201 |
| GO:00166019 | Esophagus | ESCC | Rac protein signal transduction | 33/8552 | 42/18723 | 1.35e-05 | 1.23e-04 | 33 |
| GO:003083819 | Esophagus | ESCC | positive regulation of actin filament polymerization | 66/8552 | 99/18723 | 1.96e-05 | 1.72e-04 | 66 |
| GO:000815420 | Esophagus | ESCC | actin polymerization or depolymerization | 130/8552 | 218/18723 | 2.19e-05 | 1.88e-04 | 130 |
| GO:0030041110 | Esophagus | ESCC | actin filament polymerization | 114/8552 | 191/18723 | 6.46e-05 | 4.92e-04 | 114 |
| Page: 1 2 3 4 5 6 7 8 9 10 11 12 13 14 15 16 17 18 19 20 21 22 |
| Pathway ID | Tissue | Disease Stage | Description | Gene Ratio | Bg Ratio | pvalue | p.adjust | qvalue | Count |
| hsa0481028 | Esophagus | ESCC | Regulation of actin cytoskeleton | 133/4205 | 229/8465 | 5.94e-03 | 1.48e-02 | 7.56e-03 | 133 |
| hsa04810112 | Esophagus | ESCC | Regulation of actin cytoskeleton | 133/4205 | 229/8465 | 5.94e-03 | 1.48e-02 | 7.56e-03 | 133 |
| hsa0481021 | Liver | Cirrhotic | Regulation of actin cytoskeleton | 100/2530 | 229/8465 | 5.28e-06 | 5.50e-05 | 3.39e-05 | 100 |
| hsa0481031 | Liver | Cirrhotic | Regulation of actin cytoskeleton | 100/2530 | 229/8465 | 5.28e-06 | 5.50e-05 | 3.39e-05 | 100 |
| hsa0481041 | Liver | HCC | Regulation of actin cytoskeleton | 134/4020 | 229/8465 | 4.48e-04 | 1.94e-03 | 1.08e-03 | 134 |
| hsa0481051 | Liver | HCC | Regulation of actin cytoskeleton | 134/4020 | 229/8465 | 4.48e-04 | 1.94e-03 | 1.08e-03 | 134 |
| hsa0481043 | Oral cavity | NEOLP | Regulation of actin cytoskeleton | 55/1112 | 229/8465 | 4.12e-06 | 3.86e-05 | 2.42e-05 | 55 |
| hsa0481053 | Oral cavity | NEOLP | Regulation of actin cytoskeleton | 55/1112 | 229/8465 | 4.12e-06 | 3.86e-05 | 2.42e-05 | 55 |
| hsa0481020 | Prostate | BPH | Regulation of actin cytoskeleton | 80/1718 | 229/8465 | 1.23e-07 | 1.31e-06 | 8.10e-07 | 80 |
| hsa04810110 | Prostate | BPH | Regulation of actin cytoskeleton | 80/1718 | 229/8465 | 1.23e-07 | 1.31e-06 | 8.10e-07 | 80 |
| Page: 1 |
Top |
Cell-cell communication analysis |
| Identification of potential cell-cell interactions between two cell types and their ligand-receptor pairs for different disease states |
| Ligand | Receptor | LRpair | Pathway | Tissue | Disease Stage |
| Page: 1 |
Top |
Single-cell gene regulatory network inference analysis |
| Find out the significant the regulons (TFs) and the target genes of each regulon across cell types for different disease states |
| TF | Cell Type | Tissue | Disease Stage | Target Gene | RSS | Regulon Activity |
| ∗The dot plots of a searched regulon are shown for all cell subpopulations in each disease state of each tissue based on the regulon specific score inferred using pySCENIC and by calculating the average expression. |
| Page: 1 |
Top |
Somatic mutation of malignant transformation related genes |
| Annotation of somatic variants for genes involved in malignant transformation |
| Hugo Symbol | Variant Class | Variant Classification | dbSNP RS | HGVSc | HGVSp | HGVSp Short | SWISSPROT | BIOTYPE | SIFT | PolyPhen | Tumor Sample Barcode | Tissue | Histology | Sex | Age | Stage | Therapy Types | Drugs | Outcome |
| ABI2 | SNV | Missense_Mutation | c.535N>G | p.Gln179Glu | p.Q179E | protein_coding | deleterious(0.01) | possibly_damaging(0.764) | TCGA-AC-A23H-01 | Breast | breast invasive carcinoma | Female | >=65 | I/II | Unknown | Unknown | PD | ||
| ABI2 | SNV | Missense_Mutation | c.403N>T | p.Arg135Cys | p.R135C | protein_coding | deleterious(0) | probably_damaging(0.991) | TCGA-AN-A046-01 | Breast | breast invasive carcinoma | Female | >=65 | I/II | Unknown | Unknown | SD | ||
| ABI2 | SNV | Missense_Mutation | c.1456N>A | p.Asp486Asn | p.D486N | protein_coding | deleterious(0.02) | probably_damaging(0.998) | TCGA-D8-A1XF-01 | Breast | breast invasive carcinoma | Female | <65 | I/II | Chemotherapy | adriamycin+cyclophosphamide | SD | ||
| ABI2 | SNV | Missense_Mutation | novel | c.736A>T | p.Ser246Cys | p.S246C | protein_coding | deleterious(0.04) | probably_damaging(0.987) | TCGA-2W-A8YY-01 | Cervix | cervical & endocervical cancer | Female | <65 | I/II | Chemotherapy | cisplatin | CR | |
| ABI2 | SNV | Missense_Mutation | novel | c.512T>A | p.Leu171Gln | p.L171Q | protein_coding | deleterious(0) | probably_damaging(0.991) | TCGA-VS-A8EJ-01 | Cervix | cervical & endocervical cancer | Female | <65 | I/II | Chemotherapy | cisplatin | PD | |
| ABI2 | SNV | Missense_Mutation | novel | c.1525N>G | p.Met509Val | p.M509V | protein_coding | deleterious(0.05) | possibly_damaging(0.841) | TCGA-5M-AAT6-01 | Colorectum | colon adenocarcinoma | Female | <65 | III/IV | Unknown | Unknown | PD | |
| ABI2 | SNV | Missense_Mutation | c.403C>T | p.Arg135Cys | p.R135C | protein_coding | deleterious(0) | probably_damaging(0.991) | TCGA-AA-3510-01 | Colorectum | colon adenocarcinoma | Male | >=65 | I/II | Unknown | Unknown | SD | ||
| ABI2 | SNV | Missense_Mutation | c.1185N>T | p.Gln395His | p.Q395H | protein_coding | deleterious_low_confidence(0) | probably_damaging(0.996) | TCGA-CM-5344-01 | Colorectum | colon adenocarcinoma | Female | <65 | III/IV | Chemotherapy | oxaliplatin | SD | ||
| ABI2 | SNV | Missense_Mutation | c.596N>A | p.Arg199His | p.R199H | protein_coding | deleterious(0.03) | possibly_damaging(0.847) | TCGA-F4-6570-01 | Colorectum | colon adenocarcinoma | Female | >=65 | I/II | Unknown | Unknown | SD | ||
| ABI2 | SNV | Missense_Mutation | novel | c.436N>A | p.Leu146Ile | p.L146I | protein_coding | deleterious(0) | probably_damaging(0.965) | TCGA-AG-A002-01 | Colorectum | rectum adenocarcinoma | Male | <65 | I/II | Unknown | Unknown | SD |
| Page: 1 2 3 4 |
Top |
Related drugs of malignant transformation related genes |
| Identification of chemicals and drugs interact with genes involved in malignant transfromation |
| (DGIdb 4.0) |
| Entrez ID | Symbol | Category | Interaction Types | Drug Claim Name | Drug Name | PMIDs |
| Page: 1 |

Copyright 2023-Present -The University of Texas Health Science Center at Houston |