| Tissue | Expression Dynamics | Abbreviation |
| Cervix | 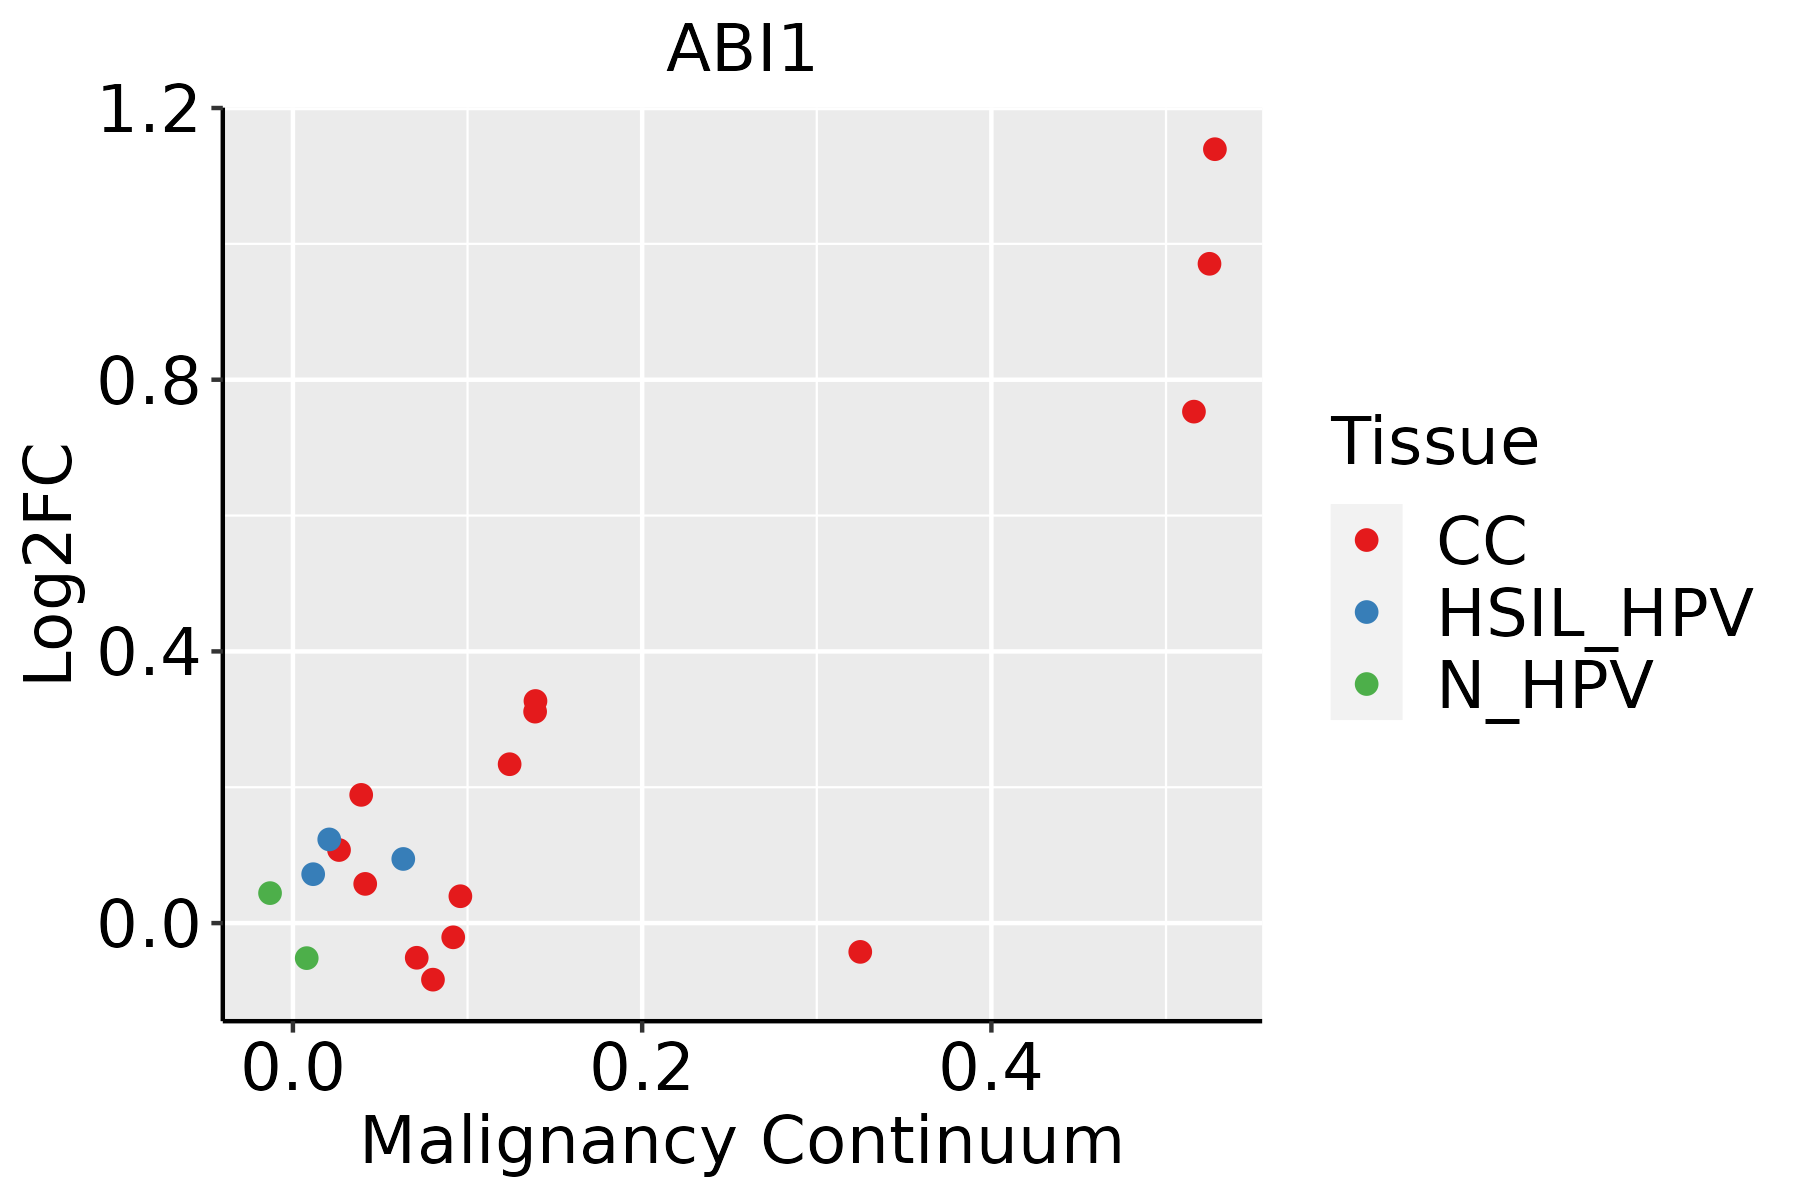 | CC: Cervix cancer |
| HSIL_HPV: HPV-infected high-grade squamous intraepithelial lesions |
| N_HPV: HPV-infected normal cervix |
| Colorectum (GSE201348) |  | FAP: Familial adenomatous polyposis |
| CRC: Colorectal cancer |
| Colorectum (HTA11) |  | AD: Adenomas |
| SER: Sessile serrated lesions |
| MSI-H: Microsatellite-high colorectal cancer |
| MSS: Microsatellite stable colorectal cancer |
| Esophagus | 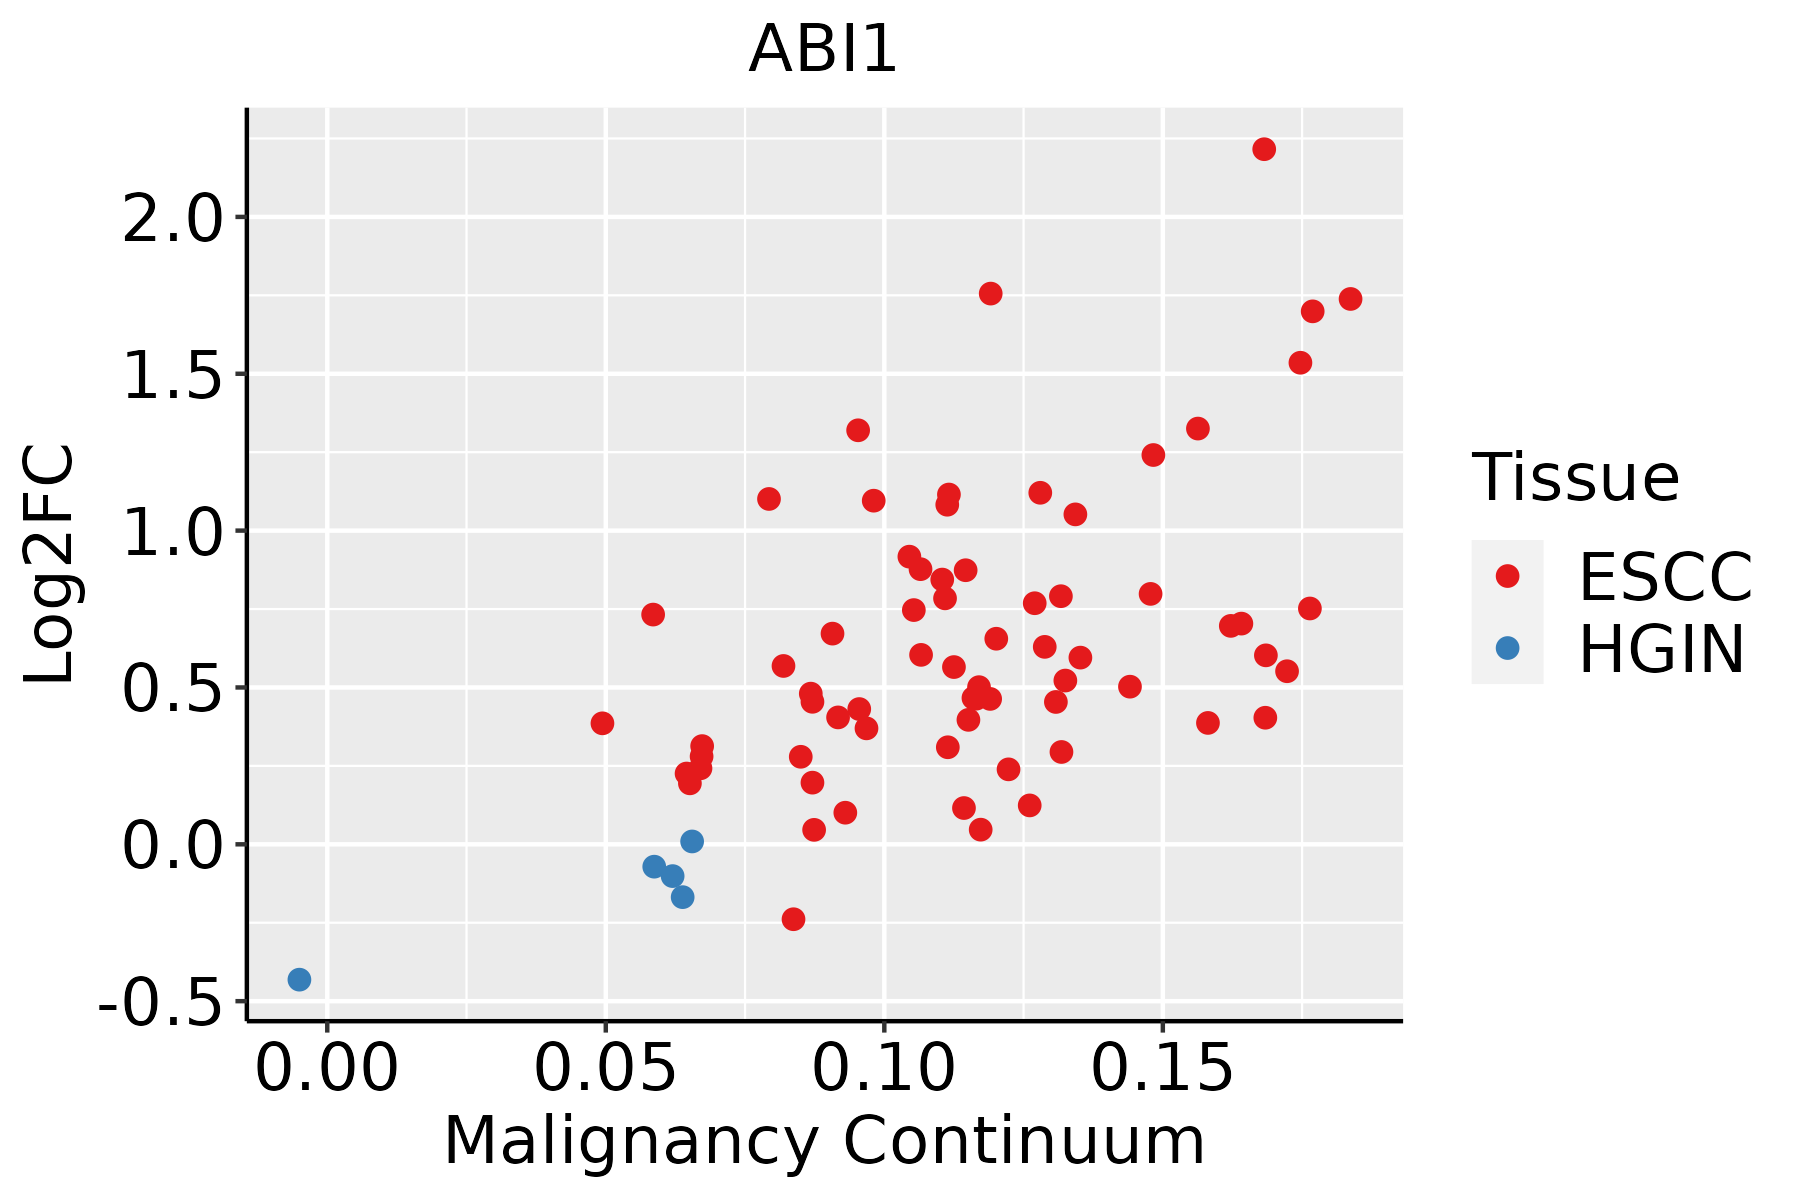 | ESCC: Esophageal squamous cell carcinoma |
| HGIN: High-grade intraepithelial neoplasias |
| LGIN: Low-grade intraepithelial neoplasias |
| Liver |  | HCC: Hepatocellular carcinoma |
| NAFLD: Non-alcoholic fatty liver disease |
| Oral Cavity | 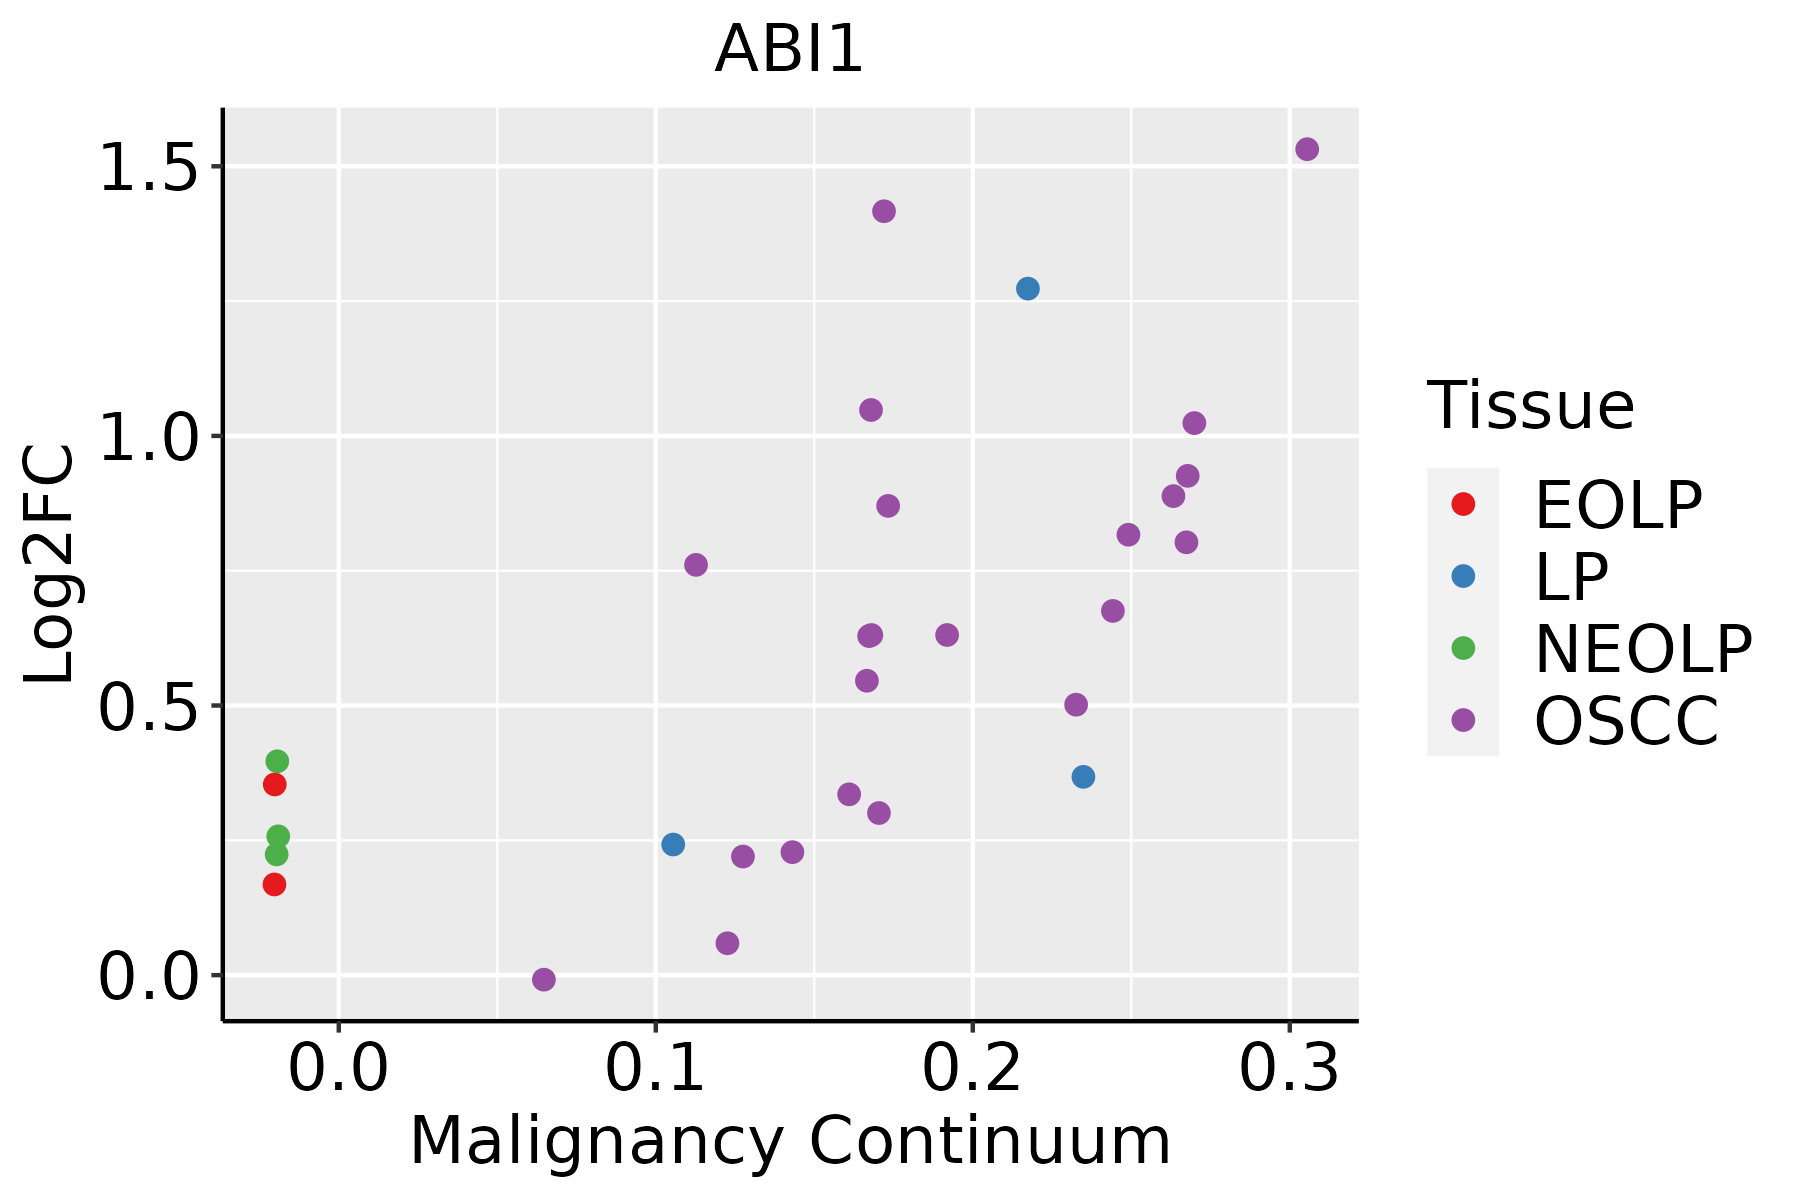 | EOLP: Erosive Oral lichen planus |
| LP: leukoplakia |
| NEOLP: Non-erosive oral lichen planus |
| OSCC: Oral squamous cell carcinoma |
| Prostate |  | BPH: Benign Prostatic Hyperplasia |
| Skin | 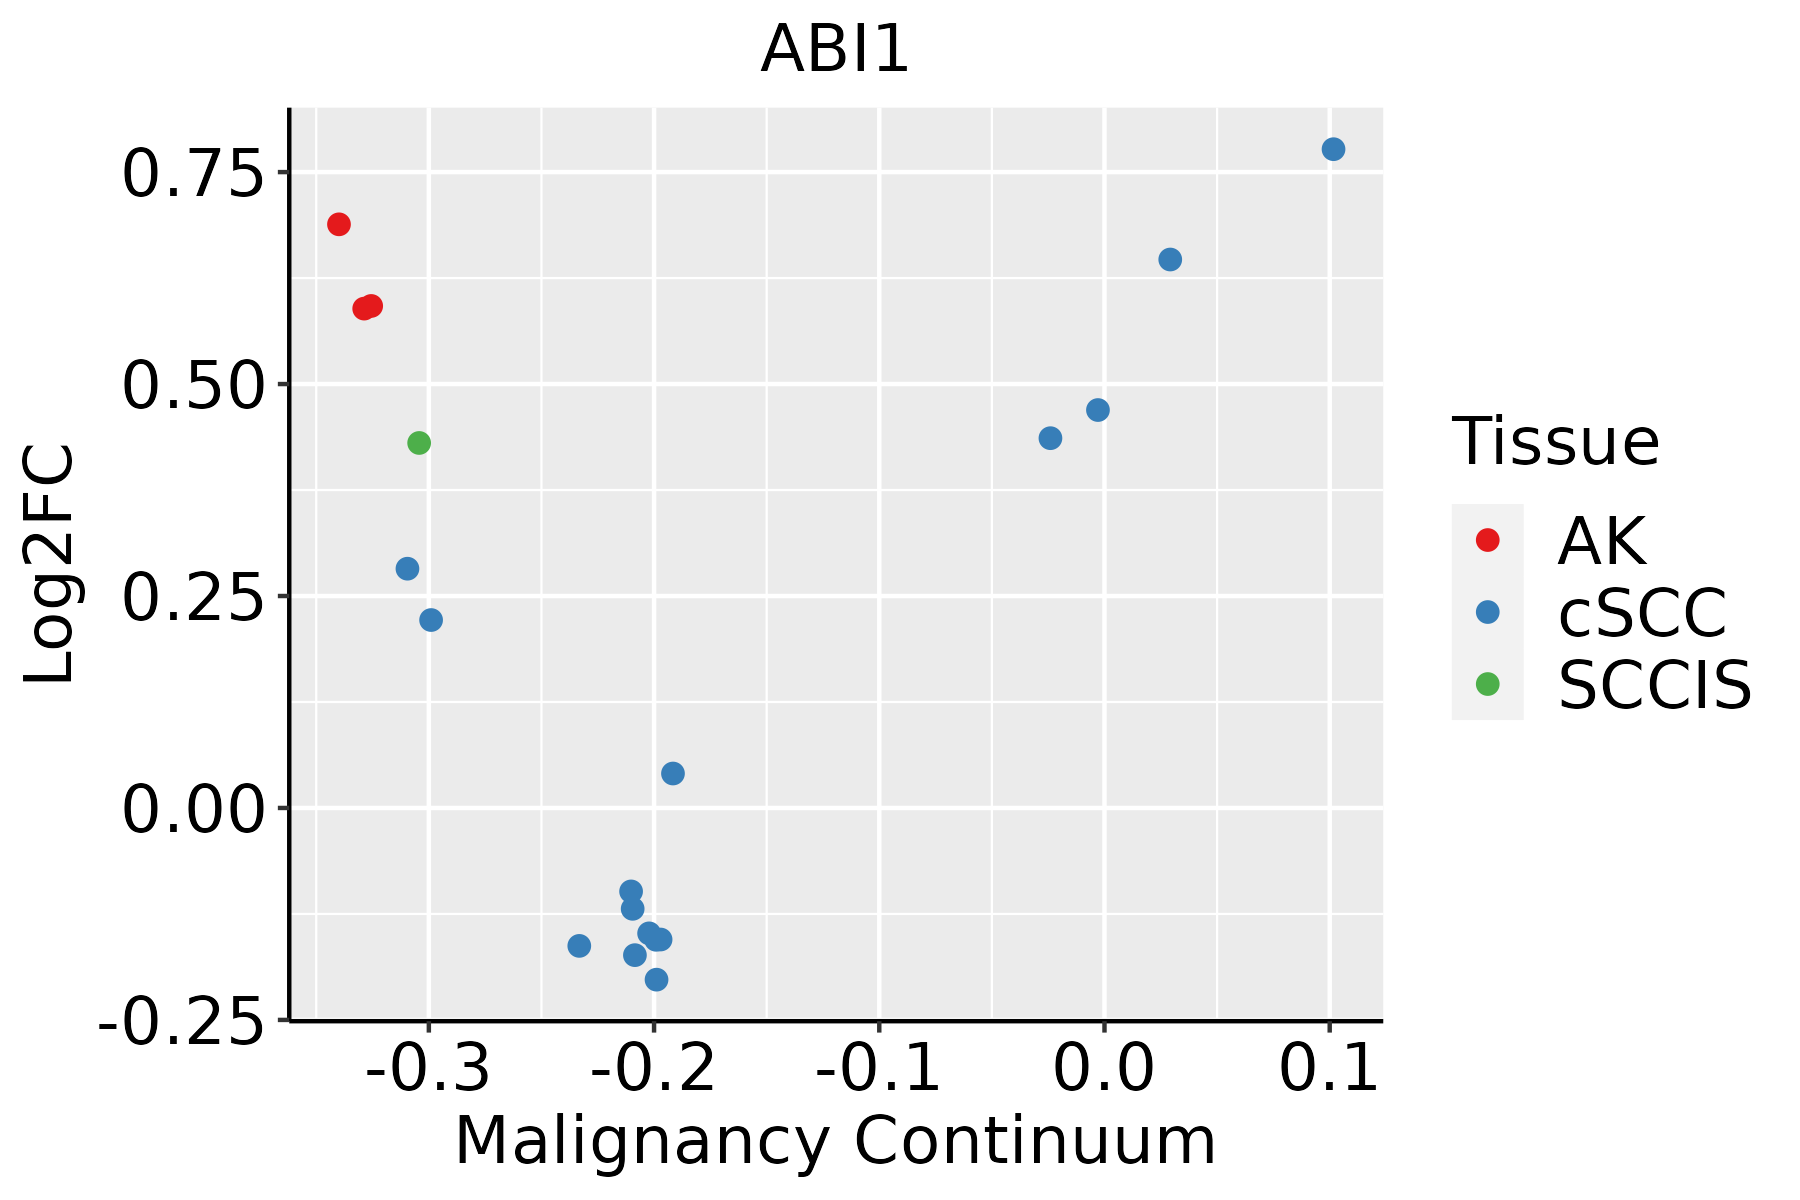 | AK: Actinic keratosis |
| cSCC: Cutaneous squamous cell carcinoma |
| SCCIS:squamous cell carcinoma in situ |
| GO ID | Tissue | Disease Stage | Description | Gene Ratio | Bg Ratio | pvalue | p.adjust | Count |
| GO:000701510 | Cervix | CC | actin filament organization | 109/2311 | 442/18723 | 4.92e-13 | 2.45e-10 | 109 |
| GO:003367410 | Cervix | CC | positive regulation of kinase activity | 101/2311 | 467/18723 | 8.66e-09 | 7.22e-07 | 101 |
| GO:00975817 | Cervix | CC | lamellipodium organization | 31/2311 | 90/18723 | 4.57e-08 | 2.76e-06 | 31 |
| GO:00458608 | Cervix | CC | positive regulation of protein kinase activity | 85/2311 | 386/18723 | 5.61e-08 | 3.29e-06 | 85 |
| GO:003009910 | Cervix | CC | myeloid cell differentiation | 83/2311 | 381/18723 | 1.31e-07 | 6.42e-06 | 83 |
| GO:00163587 | Cervix | CC | dendrite development | 58/2311 | 243/18723 | 4.52e-07 | 1.76e-05 | 58 |
| GO:00081549 | Cervix | CC | actin polymerization or depolymerization | 51/2311 | 218/18723 | 4.05e-06 | 1.05e-04 | 51 |
| GO:00488135 | Cervix | CC | dendrite morphogenesis | 30/2311 | 146/18723 | 3.27e-03 | 2.13e-02 | 30 |
| GO:003009925 | Cervix | N_HPV | myeloid cell differentiation | 33/534 | 381/18723 | 1.61e-08 | 2.52e-06 | 33 |
| GO:000701525 | Cervix | N_HPV | actin filament organization | 29/534 | 442/18723 | 3.00e-05 | 8.02e-04 | 29 |
| GO:00615151 | Cervix | N_HPV | myeloid cell development | 10/534 | 71/18723 | 3.17e-05 | 8.16e-04 | 10 |
| GO:00987511 | Cervix | N_HPV | bone cell development | 7/534 | 34/18723 | 4.07e-05 | 9.70e-04 | 7 |
| GO:00603482 | Cervix | N_HPV | bone development | 15/534 | 205/18723 | 8.27e-04 | 1.02e-02 | 15 |
| GO:004586023 | Cervix | N_HPV | positive regulation of protein kinase activity | 22/534 | 386/18723 | 1.73e-03 | 1.75e-02 | 22 |
| GO:003367422 | Cervix | N_HPV | positive regulation of kinase activity | 25/534 | 467/18723 | 2.05e-03 | 1.98e-02 | 25 |
| GO:0030219 | Cervix | N_HPV | megakaryocyte differentiation | 6/534 | 57/18723 | 5.54e-03 | 3.94e-02 | 6 |
| GO:0007015 | Colorectum | AD | actin filament organization | 167/3918 | 442/18723 | 1.65e-16 | 7.94e-14 | 167 |
| GO:0008154 | Colorectum | AD | actin polymerization or depolymerization | 90/3918 | 218/18723 | 6.14e-12 | 8.23e-10 | 90 |
| GO:0030099 | Colorectum | AD | myeloid cell differentiation | 119/3918 | 381/18723 | 1.24e-06 | 4.01e-05 | 119 |
| GO:0097581 | Colorectum | AD | lamellipodium organization | 35/3918 | 90/18723 | 7.39e-05 | 1.18e-03 | 35 |
| Pathway ID | Tissue | Disease Stage | Description | Gene Ratio | Bg Ratio | pvalue | p.adjust | qvalue | Count |
| hsa0513020 | Cervix | CC | Pathogenic Escherichia coli infection | 63/1267 | 197/8465 | 9.28e-10 | 2.00e-08 | 1.19e-08 | 63 |
| hsa0513220 | Cervix | CC | Salmonella infection | 74/1267 | 249/8465 | 1.33e-09 | 2.54e-08 | 1.50e-08 | 74 |
| hsa05130110 | Cervix | CC | Pathogenic Escherichia coli infection | 63/1267 | 197/8465 | 9.28e-10 | 2.00e-08 | 1.19e-08 | 63 |
| hsa05132110 | Cervix | CC | Salmonella infection | 74/1267 | 249/8465 | 1.33e-09 | 2.54e-08 | 1.50e-08 | 74 |
| hsa0513044 | Cervix | N_HPV | Pathogenic Escherichia coli infection | 25/349 | 197/8465 | 4.71e-07 | 8.00e-06 | 6.25e-06 | 25 |
| hsa0513244 | Cervix | N_HPV | Salmonella infection | 28/349 | 249/8465 | 1.18e-06 | 1.64e-05 | 1.28e-05 | 28 |
| hsa0513054 | Cervix | N_HPV | Pathogenic Escherichia coli infection | 25/349 | 197/8465 | 4.71e-07 | 8.00e-06 | 6.25e-06 | 25 |
| hsa0513254 | Cervix | N_HPV | Salmonella infection | 28/349 | 249/8465 | 1.18e-06 | 1.64e-05 | 1.28e-05 | 28 |
| hsa051324 | Colorectum | MSS | Salmonella infection | 92/1875 | 249/8465 | 5.23e-08 | 9.74e-07 | 5.97e-07 | 92 |
| hsa051304 | Colorectum | MSS | Pathogenic Escherichia coli infection | 73/1875 | 197/8465 | 1.10e-06 | 1.48e-05 | 9.06e-06 | 73 |
| hsa051325 | Colorectum | MSS | Salmonella infection | 92/1875 | 249/8465 | 5.23e-08 | 9.74e-07 | 5.97e-07 | 92 |
| hsa051305 | Colorectum | MSS | Pathogenic Escherichia coli infection | 73/1875 | 197/8465 | 1.10e-06 | 1.48e-05 | 9.06e-06 | 73 |
| hsa051308 | Colorectum | FAP | Pathogenic Escherichia coli infection | 62/1404 | 197/8465 | 1.37e-07 | 3.08e-06 | 1.87e-06 | 62 |
| hsa051328 | Colorectum | FAP | Salmonella infection | 67/1404 | 249/8465 | 2.04e-05 | 2.52e-04 | 1.53e-04 | 67 |
| hsa051309 | Colorectum | FAP | Pathogenic Escherichia coli infection | 62/1404 | 197/8465 | 1.37e-07 | 3.08e-06 | 1.87e-06 | 62 |
| hsa051329 | Colorectum | FAP | Salmonella infection | 67/1404 | 249/8465 | 2.04e-05 | 2.52e-04 | 1.53e-04 | 67 |
| hsa0513010 | Colorectum | CRC | Pathogenic Escherichia coli infection | 47/1091 | 197/8465 | 1.49e-05 | 3.84e-04 | 2.60e-04 | 47 |
| hsa0513210 | Colorectum | CRC | Salmonella infection | 48/1091 | 249/8465 | 2.43e-03 | 1.69e-02 | 1.15e-02 | 48 |
| hsa0513011 | Colorectum | CRC | Pathogenic Escherichia coli infection | 47/1091 | 197/8465 | 1.49e-05 | 3.84e-04 | 2.60e-04 | 47 |
| hsa0513211 | Colorectum | CRC | Salmonella infection | 48/1091 | 249/8465 | 2.43e-03 | 1.69e-02 | 1.15e-02 | 48 |
| Hugo Symbol | Variant Class | Variant Classification | dbSNP RS | HGVSc | HGVSp | HGVSp Short | SWISSPROT | BIOTYPE | SIFT | PolyPhen | Tumor Sample Barcode | Tissue | Histology | Sex | Age | Stage | Therapy Types | Drugs | Outcome |
| ABI1 | SNV | Missense_Mutation | | c.356N>T | p.Ser119Leu | p.S119L | Q8IZP0 | protein_coding | tolerated(0.18) | benign(0.021) | TCGA-A8-A095-01 | Breast | breast invasive carcinoma | Female | <65 | I/II | Chemotherapy | 5-fluorouracil | CR |
| ABI1 | SNV | Missense_Mutation | rs772279539 | c.980N>T | p.Ser327Leu | p.S327L | Q8IZP0 | protein_coding | tolerated(0.2) | probably_damaging(0.99) | TCGA-AN-A046-01 | Breast | breast invasive carcinoma | Female | >=65 | I/II | Unknown | Unknown | SD |
| ABI1 | SNV | Missense_Mutation | | c.1240N>T | p.Pro414Ser | p.P414S | Q8IZP0 | protein_coding | deleterious(0.03) | possibly_damaging(0.802) | TCGA-BH-A0H9-01 | Breast | breast invasive carcinoma | Female | >=65 | I/II | Hormone Therapy | arimidex | SD |
| ABI1 | SNV | Missense_Mutation | rs752428017 | c.895G>T | p.Val299Leu | p.V299L | Q8IZP0 | protein_coding | tolerated(0.74) | benign(0) | TCGA-E2-A14N-01 | Breast | breast invasive carcinoma | Female | <65 | I/II | Chemotherapy | cyclophosphamide | SD |
| ABI1 | insertion | Nonsense_Mutation | novel | c.720-1_720insGAGAGCATTGAATTAGCCCCTTGAT | p.Ser240ArgfsTer6 | p.S240Rfs*6 | Q8IZP0 | protein_coding | | | TCGA-B6-A0I6-01 | Breast | breast invasive carcinoma | Female | <65 | I/II | Unknown | Unknown | PD |
| ABI1 | SNV | Missense_Mutation | novel | c.1015G>A | p.Val339Met | p.V339M | Q8IZP0 | protein_coding | deleterious(0) | benign(0.04) | TCGA-EA-A410-01 | Cervix | cervical & endocervical cancer | Female | <65 | I/II | Unknown | Unknown | SD |
| ABI1 | SNV | Missense_Mutation | | c.830N>G | p.Ser277Cys | p.S277C | Q8IZP0 | protein_coding | tolerated(0.1) | possibly_damaging(0.7) | TCGA-IR-A3LH-01 | Cervix | cervical & endocervical cancer | Female | <65 | I/II | Chemotherapy | cisplatin | CR |
| ABI1 | SNV | Missense_Mutation | novel | c.1031C>T | p.Ser344Phe | p.S344F | Q8IZP0 | protein_coding | tolerated(0.13) | possibly_damaging(0.477) | TCGA-VS-A8EK-01 | Cervix | cervical & endocervical cancer | Female | >=65 | I/II | Chemotherapy | cisplatin | PD |
| ABI1 | SNV | Missense_Mutation | novel | c.1387N>A | p.Asp463Asn | p.D463N | Q8IZP0 | protein_coding | tolerated(0.21) | probably_damaging(1) | TCGA-VS-A958-01 | Cervix | cervical & endocervical cancer | Female | <65 | I/II | Chemotherapy | cisplatin | CR |
| ABI1 | SNV | Missense_Mutation | | c.1265N>C | p.Glu422Ala | p.E422A | Q8IZP0 | protein_coding | tolerated(0.09) | benign(0.118) | TCGA-AA-3977-01 | Colorectum | colon adenocarcinoma | Male | >=65 | I/II | Unknown | Unknown | SD |


