
|
|||||
|
 | |
| |
| |
| |
| |
| |
|
Gene: ABHD8 |
Gene summary for ABHD8 |
| Gene information | Species | Human | Gene symbol | ABHD8 | Gene ID | 79575 |
| Gene name | abhydrolase domain containing 8 | |
| Gene Alias | ABHD8 | |
| Cytomap | 19p13.11 | |
| Gene Type | protein-coding | GO ID | GO:0006629 | UniProtAcc | B2C6G3 |
Top |
Malignant transformation analysis |
| Identification of the aberrant gene expression in precancerous and cancerous lesions by comparing the gene expression of stem-like cells in diseased tissues with normal stem cells |
| Entrez ID | Symbol | Replicates | Species | Organ | Tissue | Adj P-value | Log2FC | Malignancy |
| 79575 | ABHD8 | LZE24T | Human | Esophagus | ESCC | 1.41e-12 | 2.32e-01 | 0.0596 |
| 79575 | ABHD8 | P1T-E | Human | Esophagus | ESCC | 2.88e-10 | 3.68e-01 | 0.0875 |
| 79575 | ABHD8 | P2T-E | Human | Esophagus | ESCC | 8.83e-12 | 1.79e-01 | 0.1177 |
| 79575 | ABHD8 | P4T-E | Human | Esophagus | ESCC | 6.05e-06 | 1.50e-01 | 0.1323 |
| 79575 | ABHD8 | P8T-E | Human | Esophagus | ESCC | 1.05e-21 | 3.21e-01 | 0.0889 |
| 79575 | ABHD8 | P9T-E | Human | Esophagus | ESCC | 3.19e-10 | 1.69e-01 | 0.1131 |
| 79575 | ABHD8 | P10T-E | Human | Esophagus | ESCC | 2.74e-29 | 4.99e-01 | 0.116 |
| 79575 | ABHD8 | P11T-E | Human | Esophagus | ESCC | 4.57e-13 | 3.89e-01 | 0.1426 |
| 79575 | ABHD8 | P12T-E | Human | Esophagus | ESCC | 3.28e-20 | 3.22e-01 | 0.1122 |
| 79575 | ABHD8 | P15T-E | Human | Esophagus | ESCC | 4.52e-11 | 2.23e-01 | 0.1149 |
| 79575 | ABHD8 | P16T-E | Human | Esophagus | ESCC | 1.67e-13 | 2.36e-01 | 0.1153 |
| 79575 | ABHD8 | P20T-E | Human | Esophagus | ESCC | 1.60e-03 | 5.50e-02 | 0.1124 |
| 79575 | ABHD8 | P21T-E | Human | Esophagus | ESCC | 5.08e-29 | 3.58e-01 | 0.1617 |
| 79575 | ABHD8 | P22T-E | Human | Esophagus | ESCC | 1.80e-10 | 1.35e-01 | 0.1236 |
| 79575 | ABHD8 | P23T-E | Human | Esophagus | ESCC | 4.45e-07 | 2.36e-01 | 0.108 |
| 79575 | ABHD8 | P24T-E | Human | Esophagus | ESCC | 5.78e-08 | 9.24e-02 | 0.1287 |
| 79575 | ABHD8 | P26T-E | Human | Esophagus | ESCC | 4.66e-40 | 2.36e-01 | 0.1276 |
| 79575 | ABHD8 | P27T-E | Human | Esophagus | ESCC | 5.50e-24 | 2.85e-01 | 0.1055 |
| 79575 | ABHD8 | P28T-E | Human | Esophagus | ESCC | 9.17e-16 | 2.32e-01 | 0.1149 |
| 79575 | ABHD8 | P30T-E | Human | Esophagus | ESCC | 4.05e-06 | 2.42e-01 | 0.137 |
| Page: 1 2 3 4 |
| Tissue | Expression Dynamics | Abbreviation |
| Esophagus | 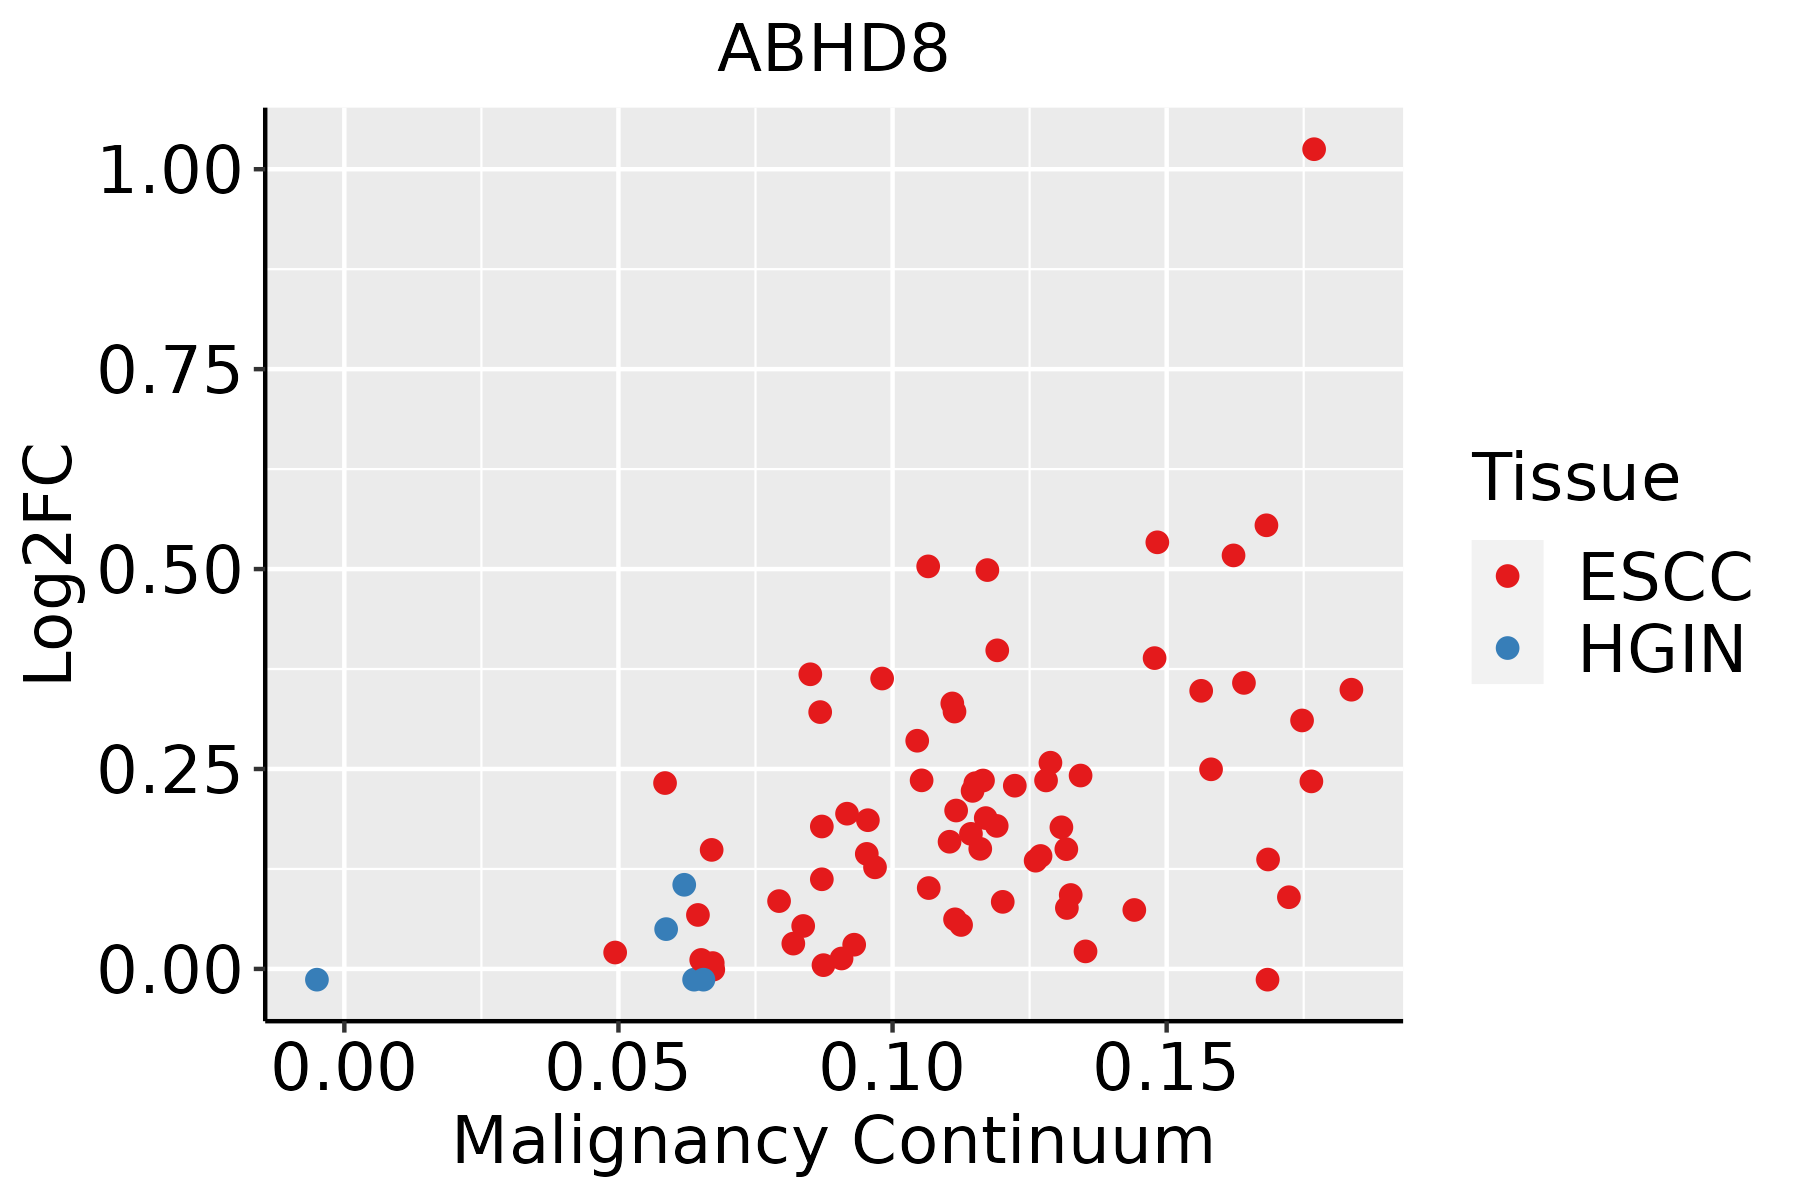 | ESCC: Esophageal squamous cell carcinoma |
| HGIN: High-grade intraepithelial neoplasias | ||
| LGIN: Low-grade intraepithelial neoplasias | ||
| Liver | 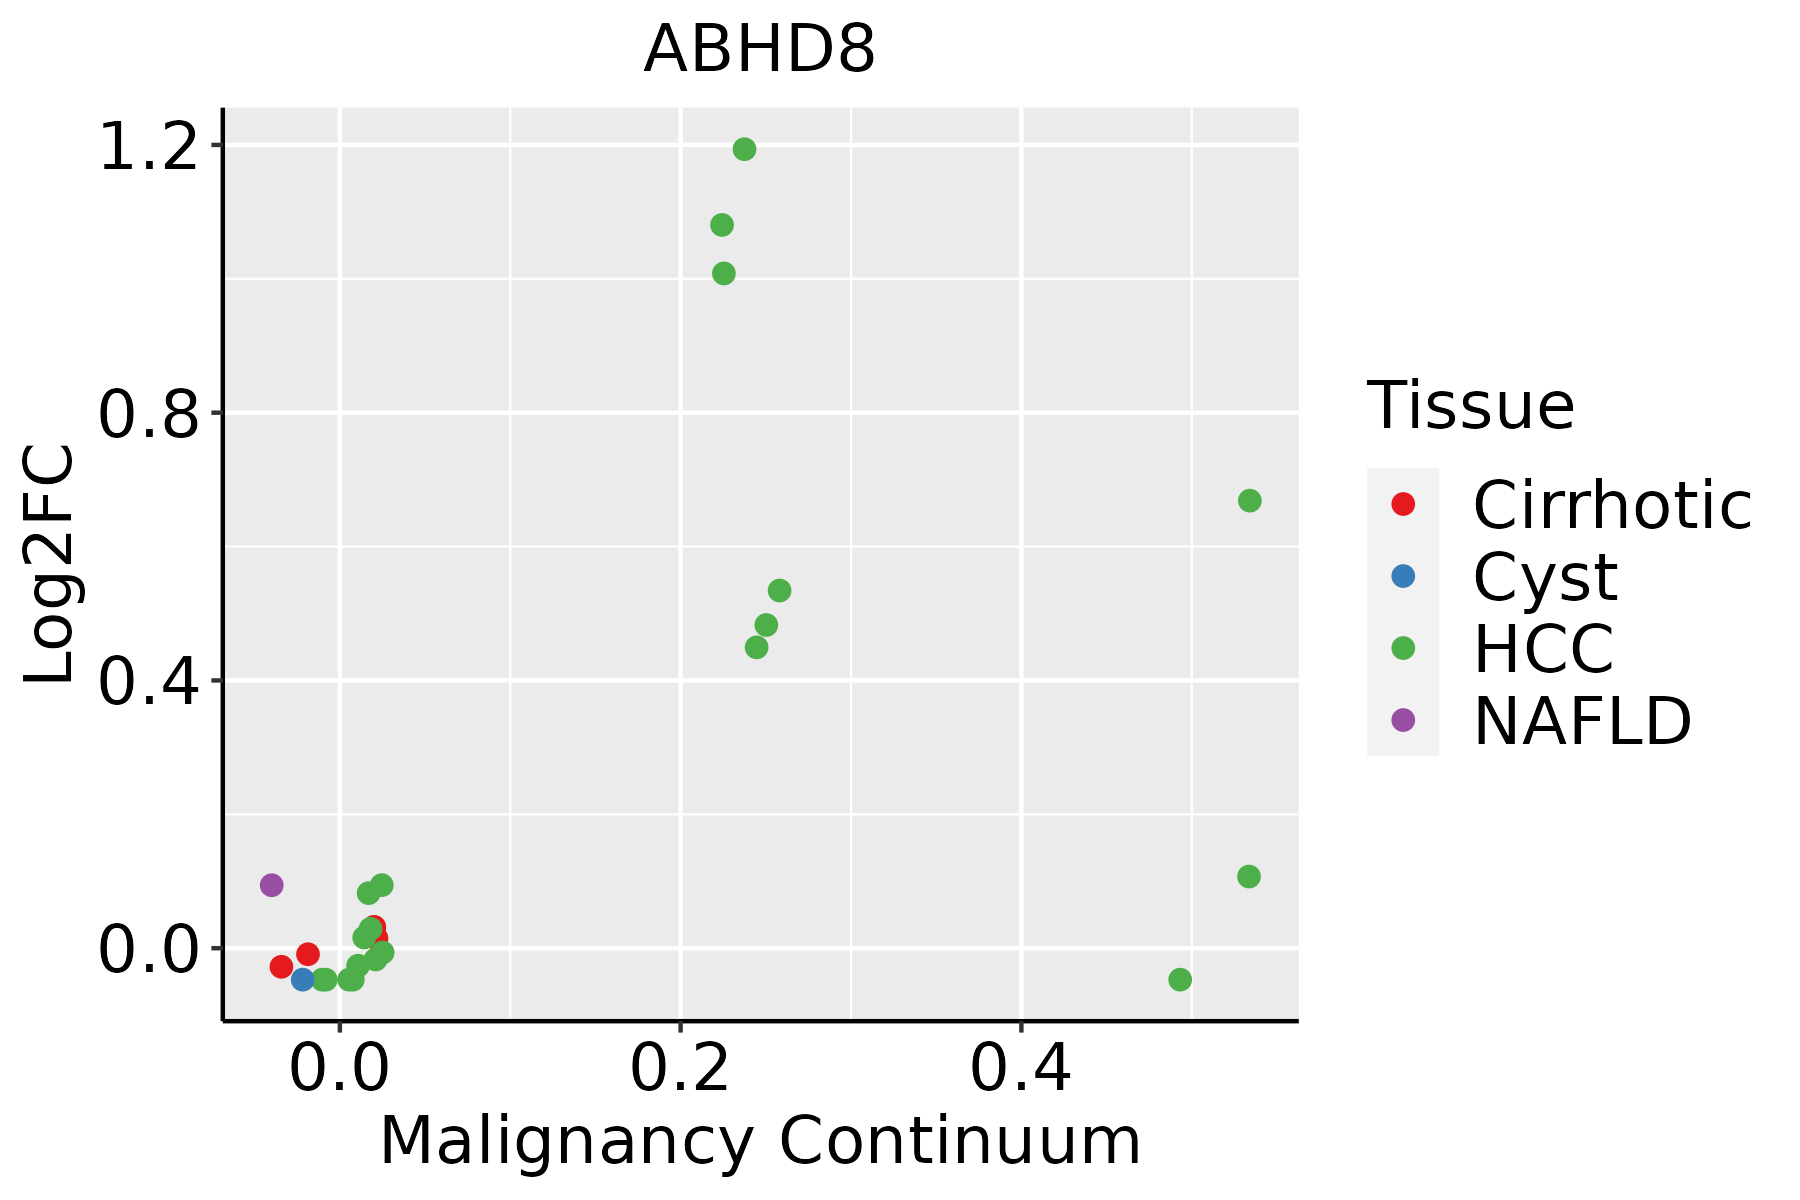 | HCC: Hepatocellular carcinoma |
| NAFLD: Non-alcoholic fatty liver disease | ||
| Oral Cavity |  | EOLP: Erosive Oral lichen planus |
| LP: leukoplakia | ||
| NEOLP: Non-erosive oral lichen planus | ||
| OSCC: Oral squamous cell carcinoma |
| ∗log2FC in expression of this searched gene in stem-like cells from each diseased tissue sample relative to stem-like cells in normal samples in each tissue plotted against the malignancy continuum. Samples are colored based on if they are from different disease stage. |
Top |
Malignant transformation related pathway analysis |
| Find out the enriched GO biological processes and KEGG pathways involved in transition from healthy to precancer to cancer |
| Tissue | Disease Stage | Enriched GO biological Processes |
| Colorectum | AD |  |
| Colorectum | SER |  |
| Colorectum | MSS |  |
| Colorectum | MSI-H |  |
| Colorectum | FAP |  |
| ∗Top 15 enriched GO BP terms are showed in the bar plot of each disease state in each tissue. Each row represents a significant GO biological process which is colored according to the -log10(p.adjust). |
| Page: 1 2 3 4 5 6 7 8 9 |
| GO ID | Tissue | Disease Stage | Description | Gene Ratio | Bg Ratio | pvalue | p.adjust | Count |
| GO:00086544 | Esophagus | ESCC | phospholipid biosynthetic process | 162/8552 | 253/18723 | 2.59e-09 | 5.73e-08 | 162 |
| GO:00464744 | Esophagus | ESCC | glycerophospholipid biosynthetic process | 135/8552 | 211/18723 | 5.75e-08 | 1.02e-06 | 135 |
| GO:00450175 | Esophagus | ESCC | glycerolipid biosynthetic process | 154/8552 | 252/18723 | 5.20e-07 | 6.96e-06 | 154 |
| GO:00066446 | Esophagus | ESCC | phospholipid metabolic process | 218/8552 | 383/18723 | 5.37e-06 | 5.59e-05 | 218 |
| GO:00066505 | Esophagus | ESCC | glycerophospholipid metabolic process | 174/8552 | 306/18723 | 4.92e-05 | 3.85e-04 | 174 |
| GO:00066541 | Esophagus | ESCC | phosphatidic acid biosynthetic process | 26/8552 | 33/18723 | 1.06e-04 | 7.43e-04 | 26 |
| GO:00464733 | Esophagus | ESCC | phosphatidic acid metabolic process | 28/8552 | 37/18723 | 2.00e-04 | 1.26e-03 | 28 |
| GO:00464864 | Esophagus | ESCC | glycerolipid metabolic process | 211/8552 | 392/18723 | 6.51e-04 | 3.46e-03 | 211 |
| GO:00086542 | Liver | HCC | phospholipid biosynthetic process | 150/7958 | 253/18723 | 4.77e-08 | 1.03e-06 | 150 |
| GO:00066444 | Liver | HCC | phospholipid metabolic process | 214/7958 | 383/18723 | 7.25e-08 | 1.48e-06 | 214 |
| GO:00550882 | Liver | HCC | lipid homeostasis | 103/7958 | 167/18723 | 4.27e-07 | 7.18e-06 | 103 |
| GO:004648611 | Liver | HCC | glycerolipid metabolic process | 215/7958 | 392/18723 | 4.54e-07 | 7.49e-06 | 215 |
| GO:004501711 | Liver | HCC | glycerolipid biosynthetic process | 143/7958 | 252/18723 | 3.27e-06 | 4.31e-05 | 143 |
| GO:00066504 | Liver | HCC | glycerophospholipid metabolic process | 168/7958 | 306/18723 | 7.27e-06 | 8.62e-05 | 168 |
| GO:004647411 | Liver | HCC | glycerophospholipid biosynthetic process | 121/7958 | 211/18723 | 9.12e-06 | 1.06e-04 | 121 |
| GO:0006654 | Liver | HCC | phosphatidic acid biosynthetic process | 23/7958 | 33/18723 | 1.46e-03 | 7.75e-03 | 23 |
| GO:00464732 | Liver | HCC | phosphatidic acid metabolic process | 24/7958 | 37/18723 | 5.03e-03 | 2.11e-02 | 24 |
| GO:00086543 | Oral cavity | OSCC | phospholipid biosynthetic process | 130/7305 | 253/18723 | 3.96e-05 | 3.46e-04 | 130 |
| GO:00464743 | Oral cavity | OSCC | glycerophospholipid biosynthetic process | 102/7305 | 211/18723 | 3.50e-03 | 1.48e-02 | 102 |
| GO:00066445 | Oral cavity | OSCC | phospholipid metabolic process | 175/7305 | 383/18723 | 4.21e-03 | 1.71e-02 | 175 |
| Page: 1 |
| Pathway ID | Tissue | Disease Stage | Description | Gene Ratio | Bg Ratio | pvalue | p.adjust | qvalue | Count |
| Page: 1 |
Top |
Cell-cell communication analysis |
| Identification of potential cell-cell interactions between two cell types and their ligand-receptor pairs for different disease states |
| Ligand | Receptor | LRpair | Pathway | Tissue | Disease Stage |
| Page: 1 |
Top |
Single-cell gene regulatory network inference analysis |
| Find out the significant the regulons (TFs) and the target genes of each regulon across cell types for different disease states |
| TF | Cell Type | Tissue | Disease Stage | Target Gene | RSS | Regulon Activity |
| ∗The dot plots of a searched regulon are shown for all cell subpopulations in each disease state of each tissue based on the regulon specific score inferred using pySCENIC and by calculating the average expression. |
| Page: 1 |
Top |
Somatic mutation of malignant transformation related genes |
| Annotation of somatic variants for genes involved in malignant transformation |
| Hugo Symbol | Variant Class | Variant Classification | dbSNP RS | HGVSc | HGVSp | HGVSp Short | SWISSPROT | BIOTYPE | SIFT | PolyPhen | Tumor Sample Barcode | Tissue | Histology | Sex | Age | Stage | Therapy Types | Drugs | Outcome |
| ABHD8 | SNV | Missense_Mutation | c.1207N>A | p.Glu403Lys | p.E403K | Q96I13 | protein_coding | deleterious(0) | probably_damaging(0.992) | TCGA-D8-A1JA-01 | Breast | breast invasive carcinoma | Female | <65 | III/IV | Chemotherapy | adriamycin | PD | |
| ABHD8 | insertion | Frame_Shift_Ins | novel | c.700_701insAAAATACAAAAATTAGCCAG | p.Met234LysfsTer42 | p.M234Kfs*42 | Q96I13 | protein_coding | TCGA-A2-A0CT-01 | Breast | breast invasive carcinoma | Female | >=65 | I/II | Chemotherapy | cytoxan | SD | ||
| ABHD8 | insertion | Frame_Shift_Ins | novel | c.725_726insTTTAAAAAAGAAAAAAAAATCCG | p.Lys243LeufsTer34 | p.K243Lfs*34 | Q96I13 | protein_coding | TCGA-A2-A0D1-01 | Breast | breast invasive carcinoma | Female | >=65 | I/II | Chemotherapy | taxotere | SD | ||
| ABHD8 | insertion | Nonsense_Mutation | novel | c.663_664insAAACCCCGTCTCTACCAAAAATACAAAAATTAGCCAGACGTGGT | p.Ala222LysfsTer11 | p.A222Kfs*11 | Q96I13 | protein_coding | TCGA-BH-A0B4-01 | Breast | breast invasive carcinoma | Male | >=65 | III/IV | Hormone Therapy | tamoxiphen | SD | ||
| ABHD8 | SNV | Missense_Mutation | novel | c.1015N>T | p.Arg339Trp | p.R339W | Q96I13 | protein_coding | deleterious(0) | probably_damaging(0.991) | TCGA-2W-A8YY-01 | Cervix | cervical & endocervical cancer | Female | <65 | I/II | Chemotherapy | cisplatin | CR |
| ABHD8 | SNV | Missense_Mutation | novel | c.111G>C | p.Glu37Asp | p.E37D | Q96I13 | protein_coding | deleterious_low_confidence(0) | probably_damaging(0.967) | TCGA-C5-A2LZ-01 | Cervix | cervical & endocervical cancer | Female | >=65 | III/IV | Unknown | Unknown | PD |
| ABHD8 | SNV | Missense_Mutation | c.1045G>A | p.Glu349Lys | p.E349K | Q96I13 | protein_coding | deleterious(0) | possibly_damaging(0.453) | TCGA-C5-A7CL-01 | Cervix | cervical & endocervical cancer | Female | <65 | III/IV | Chemotherapy | cisplatin | PD | |
| ABHD8 | SNV | Missense_Mutation | rs138969474 | c.1054N>A | p.Glu352Lys | p.E352K | Q96I13 | protein_coding | deleterious(0.03) | benign(0.369) | TCGA-DS-A1OB-01 | Cervix | cervical & endocervical cancer | Female | <65 | I/II | Chemotherapy | carboplatin | PD |
| ABHD8 | SNV | Missense_Mutation | novel | c.993C>G | p.Phe331Leu | p.F331L | Q96I13 | protein_coding | deleterious(0.02) | benign(0.05) | TCGA-VS-A958-01 | Cervix | cervical & endocervical cancer | Female | <65 | I/II | Chemotherapy | cisplatin | CR |
| ABHD8 | SNV | Missense_Mutation | c.1207N>A | p.Glu403Lys | p.E403K | Q96I13 | protein_coding | deleterious(0) | probably_damaging(0.992) | TCGA-VS-A9U6-01 | Cervix | cervical & endocervical cancer | Female | <65 | I/II | Chemotherapy | cisplatin | PD |
| Page: 1 2 3 4 5 |
Top |
Related drugs of malignant transformation related genes |
| Identification of chemicals and drugs interact with genes involved in malignant transfromation |
| (DGIdb 4.0) |
| Entrez ID | Symbol | Category | Interaction Types | Drug Claim Name | Drug Name | PMIDs |
| Page: 1 |

Copyright 2023-Present -The University of Texas Health Science Center at Houston |