
|
|||||
|
 | |
| |
| |
| |
| |
| |
|
Gene: ABHD5 |
Gene summary for ABHD5 |
| Gene information | Species | Human | Gene symbol | ABHD5 | Gene ID | 51099 |
| Gene name | abhydrolase domain containing 5, lysophosphatidic acid acyltransferase | |
| Gene Alias | CGI58 | |
| Cytomap | 3p21.33 | |
| Gene Type | protein-coding | GO ID | GO:0006082 | UniProtAcc | A0A0S2Z5D6 |
Top |
Malignant transformation analysis |
| Identification of the aberrant gene expression in precancerous and cancerous lesions by comparing the gene expression of stem-like cells in diseased tissues with normal stem cells |
| Entrez ID | Symbol | Replicates | Species | Organ | Tissue | Adj P-value | Log2FC | Malignancy |
| 51099 | ABHD5 | AEH-subject1 | Human | Endometrium | AEH | 1.13e-07 | 3.10e-01 | -0.3059 |
| 51099 | ABHD5 | AEH-subject3 | Human | Endometrium | AEH | 6.00e-04 | 2.39e-01 | -0.2576 |
| 51099 | ABHD5 | AEH-subject5 | Human | Endometrium | AEH | 2.44e-04 | 2.79e-01 | -0.2953 |
| 51099 | ABHD5 | EEC-subject4 | Human | Endometrium | EEC | 1.19e-05 | 3.34e-01 | -0.2571 |
| 51099 | ABHD5 | EEC-subject5 | Human | Endometrium | EEC | 4.54e-03 | 2.29e-01 | -0.249 |
| 51099 | ABHD5 | GSM5276935 | Human | Endometrium | EEC | 3.10e-06 | 2.45e-01 | -0.123 |
| 51099 | ABHD5 | GSM5276937 | Human | Endometrium | EEC | 3.73e-02 | 2.98e-01 | -0.0897 |
| 51099 | ABHD5 | GSM6177620_NYU_UCEC1_lib3_lib3 | Human | Endometrium | EEC | 5.84e-03 | 7.58e-02 | -0.1883 |
| 51099 | ABHD5 | GSM6177621_NYU_UCEC2_lib1_lib1 | Human | Endometrium | EEC | 4.60e-02 | 2.04e-01 | -0.1934 |
| 51099 | ABHD5 | GSM6177622_NYU_UCEC3_lib1_lib1 | Human | Endometrium | EEC | 2.23e-03 | 8.34e-02 | -0.1917 |
| 51099 | ABHD5 | LZE3D | Human | Esophagus | HGIN | 1.09e-02 | 9.26e-01 | 0.0668 |
| 51099 | ABHD5 | LZE4T | Human | Esophagus | ESCC | 7.25e-21 | 6.90e-01 | 0.0811 |
| 51099 | ABHD5 | LZE5T | Human | Esophagus | ESCC | 1.26e-04 | 4.41e-01 | 0.0514 |
| 51099 | ABHD5 | LZE7T | Human | Esophagus | ESCC | 9.81e-06 | 3.72e-01 | 0.0667 |
| 51099 | ABHD5 | LZE8T | Human | Esophagus | ESCC | 1.12e-06 | 3.03e-01 | 0.067 |
| 51099 | ABHD5 | LZE20T | Human | Esophagus | ESCC | 2.13e-06 | 3.26e-01 | 0.0662 |
| 51099 | ABHD5 | LZE22T | Human | Esophagus | ESCC | 3.37e-02 | 4.88e-01 | 0.068 |
| 51099 | ABHD5 | LZE24T | Human | Esophagus | ESCC | 5.53e-16 | 5.55e-01 | 0.0596 |
| 51099 | ABHD5 | LZE21T | Human | Esophagus | ESCC | 9.32e-06 | 6.69e-01 | 0.0655 |
| 51099 | ABHD5 | P1T-E | Human | Esophagus | ESCC | 1.40e-12 | 9.59e-01 | 0.0875 |
| Page: 1 2 3 4 5 6 |
| Tissue | Expression Dynamics | Abbreviation |
| Endometrium |  | AEH: Atypical endometrial hyperplasia |
| EEC: Endometrioid Cancer | ||
| Esophagus | 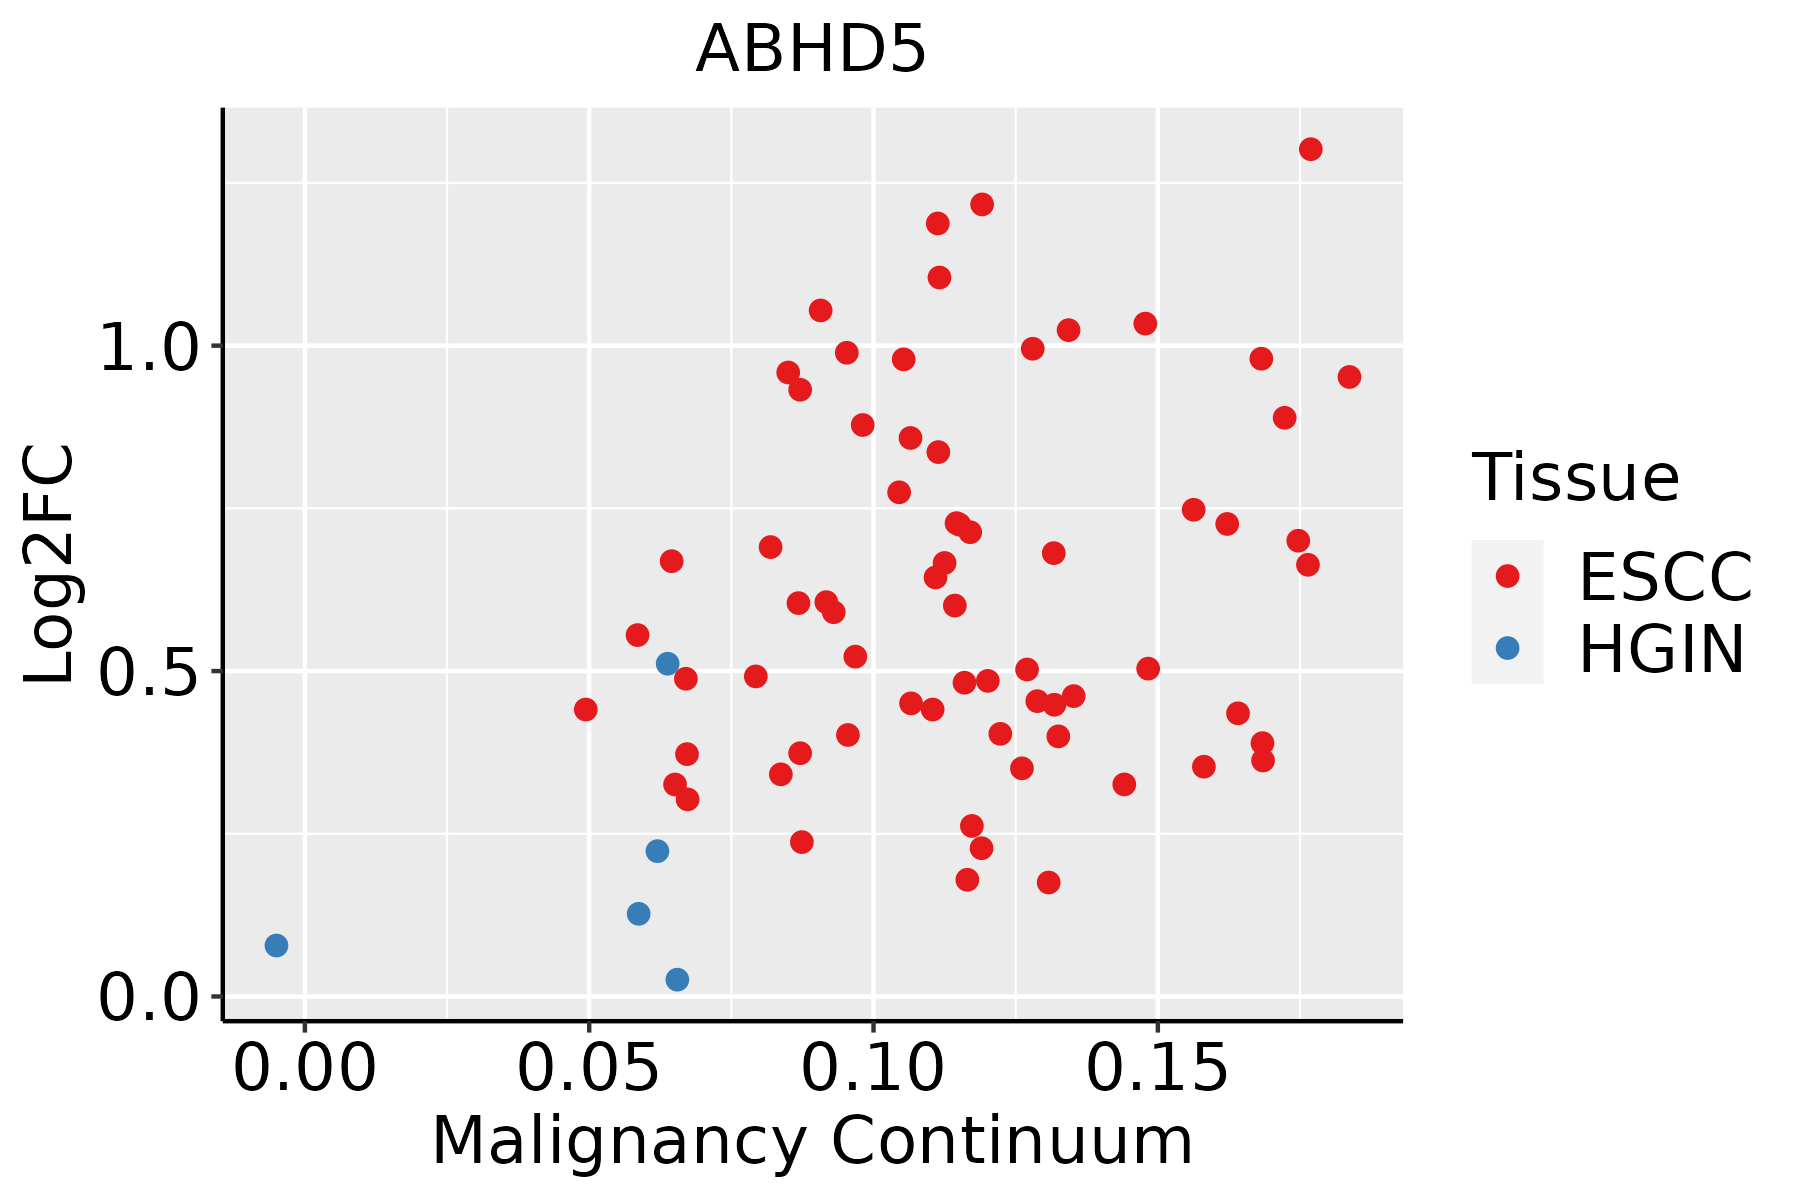 | ESCC: Esophageal squamous cell carcinoma |
| HGIN: High-grade intraepithelial neoplasias | ||
| LGIN: Low-grade intraepithelial neoplasias | ||
| Liver |  | HCC: Hepatocellular carcinoma |
| NAFLD: Non-alcoholic fatty liver disease | ||
| Lung |  | AAH: Atypical adenomatous hyperplasia |
| AIS: Adenocarcinoma in situ | ||
| IAC: Invasive lung adenocarcinoma | ||
| MIA: Minimally invasive adenocarcinoma | ||
| Oral Cavity | 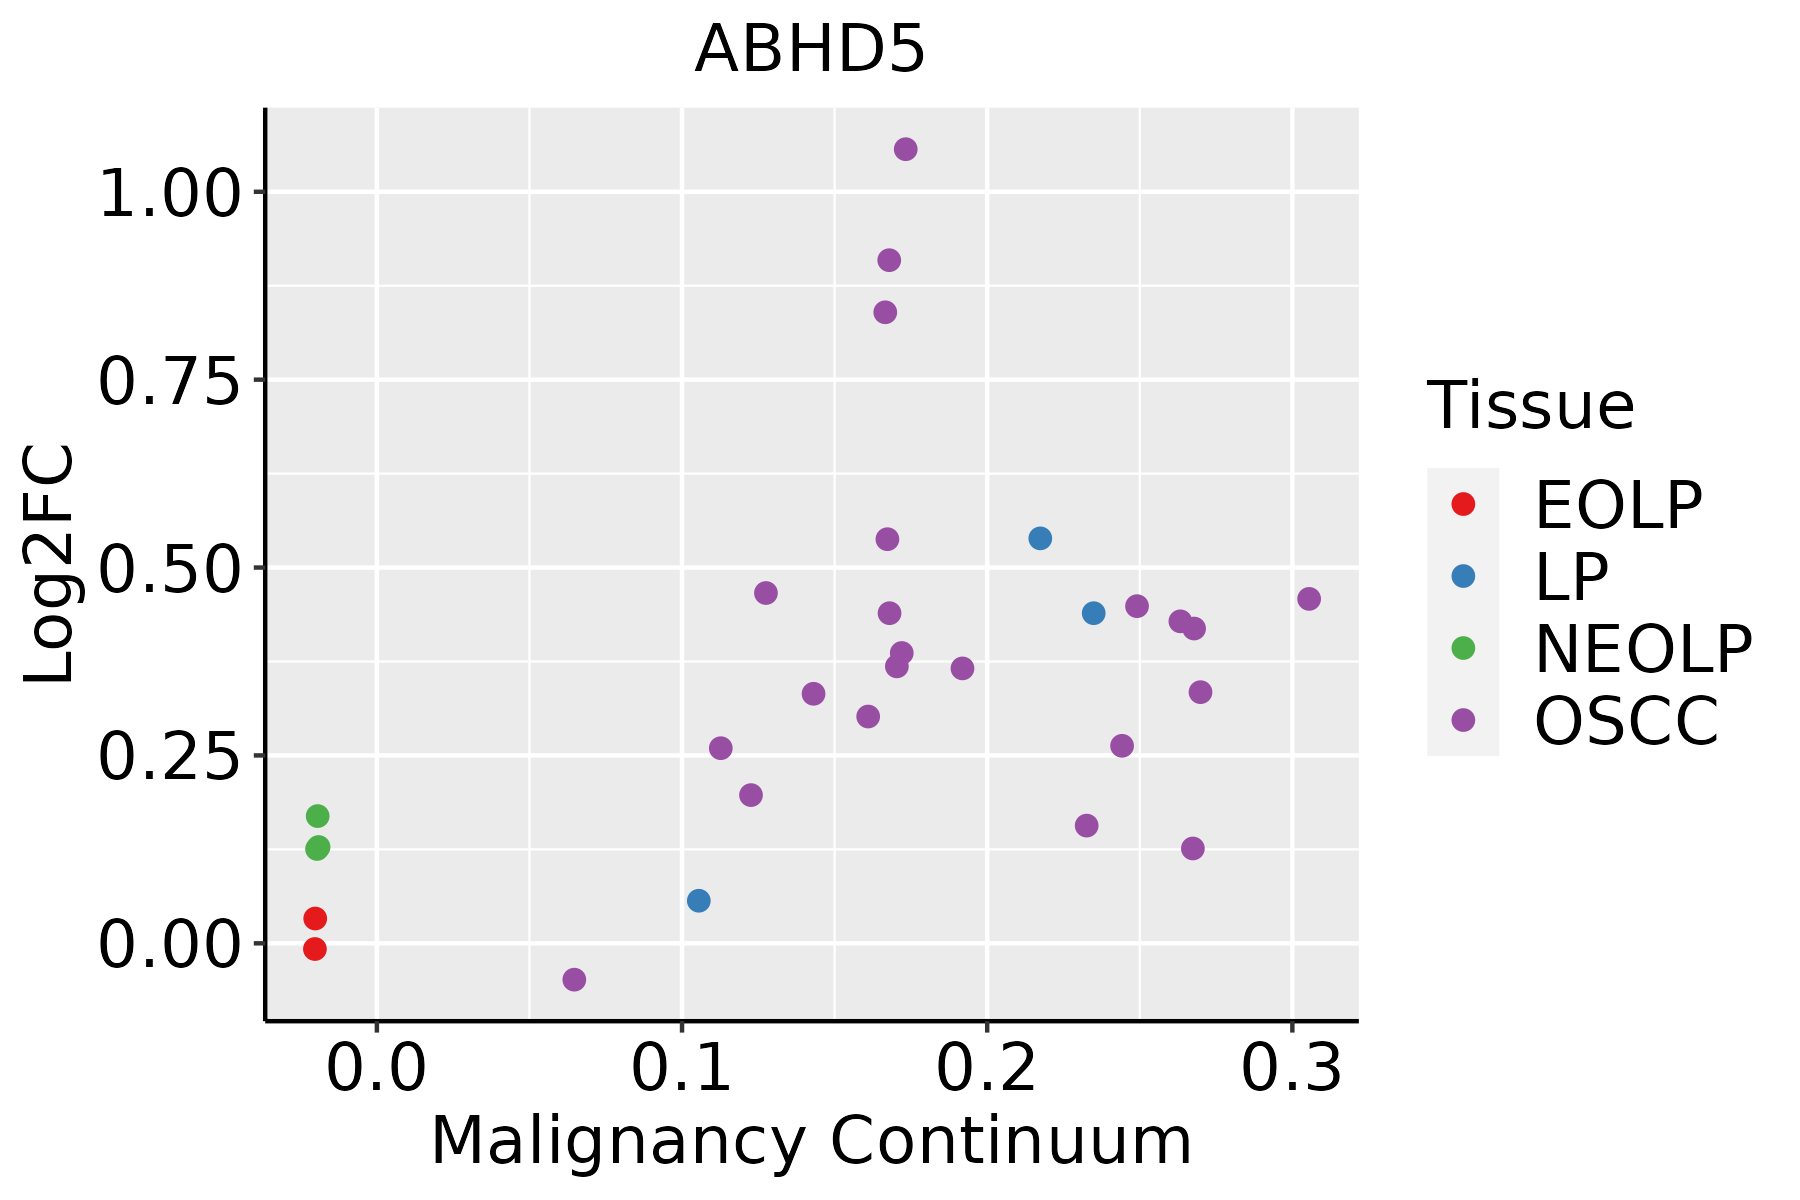 | EOLP: Erosive Oral lichen planus |
| LP: leukoplakia | ||
| NEOLP: Non-erosive oral lichen planus | ||
| OSCC: Oral squamous cell carcinoma | ||
| Thyroid | 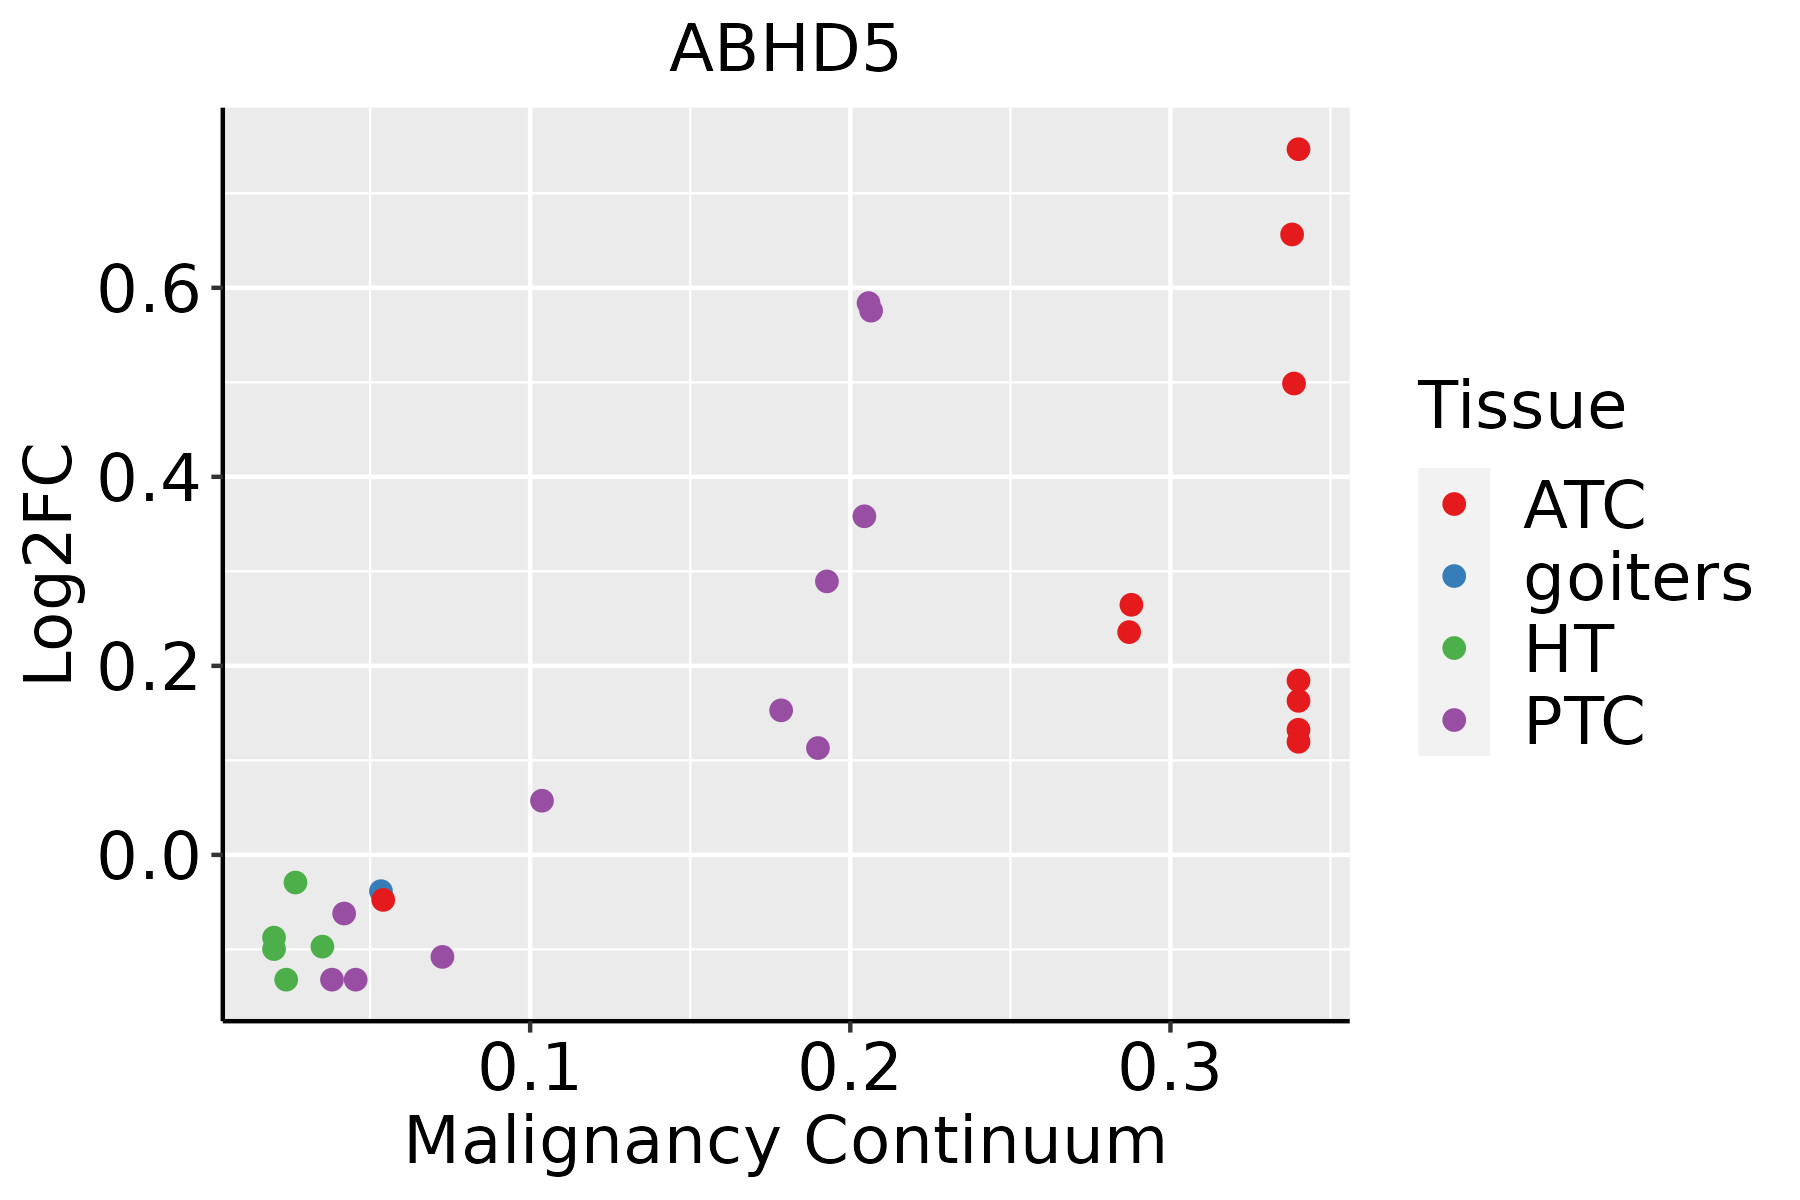 | ATC: Anaplastic thyroid cancer |
| HT: Hashimoto's thyroiditis | ||
| PTC: Papillary thyroid cancer |
| ∗log2FC in expression of this searched gene in stem-like cells from each diseased tissue sample relative to stem-like cells in normal samples in each tissue plotted against the malignancy continuum. Samples are colored based on if they are from different disease stage. |
Top |
Malignant transformation related pathway analysis |
| Find out the enriched GO biological processes and KEGG pathways involved in transition from healthy to precancer to cancer |
| Tissue | Disease Stage | Enriched GO biological Processes |
| Colorectum | AD |  |
| Colorectum | SER |  |
| Colorectum | MSS |  |
| Colorectum | MSI-H |  |
| Colorectum | FAP |  |
| ∗Top 15 enriched GO BP terms are showed in the bar plot of each disease state in each tissue. Each row represents a significant GO biological process which is colored according to the -log10(p.adjust). |
| Page: 1 2 3 4 5 6 7 8 9 |
| GO ID | Tissue | Disease Stage | Description | Gene Ratio | Bg Ratio | pvalue | p.adjust | Count |
| GO:000989616 | Endometrium | AEH | positive regulation of catabolic process | 104/2100 | 492/18723 | 9.38e-11 | 1.10e-08 | 104 |
| GO:003133116 | Endometrium | AEH | positive regulation of cellular catabolic process | 91/2100 | 427/18723 | 9.15e-10 | 8.31e-08 | 91 |
| GO:005123510 | Endometrium | AEH | maintenance of location | 60/2100 | 327/18723 | 8.19e-05 | 1.22e-03 | 60 |
| GO:00192165 | Endometrium | AEH | regulation of lipid metabolic process | 53/2100 | 331/18723 | 4.86e-03 | 3.07e-02 | 53 |
| GO:000989617 | Endometrium | EEC | positive regulation of catabolic process | 108/2168 | 492/18723 | 2.55e-11 | 3.64e-09 | 108 |
| GO:003133117 | Endometrium | EEC | positive regulation of cellular catabolic process | 94/2168 | 427/18723 | 4.30e-10 | 4.45e-08 | 94 |
| GO:005123515 | Endometrium | EEC | maintenance of location | 62/2168 | 327/18723 | 5.92e-05 | 9.13e-04 | 62 |
| GO:001921613 | Endometrium | EEC | regulation of lipid metabolic process | 54/2168 | 331/18723 | 5.82e-03 | 3.49e-02 | 54 |
| GO:00601911 | Endometrium | EEC | regulation of lipase activity | 19/2168 | 91/18723 | 7.46e-03 | 4.19e-02 | 19 |
| GO:0009896111 | Esophagus | ESCC | positive regulation of catabolic process | 332/8552 | 492/18723 | 4.36e-23 | 9.22e-21 | 332 |
| GO:0031331111 | Esophagus | ESCC | positive regulation of cellular catabolic process | 292/8552 | 427/18723 | 8.67e-22 | 1.53e-19 | 292 |
| GO:00086544 | Esophagus | ESCC | phospholipid biosynthetic process | 162/8552 | 253/18723 | 2.59e-09 | 5.73e-08 | 162 |
| GO:0051235110 | Esophagus | ESCC | maintenance of location | 200/8552 | 327/18723 | 1.01e-08 | 2.02e-07 | 200 |
| GO:00464744 | Esophagus | ESCC | glycerophospholipid biosynthetic process | 135/8552 | 211/18723 | 5.75e-08 | 1.02e-06 | 135 |
| GO:00450175 | Esophagus | ESCC | glycerolipid biosynthetic process | 154/8552 | 252/18723 | 5.20e-07 | 6.96e-06 | 154 |
| GO:00066446 | Esophagus | ESCC | phospholipid metabolic process | 218/8552 | 383/18723 | 5.37e-06 | 5.59e-05 | 218 |
| GO:00066318 | Esophagus | ESCC | fatty acid metabolic process | 217/8552 | 390/18723 | 4.21e-05 | 3.39e-04 | 217 |
| GO:00066505 | Esophagus | ESCC | glycerophospholipid metabolic process | 174/8552 | 306/18723 | 4.92e-05 | 3.85e-04 | 174 |
| GO:00199155 | Esophagus | ESCC | lipid storage | 58/8552 | 87/18723 | 6.15e-05 | 4.72e-04 | 58 |
| GO:00066541 | Esophagus | ESCC | phosphatidic acid biosynthetic process | 26/8552 | 33/18723 | 1.06e-04 | 7.43e-04 | 26 |
| Page: 1 2 3 4 |
| Pathway ID | Tissue | Disease Stage | Description | Gene Ratio | Bg Ratio | pvalue | p.adjust | qvalue | Count |
| Page: 1 |
Top |
Cell-cell communication analysis |
| Identification of potential cell-cell interactions between two cell types and their ligand-receptor pairs for different disease states |
| Ligand | Receptor | LRpair | Pathway | Tissue | Disease Stage |
| Page: 1 |
Top |
Single-cell gene regulatory network inference analysis |
| Find out the significant the regulons (TFs) and the target genes of each regulon across cell types for different disease states |
| TF | Cell Type | Tissue | Disease Stage | Target Gene | RSS | Regulon Activity |
| ∗The dot plots of a searched regulon are shown for all cell subpopulations in each disease state of each tissue based on the regulon specific score inferred using pySCENIC and by calculating the average expression. |
| Page: 1 |
Top |
Somatic mutation of malignant transformation related genes |
| Annotation of somatic variants for genes involved in malignant transformation |
| Hugo Symbol | Variant Class | Variant Classification | dbSNP RS | HGVSc | HGVSp | HGVSp Short | SWISSPROT | BIOTYPE | SIFT | PolyPhen | Tumor Sample Barcode | Tissue | Histology | Sex | Age | Stage | Therapy Types | Drugs | Outcome |
| ABHD5 | SNV | Missense_Mutation | rs143489624 | c.680N>A | p.Arg227His | p.R227H | Q8WTS1 | protein_coding | deleterious(0.01) | probably_damaging(0.973) | TCGA-CK-5912-01 | Colorectum | colon adenocarcinoma | Male | >=65 | I/II | Unknown | Unknown | SD |
| ABHD5 | SNV | Missense_Mutation | novel | c.471N>A | p.Phe157Leu | p.F157L | Q8WTS1 | protein_coding | deleterious(0) | possibly_damaging(0.824) | TCGA-F5-6814-01 | Colorectum | rectum adenocarcinoma | Male | <65 | I/II | Unknown | Unknown | SD |
| ABHD5 | SNV | Missense_Mutation | novel | c.451N>A | p.Gly151Arg | p.G151R | Q8WTS1 | protein_coding | deleterious(0) | probably_damaging(1) | TCGA-A5-A0G1-01 | Endometrium | uterine corpus endometrioid carcinoma | Female | >=65 | I/II | Unknown | Unknown | SD |
| ABHD5 | SNV | Missense_Mutation | novel | c.438N>C | p.Lys146Asn | p.K146N | Q8WTS1 | protein_coding | tolerated(0.35) | benign(0.021) | TCGA-AJ-A3EL-01 | Endometrium | uterine corpus endometrioid carcinoma | Female | <65 | I/II | Unknown | Unknown | SD |
| ABHD5 | SNV | Missense_Mutation | novel | c.283N>G | p.Phe95Val | p.F95V | Q8WTS1 | protein_coding | tolerated(0.08) | benign(0.026) | TCGA-AJ-A5DW-01 | Endometrium | uterine corpus endometrioid carcinoma | Female | <65 | I/II | Unknown | Unknown | SD |
| ABHD5 | SNV | Missense_Mutation | c.556N>T | p.Asp186Tyr | p.D186Y | Q8WTS1 | protein_coding | deleterious(0.03) | possibly_damaging(0.796) | TCGA-AP-A051-01 | Endometrium | uterine corpus endometrioid carcinoma | Female | >=65 | I/II | Unknown | Unknown | SD | |
| ABHD5 | SNV | Missense_Mutation | c.710C>A | p.Ser237Tyr | p.S237Y | Q8WTS1 | protein_coding | deleterious(0) | possibly_damaging(0.886) | TCGA-AP-A1E0-01 | Endometrium | uterine corpus endometrioid carcinoma | Female | <65 | III/IV | Chemotherapy | paclitaxel | SD | |
| ABHD5 | SNV | Missense_Mutation | c.166N>T | p.Arg56Cys | p.R56C | Q8WTS1 | protein_coding | tolerated(0.19) | benign(0.001) | TCGA-AX-A05Z-01 | Endometrium | uterine corpus endometrioid carcinoma | Female | <65 | III/IV | Chemotherapy | adriamycin | SD | |
| ABHD5 | SNV | Missense_Mutation | c.710C>A | p.Ser237Tyr | p.S237Y | Q8WTS1 | protein_coding | deleterious(0) | possibly_damaging(0.886) | TCGA-B5-A11E-01 | Endometrium | uterine corpus endometrioid carcinoma | Female | <65 | I/II | Unknown | Unknown | SD | |
| ABHD5 | SNV | Missense_Mutation | rs764177895 | c.727N>A | p.Asp243Asn | p.D243N | Q8WTS1 | protein_coding | tolerated(0.42) | benign(0.003) | TCGA-B5-A1MR-01 | Endometrium | uterine corpus endometrioid carcinoma | Female | >=65 | III/IV | Unknown | Unknown | SD |
| Page: 1 2 3 |
Top |
Related drugs of malignant transformation related genes |
| Identification of chemicals and drugs interact with genes involved in malignant transfromation |
| (DGIdb 4.0) |
| Entrez ID | Symbol | Category | Interaction Types | Drug Claim Name | Drug Name | PMIDs |
| Page: 1 |

Copyright 2023-Present -The University of Texas Health Science Center at Houston |