
|
|||||
|
 | |
| |
| |
| |
| |
| |
|
Gene: ABHD4 |
Gene summary for ABHD4 |
| Gene information | Species | Human | Gene symbol | ABHD4 | Gene ID | 63874 |
| Gene name | abhydrolase domain containing 4, N-acyl phospholipase B | |
| Gene Alias | ABH4 | |
| Cytomap | 14q11.2 | |
| Gene Type | protein-coding | GO ID | GO:0006629 | UniProtAcc | Q8TB40 |
Top |
Malignant transformation analysis |
| Identification of the aberrant gene expression in precancerous and cancerous lesions by comparing the gene expression of stem-like cells in diseased tissues with normal stem cells |
| Entrez ID | Symbol | Replicates | Species | Organ | Tissue | Adj P-value | Log2FC | Malignancy |
| 63874 | ABHD4 | LZE4T | Human | Esophagus | ESCC | 1.07e-26 | 8.73e-01 | 0.0811 |
| 63874 | ABHD4 | LZE24T | Human | Esophagus | ESCC | 1.88e-08 | 1.11e-01 | 0.0596 |
| 63874 | ABHD4 | P2T-E | Human | Esophagus | ESCC | 2.01e-15 | 1.35e-01 | 0.1177 |
| 63874 | ABHD4 | P4T-E | Human | Esophagus | ESCC | 1.70e-12 | 3.40e-01 | 0.1323 |
| 63874 | ABHD4 | P5T-E | Human | Esophagus | ESCC | 1.05e-08 | 7.54e-02 | 0.1327 |
| 63874 | ABHD4 | P8T-E | Human | Esophagus | ESCC | 1.04e-13 | 2.69e-01 | 0.0889 |
| 63874 | ABHD4 | P9T-E | Human | Esophagus | ESCC | 2.19e-17 | 2.64e-01 | 0.1131 |
| 63874 | ABHD4 | P10T-E | Human | Esophagus | ESCC | 4.98e-16 | 3.65e-01 | 0.116 |
| 63874 | ABHD4 | P11T-E | Human | Esophagus | ESCC | 7.29e-10 | 3.08e-01 | 0.1426 |
| 63874 | ABHD4 | P12T-E | Human | Esophagus | ESCC | 9.33e-23 | 5.64e-01 | 0.1122 |
| 63874 | ABHD4 | P15T-E | Human | Esophagus | ESCC | 1.90e-46 | 9.23e-01 | 0.1149 |
| 63874 | ABHD4 | P16T-E | Human | Esophagus | ESCC | 8.81e-08 | 1.05e-01 | 0.1153 |
| 63874 | ABHD4 | P17T-E | Human | Esophagus | ESCC | 5.31e-03 | 9.35e-02 | 0.1278 |
| 63874 | ABHD4 | P20T-E | Human | Esophagus | ESCC | 2.52e-08 | 7.84e-02 | 0.1124 |
| 63874 | ABHD4 | P21T-E | Human | Esophagus | ESCC | 1.59e-04 | 4.82e-02 | 0.1617 |
| 63874 | ABHD4 | P22T-E | Human | Esophagus | ESCC | 7.68e-10 | 1.29e-01 | 0.1236 |
| 63874 | ABHD4 | P23T-E | Human | Esophagus | ESCC | 6.57e-23 | 3.57e-01 | 0.108 |
| 63874 | ABHD4 | P24T-E | Human | Esophagus | ESCC | 7.97e-03 | 3.55e-02 | 0.1287 |
| 63874 | ABHD4 | P26T-E | Human | Esophagus | ESCC | 3.19e-19 | 3.52e-01 | 0.1276 |
| 63874 | ABHD4 | P27T-E | Human | Esophagus | ESCC | 2.77e-21 | 5.03e-01 | 0.1055 |
| Page: 1 2 3 |
| Tissue | Expression Dynamics | Abbreviation |
| Esophagus | 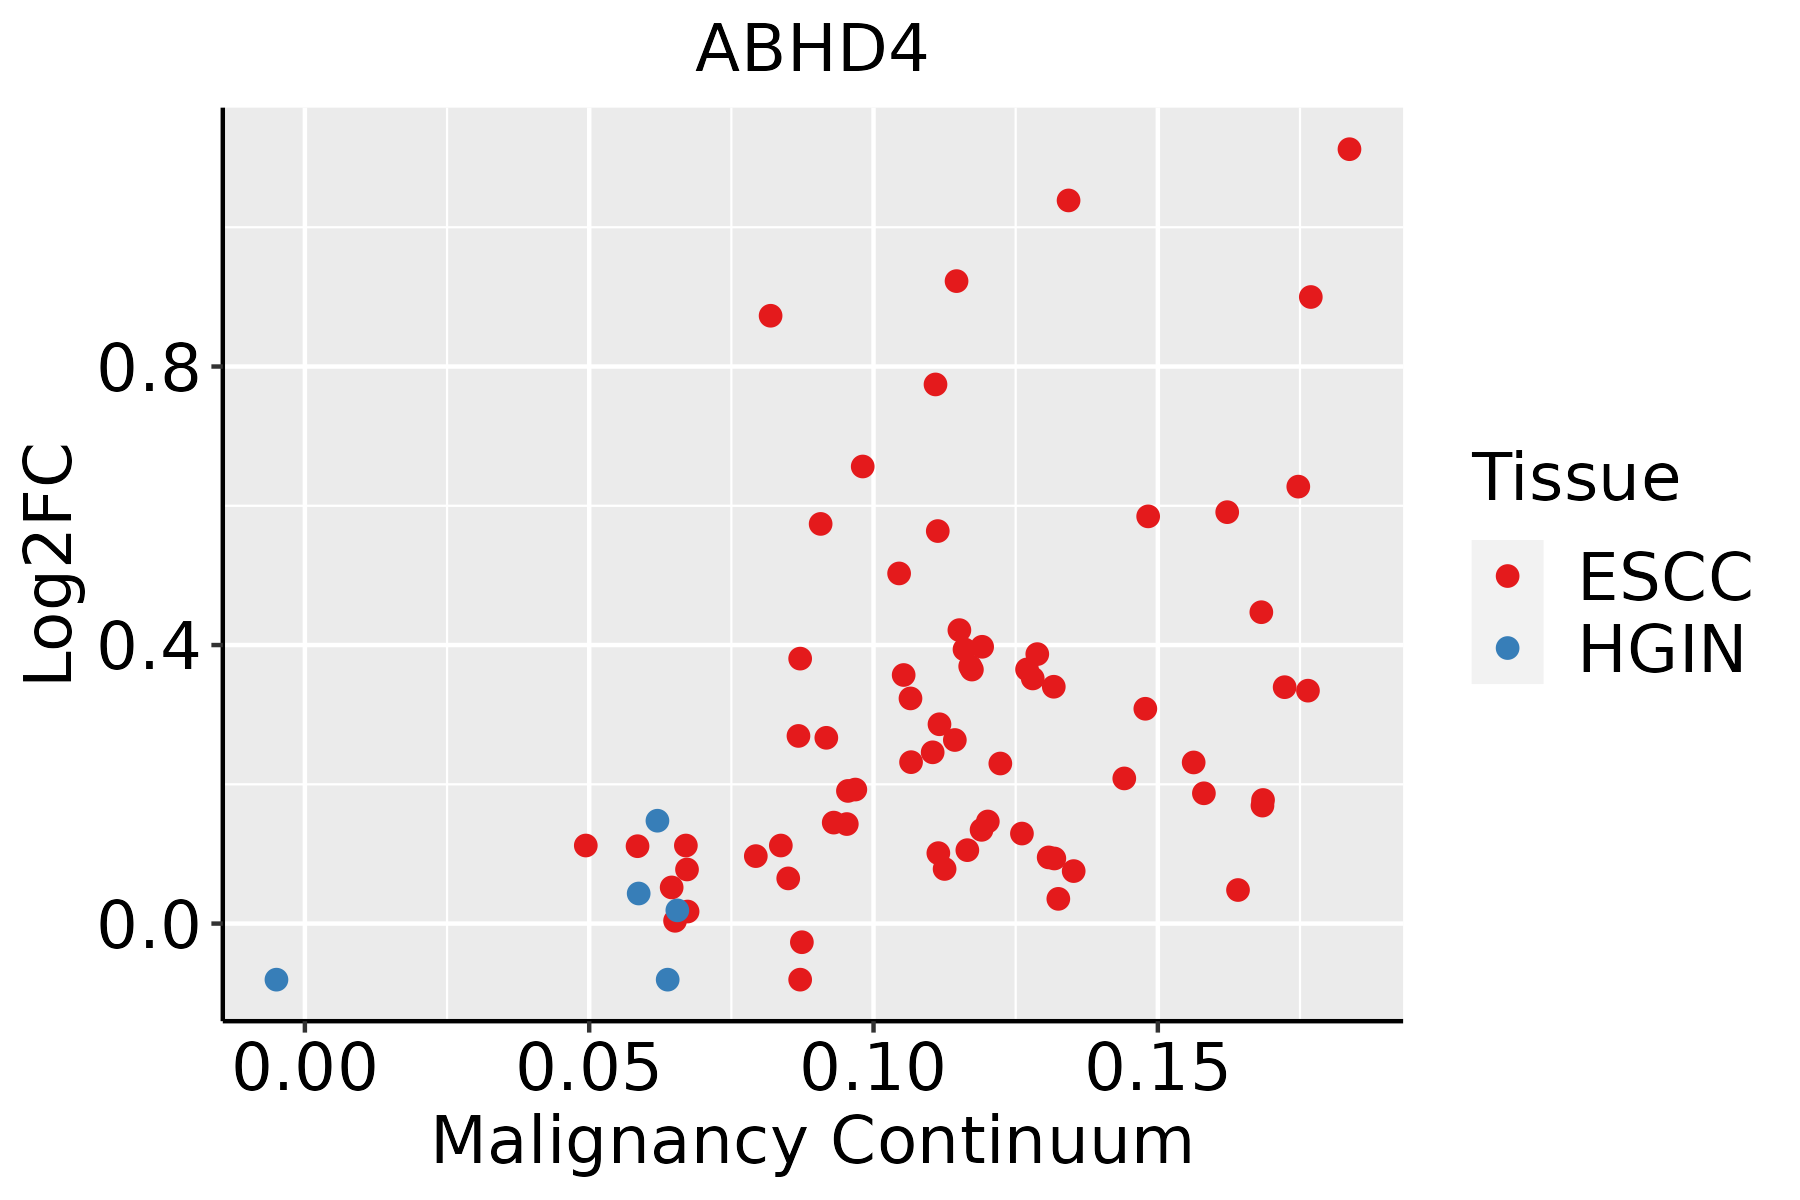 | ESCC: Esophageal squamous cell carcinoma |
| HGIN: High-grade intraepithelial neoplasias | ||
| LGIN: Low-grade intraepithelial neoplasias |
| ∗log2FC in expression of this searched gene in stem-like cells from each diseased tissue sample relative to stem-like cells in normal samples in each tissue plotted against the malignancy continuum. Samples are colored based on if they are from different disease stage. |
Top |
Malignant transformation related pathway analysis |
| Find out the enriched GO biological processes and KEGG pathways involved in transition from healthy to precancer to cancer |
| Tissue | Disease Stage | Enriched GO biological Processes |
| Colorectum | AD |  |
| Colorectum | SER |  |
| Colorectum | MSS |  |
| Colorectum | MSI-H |  |
| Colorectum | FAP |  |
| ∗Top 15 enriched GO BP terms are showed in the bar plot of each disease state in each tissue. Each row represents a significant GO biological process which is colored according to the -log10(p.adjust). |
| Page: 1 2 3 4 5 6 7 8 9 |
| GO ID | Tissue | Disease Stage | Description | Gene Ratio | Bg Ratio | pvalue | p.adjust | Count |
| GO:00086544 | Esophagus | ESCC | phospholipid biosynthetic process | 162/8552 | 253/18723 | 2.59e-09 | 5.73e-08 | 162 |
| GO:00464744 | Esophagus | ESCC | glycerophospholipid biosynthetic process | 135/8552 | 211/18723 | 5.75e-08 | 1.02e-06 | 135 |
| GO:00450175 | Esophagus | ESCC | glycerolipid biosynthetic process | 154/8552 | 252/18723 | 5.20e-07 | 6.96e-06 | 154 |
| GO:00066446 | Esophagus | ESCC | phospholipid metabolic process | 218/8552 | 383/18723 | 5.37e-06 | 5.59e-05 | 218 |
| GO:00066505 | Esophagus | ESCC | glycerophospholipid metabolic process | 174/8552 | 306/18723 | 4.92e-05 | 3.85e-04 | 174 |
| GO:00066541 | Esophagus | ESCC | phosphatidic acid biosynthetic process | 26/8552 | 33/18723 | 1.06e-04 | 7.43e-04 | 26 |
| GO:00464733 | Esophagus | ESCC | phosphatidic acid metabolic process | 28/8552 | 37/18723 | 2.00e-04 | 1.26e-03 | 28 |
| GO:00464864 | Esophagus | ESCC | glycerolipid metabolic process | 211/8552 | 392/18723 | 6.51e-04 | 3.46e-03 | 211 |
| GO:00160427 | Esophagus | ESCC | lipid catabolic process | 168/8552 | 320/18723 | 7.97e-03 | 2.84e-02 | 168 |
| Page: 1 |
| Pathway ID | Tissue | Disease Stage | Description | Gene Ratio | Bg Ratio | pvalue | p.adjust | qvalue | Count |
| Page: 1 |
Top |
Cell-cell communication analysis |
| Identification of potential cell-cell interactions between two cell types and their ligand-receptor pairs for different disease states |
| Ligand | Receptor | LRpair | Pathway | Tissue | Disease Stage |
| Page: 1 |
Top |
Single-cell gene regulatory network inference analysis |
| Find out the significant the regulons (TFs) and the target genes of each regulon across cell types for different disease states |
| TF | Cell Type | Tissue | Disease Stage | Target Gene | RSS | Regulon Activity |
| ∗The dot plots of a searched regulon are shown for all cell subpopulations in each disease state of each tissue based on the regulon specific score inferred using pySCENIC and by calculating the average expression. |
| Page: 1 |
Top |
Somatic mutation of malignant transformation related genes |
| Annotation of somatic variants for genes involved in malignant transformation |
| Hugo Symbol | Variant Class | Variant Classification | dbSNP RS | HGVSc | HGVSp | HGVSp Short | SWISSPROT | BIOTYPE | SIFT | PolyPhen | Tumor Sample Barcode | Tissue | Histology | Sex | Age | Stage | Therapy Types | Drugs | Outcome |
| ABHD4 | SNV | Missense_Mutation | c.137N>A | p.Arg46Lys | p.R46K | Q8TB40 | protein_coding | tolerated(0.4) | benign(0.003) | TCGA-E2-A10C-01 | Breast | breast invasive carcinoma | Female | <65 | I/II | Chemotherapy | cytoxan | SD | |
| ABHD4 | SNV | Missense_Mutation | rs755342789 | c.199N>A | p.Asp67Asn | p.D67N | Q8TB40 | protein_coding | tolerated(0.57) | benign(0) | TCGA-AA-A00N-01 | Colorectum | colon adenocarcinoma | Male | >=65 | I/II | Unknown | Unknown | PD |
| ABHD4 | SNV | Missense_Mutation | c.421A>G | p.Ile141Val | p.I141V | Q8TB40 | protein_coding | tolerated(0.32) | benign(0.163) | TCGA-CK-6746-01 | Colorectum | colon adenocarcinoma | Female | >=65 | I/II | Unknown | Unknown | SD | |
| ABHD4 | SNV | Missense_Mutation | rs768046002 | c.202C>T | p.Arg68Cys | p.R68C | Q8TB40 | protein_coding | deleterious(0) | possibly_damaging(0.676) | TCGA-A5-A0G2-01 | Endometrium | uterine corpus endometrioid carcinoma | Female | <65 | III/IV | Unknown | Unknown | SD |
| ABHD4 | SNV | Missense_Mutation | novel | c.945N>G | p.Ile315Met | p.I315M | Q8TB40 | protein_coding | deleterious(0.01) | probably_damaging(0.98) | TCGA-AJ-A3EK-01 | Endometrium | uterine corpus endometrioid carcinoma | Female | <65 | I/II | Chemotherapy | carboplatin | CR |
| ABHD4 | SNV | Missense_Mutation | rs142817719 | c.203N>A | p.Arg68His | p.R68H | Q8TB40 | protein_coding | deleterious(0) | possibly_damaging(0.511) | TCGA-AP-A0LM-01 | Endometrium | uterine corpus endometrioid carcinoma | Female | <65 | III/IV | Chemotherapy | cisplatin | SD |
| ABHD4 | SNV | Missense_Mutation | novel | c.292C>T | p.His98Tyr | p.H98Y | Q8TB40 | protein_coding | tolerated(1) | benign(0.015) | TCGA-AP-A1DK-01 | Endometrium | uterine corpus endometrioid carcinoma | Female | <65 | I/II | Unknown | Unknown | SD |
| ABHD4 | SNV | Missense_Mutation | rs146234194 | c.190N>A | p.Glu64Lys | p.E64K | Q8TB40 | protein_coding | tolerated(0.25) | benign(0.01) | TCGA-AX-A06F-01 | Endometrium | uterine corpus endometrioid carcinoma | Female | <65 | III/IV | Chemotherapy | carboplatin | SD |
| ABHD4 | SNV | Missense_Mutation | rs202089812 | c.61N>T | p.Arg21Cys | p.R21C | Q8TB40 | protein_coding | tolerated(1) | benign(0) | TCGA-B5-A11E-01 | Endometrium | uterine corpus endometrioid carcinoma | Female | <65 | I/II | Unknown | Unknown | SD |
| ABHD4 | SNV | Missense_Mutation | novel | c.538N>G | p.Asn180Asp | p.N180D | Q8TB40 | protein_coding | tolerated(1) | benign(0) | TCGA-B5-A3FA-01 | Endometrium | uterine corpus endometrioid carcinoma | Female | >=65 | I/II | Unknown | Unknown | SD |
| Page: 1 2 3 |
Top |
Related drugs of malignant transformation related genes |
| Identification of chemicals and drugs interact with genes involved in malignant transfromation |
| (DGIdb 4.0) |
| Entrez ID | Symbol | Category | Interaction Types | Drug Claim Name | Drug Name | PMIDs |
| Page: 1 |

Copyright 2023-Present -The University of Texas Health Science Center at Houston |