
|
|||||
|
 | |
| |
| |
| |
| |
| |
|
Gene: ABHD17C |
Gene summary for ABHD17C |
| Gene information | Species | Human | Gene symbol | ABHD17C | Gene ID | 58489 |
| Gene name | abhydrolase domain containing 17C, depalmitoylase | |
| Gene Alias | FAM108C1 | |
| Cytomap | 15q25.1 | |
| Gene Type | protein-coding | GO ID | GO:0002084 | UniProtAcc | Q6PCB6 |
Top |
Malignant transformation analysis |
| Identification of the aberrant gene expression in precancerous and cancerous lesions by comparing the gene expression of stem-like cells in diseased tissues with normal stem cells |
| Entrez ID | Symbol | Replicates | Species | Organ | Tissue | Adj P-value | Log2FC | Malignancy |
| 58489 | ABHD17C | CCI_1 | Human | Cervix | CC | 2.28e-05 | 9.25e-01 | 0.528 |
| 58489 | ABHD17C | CCI_2 | Human | Cervix | CC | 8.72e-19 | 1.61e+00 | 0.5249 |
| 58489 | ABHD17C | CCI_3 | Human | Cervix | CC | 7.86e-06 | 5.67e-01 | 0.516 |
| 58489 | ABHD17C | Tumor | Human | Cervix | CC | 1.04e-04 | 1.98e-01 | 0.1241 |
| 58489 | ABHD17C | sample3 | Human | Cervix | CC | 8.80e-16 | 3.82e-01 | 0.1387 |
| 58489 | ABHD17C | H2 | Human | Cervix | HSIL_HPV | 5.17e-05 | 2.89e-01 | 0.0632 |
| 58489 | ABHD17C | T3 | Human | Cervix | CC | 4.48e-11 | 4.02e-01 | 0.1389 |
| 58489 | ABHD17C | HTA11_3410_2000001011 | Human | Colorectum | AD | 1.14e-09 | -4.66e-01 | 0.0155 |
| 58489 | ABHD17C | HTA11_99999974143_84620 | Human | Colorectum | MSS | 6.26e-06 | -3.59e-01 | 0.3005 |
| 58489 | ABHD17C | A015-C-203 | Human | Colorectum | FAP | 2.01e-19 | -4.44e-01 | -0.1294 |
| 58489 | ABHD17C | A015-C-204 | Human | Colorectum | FAP | 8.44e-04 | -3.14e-01 | -0.0228 |
| 58489 | ABHD17C | A014-C-040 | Human | Colorectum | FAP | 7.18e-04 | -5.52e-01 | -0.1184 |
| 58489 | ABHD17C | A002-C-201 | Human | Colorectum | FAP | 1.66e-07 | -1.95e-01 | 0.0324 |
| 58489 | ABHD17C | A001-C-119 | Human | Colorectum | FAP | 1.03e-09 | -5.18e-01 | -0.1557 |
| 58489 | ABHD17C | A001-C-108 | Human | Colorectum | FAP | 1.79e-09 | -2.83e-01 | -0.0272 |
| 58489 | ABHD17C | A002-C-205 | Human | Colorectum | FAP | 6.82e-15 | -3.99e-01 | -0.1236 |
| 58489 | ABHD17C | A015-C-006 | Human | Colorectum | FAP | 5.68e-10 | -4.25e-01 | -0.0994 |
| 58489 | ABHD17C | A015-C-106 | Human | Colorectum | FAP | 4.13e-11 | -3.71e-01 | -0.0511 |
| 58489 | ABHD17C | A002-C-114 | Human | Colorectum | FAP | 3.41e-13 | -4.11e-01 | -0.1561 |
| 58489 | ABHD17C | A015-C-104 | Human | Colorectum | FAP | 6.19e-24 | -5.19e-01 | -0.1899 |
| Page: 1 2 3 4 5 6 |
| Tissue | Expression Dynamics | Abbreviation |
| Cervix | 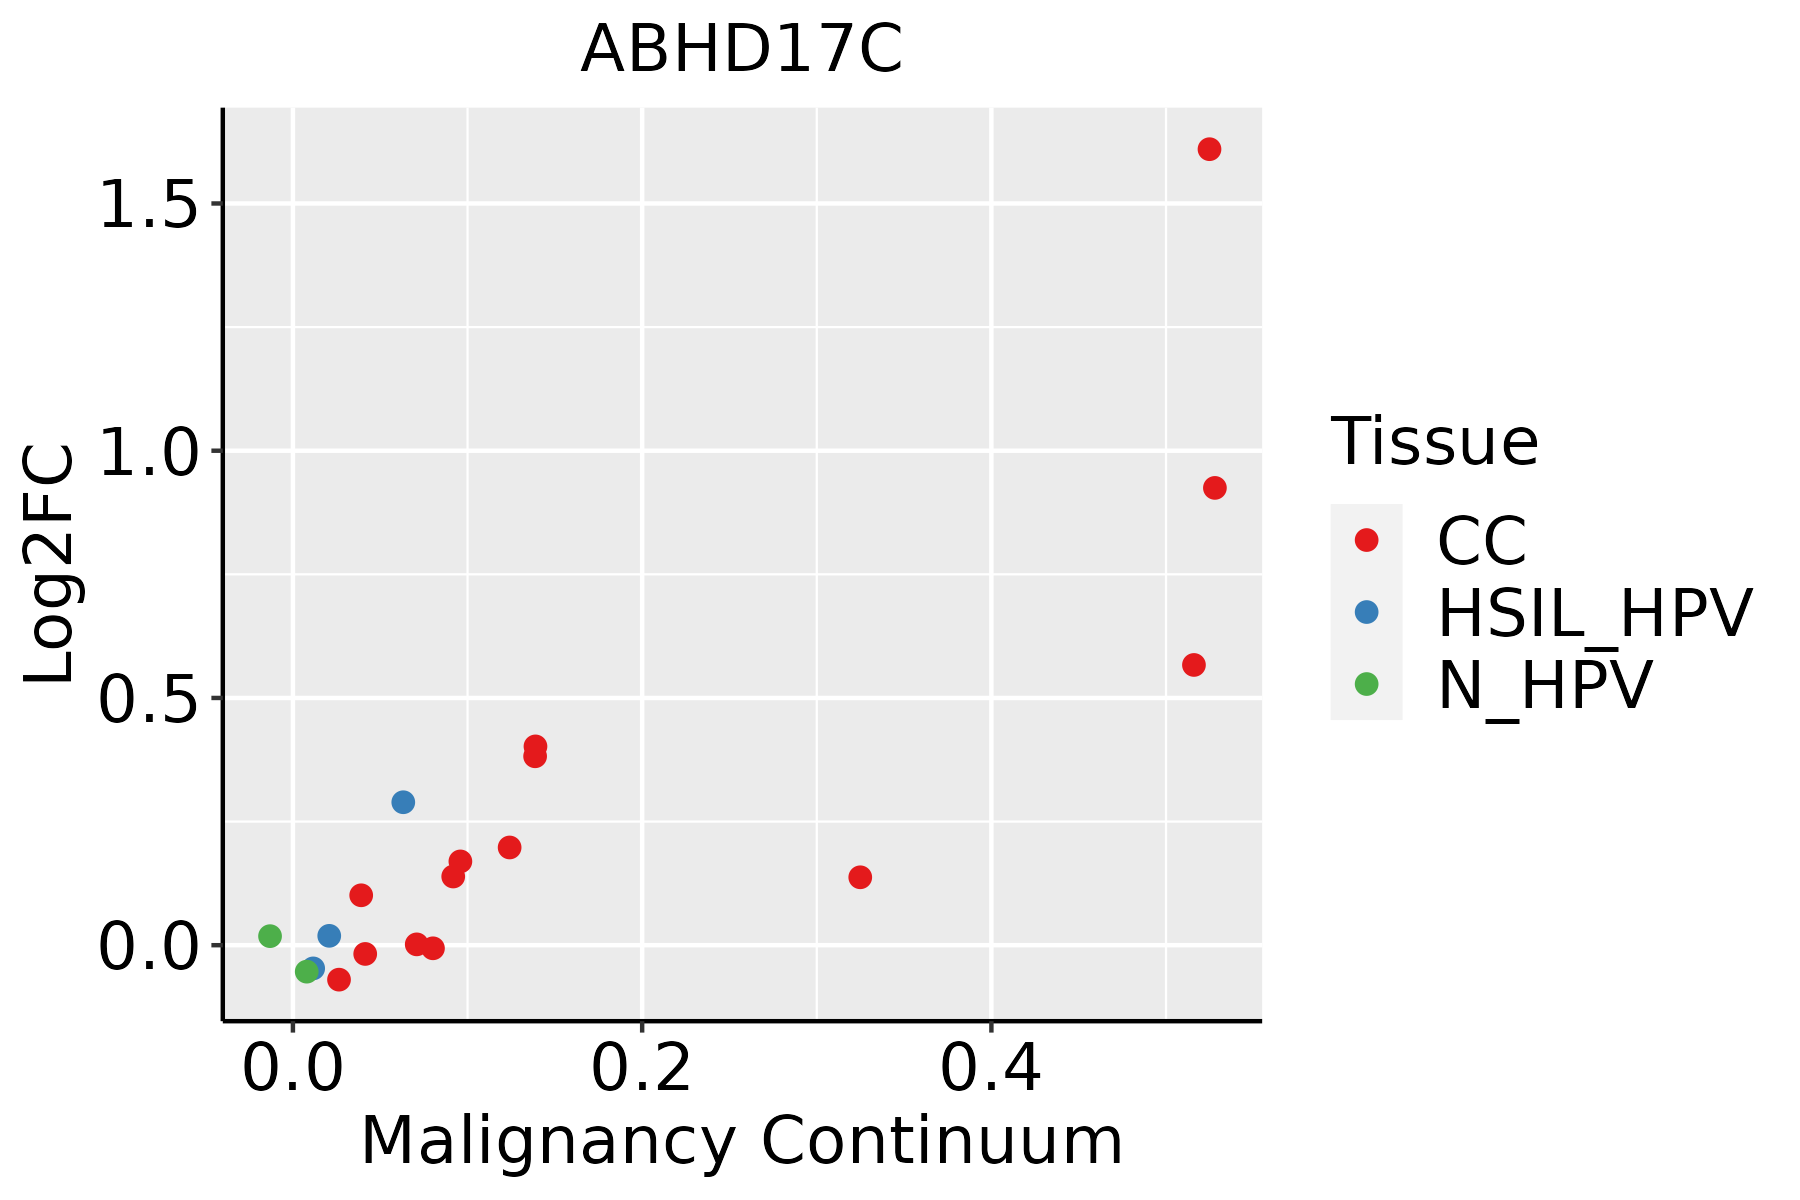 | CC: Cervix cancer |
| HSIL_HPV: HPV-infected high-grade squamous intraepithelial lesions | ||
| N_HPV: HPV-infected normal cervix | ||
| Colorectum (GSE201348) |  | FAP: Familial adenomatous polyposis |
| CRC: Colorectal cancer | ||
| Colorectum (HTA11) |  | AD: Adenomas |
| SER: Sessile serrated lesions | ||
| MSI-H: Microsatellite-high colorectal cancer | ||
| MSS: Microsatellite stable colorectal cancer | ||
| Esophagus | 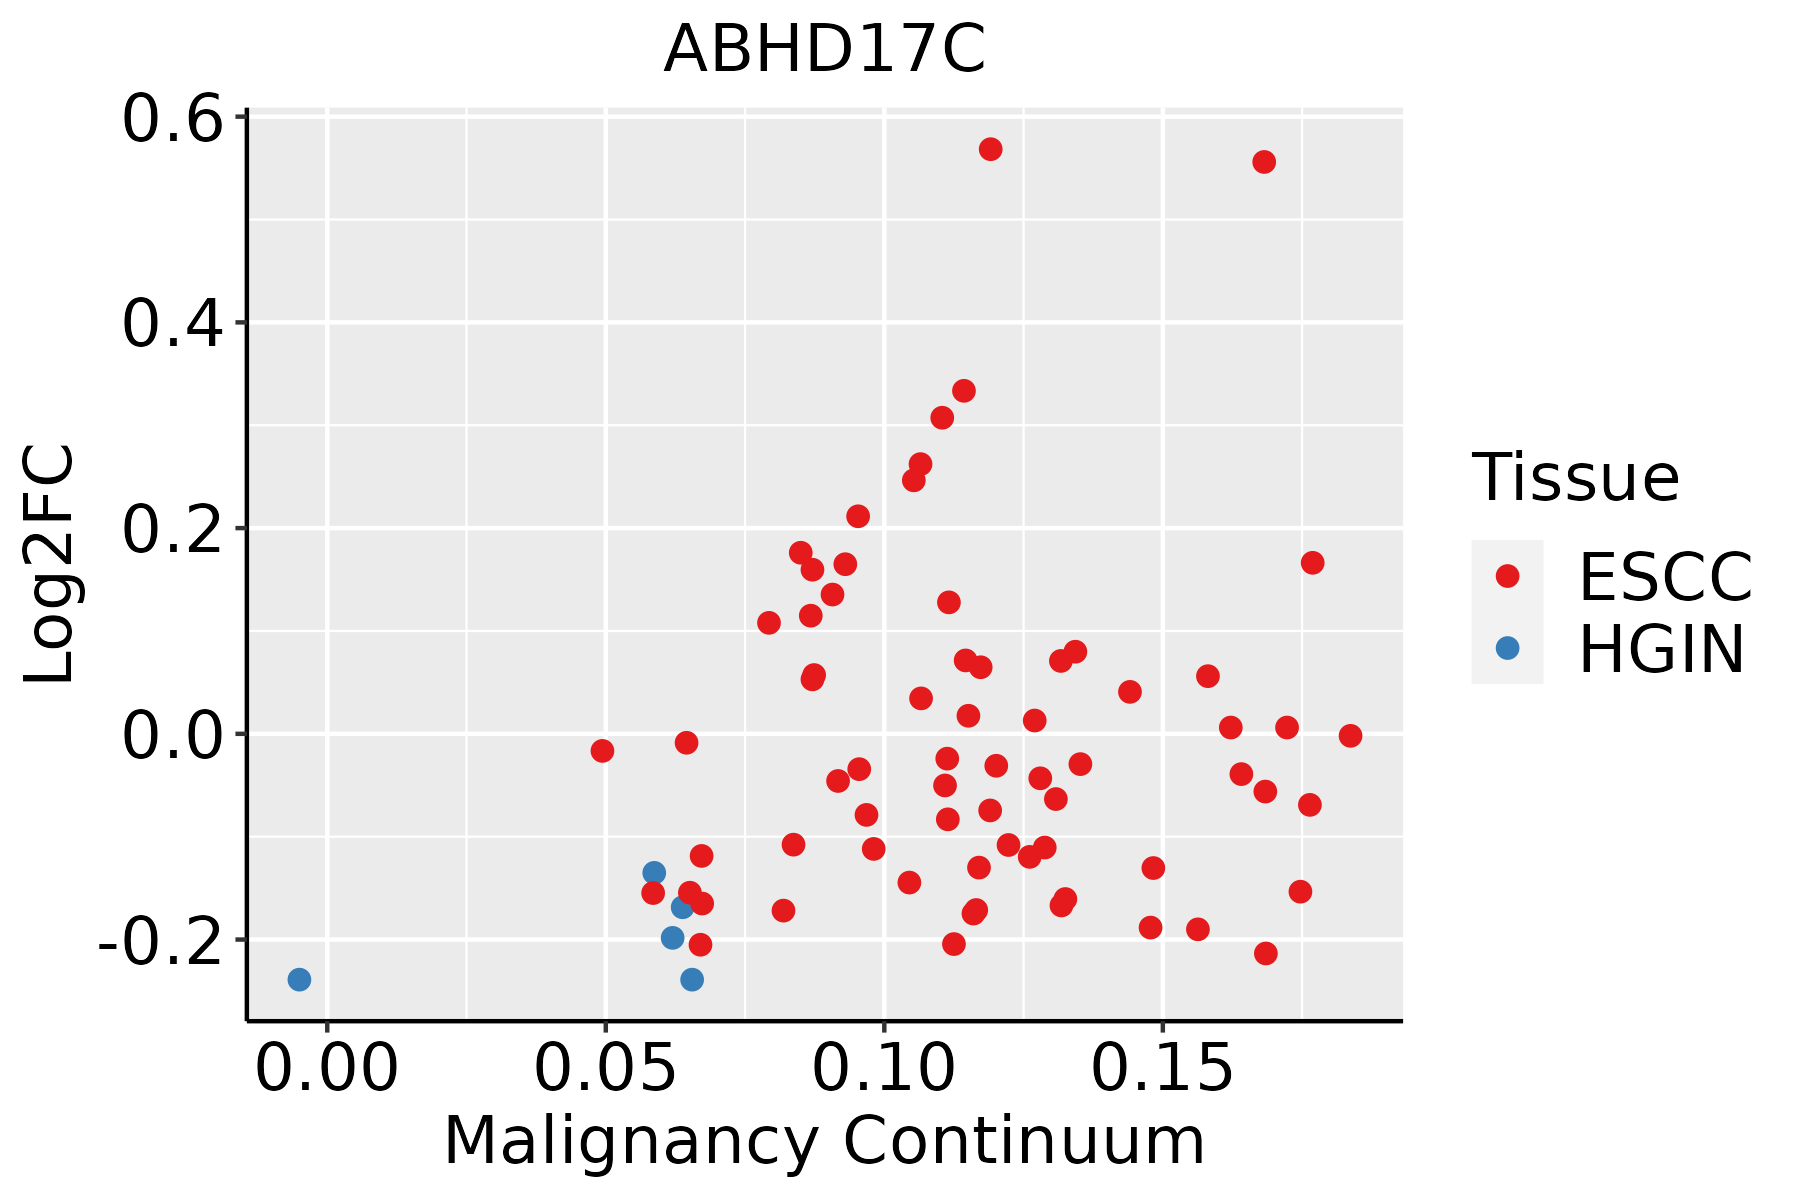 | ESCC: Esophageal squamous cell carcinoma |
| HGIN: High-grade intraepithelial neoplasias | ||
| LGIN: Low-grade intraepithelial neoplasias | ||
| Liver | 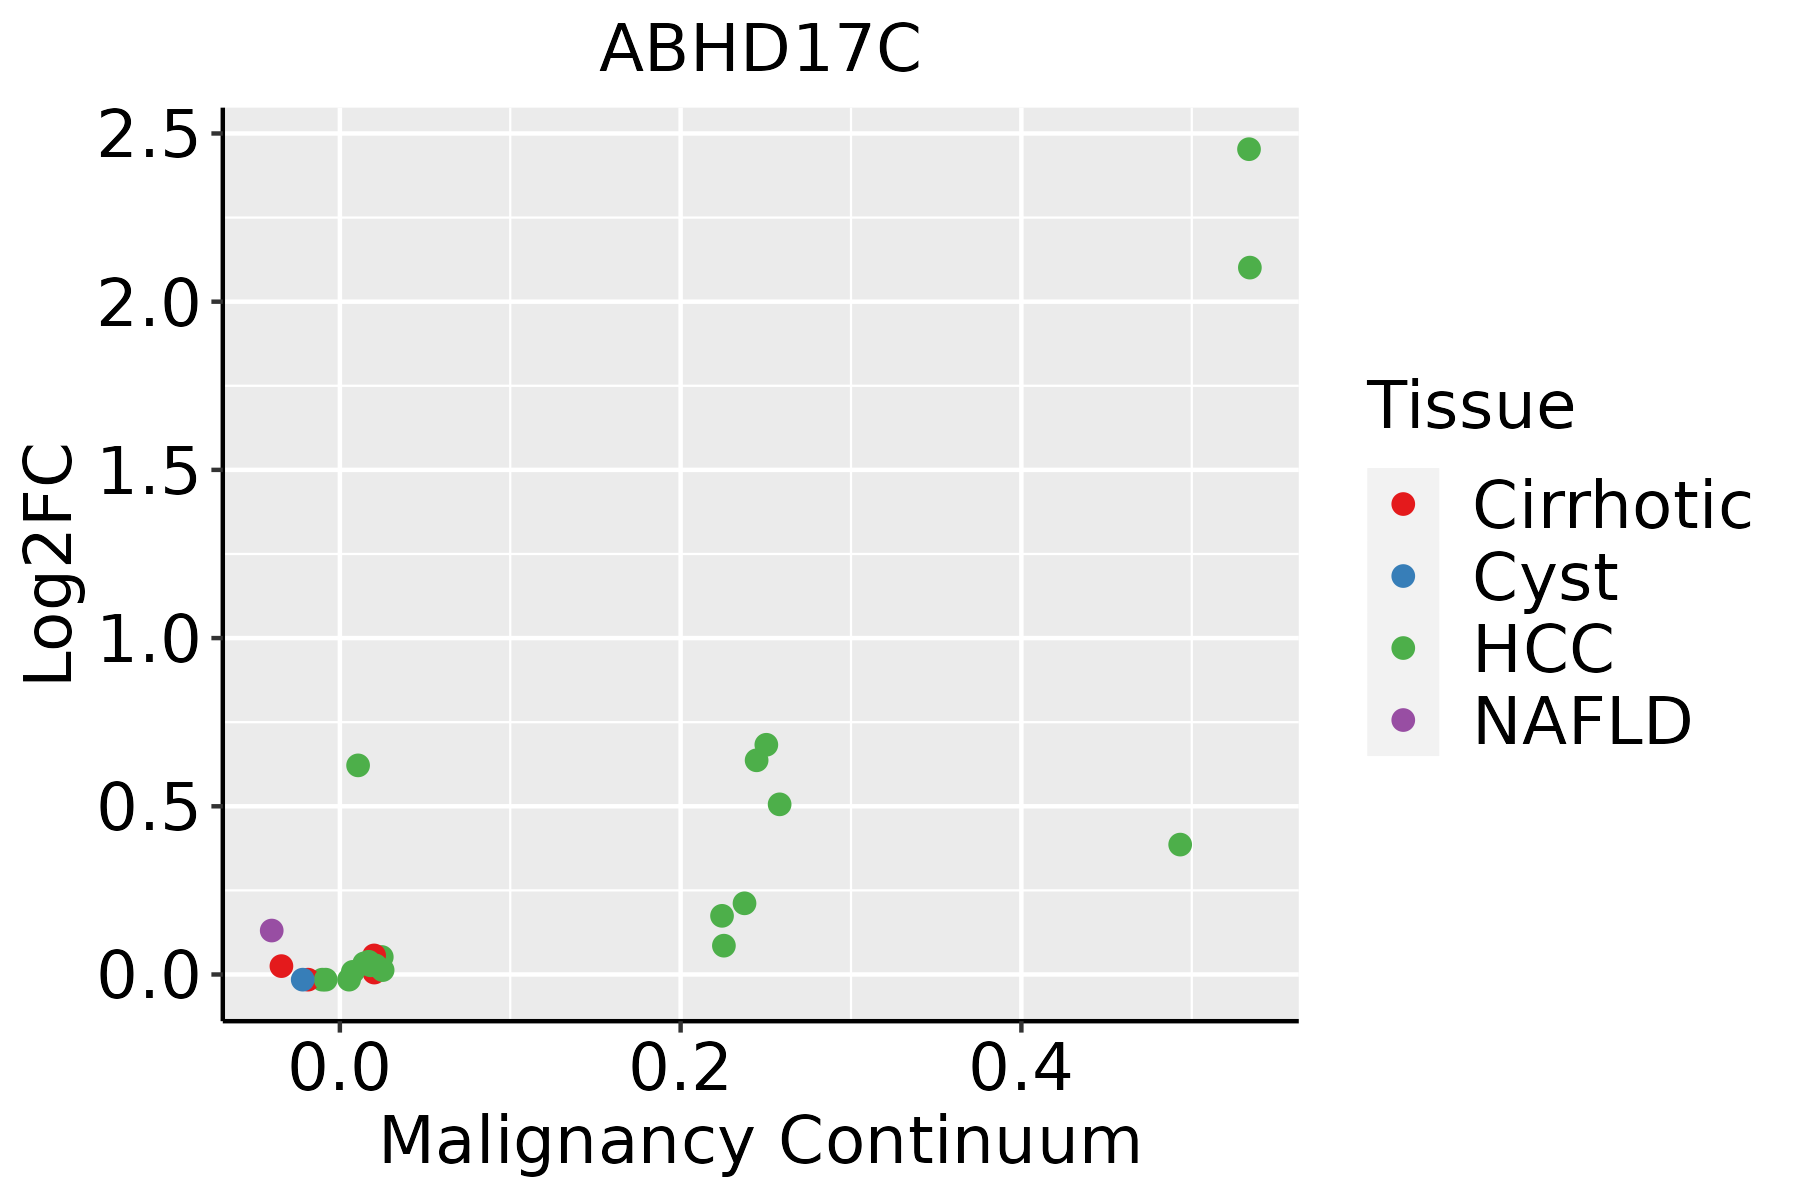 | HCC: Hepatocellular carcinoma |
| NAFLD: Non-alcoholic fatty liver disease | ||
| Oral Cavity |  | EOLP: Erosive Oral lichen planus |
| LP: leukoplakia | ||
| NEOLP: Non-erosive oral lichen planus | ||
| OSCC: Oral squamous cell carcinoma |
| ∗log2FC in expression of this searched gene in stem-like cells from each diseased tissue sample relative to stem-like cells in normal samples in each tissue plotted against the malignancy continuum. Samples are colored based on if they are from different disease stage. |
Top |
Malignant transformation related pathway analysis |
| Find out the enriched GO biological processes and KEGG pathways involved in transition from healthy to precancer to cancer |
| Tissue | Disease Stage | Enriched GO biological Processes |
| Colorectum | AD |  |
| Colorectum | SER |  |
| Colorectum | MSS |  |
| Colorectum | MSI-H |  |
| Colorectum | FAP |  |
| ∗Top 15 enriched GO BP terms are showed in the bar plot of each disease state in each tissue. Each row represents a significant GO biological process which is colored according to the -log10(p.adjust). |
| Page: 1 2 3 4 5 6 7 8 9 |
| GO ID | Tissue | Disease Stage | Description | Gene Ratio | Bg Ratio | pvalue | p.adjust | Count |
| GO:190382910 | Cervix | CC | positive regulation of cellular protein localization | 72/2311 | 276/18723 | 3.20e-10 | 4.46e-08 | 72 |
| GO:1905668 | Cervix | CC | positive regulation of protein localization to endosome | 5/2311 | 11/18723 | 6.92e-03 | 3.74e-02 | 5 |
| GO:19038286 | Cervix | CC | negative regulation of cellular protein localization | 24/2311 | 117/18723 | 8.10e-03 | 4.23e-02 | 24 |
| GO:1903829 | Colorectum | AD | positive regulation of cellular protein localization | 110/3918 | 276/18723 | 4.58e-13 | 8.44e-11 | 110 |
| GO:1903828 | Colorectum | AD | negative regulation of cellular protein localization | 39/3918 | 117/18723 | 1.18e-03 | 1.06e-02 | 39 |
| GO:0036010 | Colorectum | AD | protein localization to endosome | 12/3918 | 24/18723 | 1.48e-03 | 1.25e-02 | 12 |
| GO:0099173 | Colorectum | AD | postsynapse organization | 51/3918 | 168/18723 | 2.47e-03 | 1.90e-02 | 51 |
| GO:0050808 | Colorectum | AD | synapse organization | 112/3918 | 426/18723 | 4.25e-03 | 2.92e-02 | 112 |
| GO:0050807 | Colorectum | AD | regulation of synapse organization | 60/3918 | 211/18723 | 5.67e-03 | 3.64e-02 | 60 |
| GO:19038292 | Colorectum | MSS | positive regulation of cellular protein localization | 103/3467 | 276/18723 | 1.12e-13 | 2.67e-11 | 103 |
| GO:00360102 | Colorectum | MSS | protein localization to endosome | 12/3467 | 24/18723 | 4.68e-04 | 5.50e-03 | 12 |
| GO:19038282 | Colorectum | MSS | negative regulation of cellular protein localization | 36/3467 | 117/18723 | 9.19e-04 | 9.34e-03 | 36 |
| GO:00991732 | Colorectum | MSS | postsynapse organization | 48/3467 | 168/18723 | 9.32e-04 | 9.44e-03 | 48 |
| GO:00508082 | Colorectum | MSS | synapse organization | 101/3467 | 426/18723 | 3.96e-03 | 2.89e-02 | 101 |
| GO:0044380 | Colorectum | MSS | protein localization to cytoskeleton | 19/3467 | 58/18723 | 6.69e-03 | 4.38e-02 | 19 |
| GO:0072698 | Colorectum | MSS | protein localization to microtubule cytoskeleton | 18/3467 | 54/18723 | 6.70e-03 | 4.38e-02 | 18 |
| GO:19038294 | Colorectum | FAP | positive regulation of cellular protein localization | 79/2622 | 276/18723 | 1.59e-10 | 4.38e-08 | 79 |
| GO:00508083 | Colorectum | FAP | synapse organization | 91/2622 | 426/18723 | 1.90e-05 | 4.74e-04 | 91 |
| GO:00991733 | Colorectum | FAP | postsynapse organization | 42/2622 | 168/18723 | 1.01e-04 | 1.70e-03 | 42 |
| GO:00508071 | Colorectum | FAP | regulation of synapse organization | 46/2622 | 211/18723 | 1.30e-03 | 1.20e-02 | 46 |
| Page: 1 2 3 4 |
| Pathway ID | Tissue | Disease Stage | Description | Gene Ratio | Bg Ratio | pvalue | p.adjust | qvalue | Count |
| Page: 1 |
Top |
Cell-cell communication analysis |
| Identification of potential cell-cell interactions between two cell types and their ligand-receptor pairs for different disease states |
| Ligand | Receptor | LRpair | Pathway | Tissue | Disease Stage |
| Page: 1 |
Top |
Single-cell gene regulatory network inference analysis |
| Find out the significant the regulons (TFs) and the target genes of each regulon across cell types for different disease states |
| TF | Cell Type | Tissue | Disease Stage | Target Gene | RSS | Regulon Activity |
| ∗The dot plots of a searched regulon are shown for all cell subpopulations in each disease state of each tissue based on the regulon specific score inferred using pySCENIC and by calculating the average expression. |
| Page: 1 |
Top |
Somatic mutation of malignant transformation related genes |
| Annotation of somatic variants for genes involved in malignant transformation |
| Hugo Symbol | Variant Class | Variant Classification | dbSNP RS | HGVSc | HGVSp | HGVSp Short | SWISSPROT | BIOTYPE | SIFT | PolyPhen | Tumor Sample Barcode | Tissue | Histology | Sex | Age | Stage | Therapy Types | Drugs | Outcome |
| ABHD17C | SNV | Missense_Mutation | novel | c.649N>G | p.Thr217Ala | p.T217A | Q6PCB6 | protein_coding | deleterious(0.02) | benign(0.344) | TCGA-AC-A5EH-01 | Breast | breast invasive carcinoma | Female | >=65 | I/II | Unknown | Unknown | SD |
| ABHD17C | SNV | Missense_Mutation | c.718N>T | p.Arg240Cys | p.R240C | Q6PCB6 | protein_coding | deleterious(0) | probably_damaging(0.999) | TCGA-AA-3710-01 | Colorectum | colon adenocarcinoma | Female | >=65 | I/II | Unknown | Unknown | SD | |
| ABHD17C | SNV | Missense_Mutation | rs200549811 | c.973N>A | p.Glu325Lys | p.E325K | Q6PCB6 | protein_coding | deleterious(0.05) | benign(0.406) | TCGA-AA-A00N-01 | Colorectum | colon adenocarcinoma | Male | >=65 | I/II | Unknown | Unknown | PD |
| ABHD17C | SNV | Missense_Mutation | c.874C>T | p.Pro292Ser | p.P292S | Q6PCB6 | protein_coding | tolerated(0.06) | probably_damaging(0.938) | TCGA-CK-4951-01 | Colorectum | colon adenocarcinoma | Female | >=65 | I/II | Unknown | Unknown | PD | |
| ABHD17C | SNV | Missense_Mutation | rs200549811 | c.973G>A | p.Glu325Lys | p.E325K | Q6PCB6 | protein_coding | deleterious(0.05) | benign(0.406) | TCGA-EI-6917-01 | Colorectum | rectum adenocarcinoma | Male | <65 | III/IV | Chemotherapy | 5fluorouracil+oxaciplatina+l-folinian | SD |
| ABHD17C | SNV | Missense_Mutation | novel | c.968C>A | p.Ser323Tyr | p.S323Y | Q6PCB6 | protein_coding | deleterious(0) | benign(0.364) | TCGA-AJ-A5DW-01 | Endometrium | uterine corpus endometrioid carcinoma | Female | <65 | I/II | Unknown | Unknown | SD |
| ABHD17C | SNV | Missense_Mutation | novel | c.367N>C | p.Met123Leu | p.M123L | Q6PCB6 | protein_coding | tolerated(0.26) | benign(0.007) | TCGA-AX-A3FT-01 | Endometrium | uterine corpus endometrioid carcinoma | Female | <65 | I/II | Unknown | Unknown | SD |
| ABHD17C | SNV | Missense_Mutation | c.718N>T | p.Arg240Cys | p.R240C | Q6PCB6 | protein_coding | deleterious(0) | probably_damaging(0.999) | TCGA-BS-A0UV-01 | Endometrium | uterine corpus endometrioid carcinoma | Female | <65 | III/IV | Unknown | Unknown | SD | |
| ABHD17C | SNV | Missense_Mutation | novel | c.619C>T | p.Leu207Phe | p.L207F | Q6PCB6 | protein_coding | deleterious(0) | probably_damaging(0.97) | TCGA-EC-A1QX-01 | Endometrium | uterine corpus endometrioid carcinoma | Female | >=65 | I/II | Chemotherapy | cyclophosphamide | PD |
| ABHD17C | SNV | Missense_Mutation | novel | c.556N>C | p.Asp186His | p.D186H | Q6PCB6 | protein_coding | deleterious(0) | probably_damaging(0.999) | TCGA-EO-A22T-01 | Endometrium | uterine corpus endometrioid carcinoma | Female | <65 | I/II | Unknown | Unknown | SD |
| Page: 1 2 |
Top |
Related drugs of malignant transformation related genes |
| Identification of chemicals and drugs interact with genes involved in malignant transfromation |
| (DGIdb 4.0) |
| Entrez ID | Symbol | Category | Interaction Types | Drug Claim Name | Drug Name | PMIDs |
| Page: 1 |

Copyright 2023-Present -The University of Texas Health Science Center at Houston |