
|
|||||
|
 | |
| |
| |
| |
| |
| |
|
Gene: ABHD17A |
Gene summary for ABHD17A |
| Gene information | Species | Human | Gene symbol | ABHD17A | Gene ID | 81926 |
| Gene name | abhydrolase domain containing 17A, depalmitoylase | |
| Gene Alias | C19orf27 | |
| Cytomap | 19p13.3 | |
| Gene Type | protein-coding | GO ID | GO:0002084 | UniProtAcc | Q96GS6 |
Top |
Malignant transformation analysis |
| Identification of the aberrant gene expression in precancerous and cancerous lesions by comparing the gene expression of stem-like cells in diseased tissues with normal stem cells |
| Entrez ID | Symbol | Replicates | Species | Organ | Tissue | Adj P-value | Log2FC | Malignancy |
| 81926 | ABHD17A | LZE24T | Human | Esophagus | ESCC | 4.47e-13 | 2.76e-01 | 0.0596 |
| 81926 | ABHD17A | LZE21T | Human | Esophagus | ESCC | 6.43e-03 | 2.16e-01 | 0.0655 |
| 81926 | ABHD17A | P1T-E | Human | Esophagus | ESCC | 5.23e-11 | 4.65e-01 | 0.0875 |
| 81926 | ABHD17A | P2T-E | Human | Esophagus | ESCC | 6.40e-10 | 1.63e-01 | 0.1177 |
| 81926 | ABHD17A | P4T-E | Human | Esophagus | ESCC | 1.97e-18 | 3.99e-01 | 0.1323 |
| 81926 | ABHD17A | P5T-E | Human | Esophagus | ESCC | 2.47e-06 | 9.88e-02 | 0.1327 |
| 81926 | ABHD17A | P8T-E | Human | Esophagus | ESCC | 1.20e-11 | 1.34e-01 | 0.0889 |
| 81926 | ABHD17A | P9T-E | Human | Esophagus | ESCC | 2.48e-07 | 3.24e-01 | 0.1131 |
| 81926 | ABHD17A | P10T-E | Human | Esophagus | ESCC | 1.03e-11 | 3.35e-01 | 0.116 |
| 81926 | ABHD17A | P11T-E | Human | Esophagus | ESCC | 5.35e-03 | 1.77e-01 | 0.1426 |
| 81926 | ABHD17A | P12T-E | Human | Esophagus | ESCC | 1.46e-06 | 1.25e-01 | 0.1122 |
| 81926 | ABHD17A | P15T-E | Human | Esophagus | ESCC | 1.28e-06 | 1.31e-01 | 0.1149 |
| 81926 | ABHD17A | P17T-E | Human | Esophagus | ESCC | 5.16e-04 | 2.09e-01 | 0.1278 |
| 81926 | ABHD17A | P20T-E | Human | Esophagus | ESCC | 2.58e-08 | 1.60e-01 | 0.1124 |
| 81926 | ABHD17A | P21T-E | Human | Esophagus | ESCC | 1.93e-12 | 1.47e-01 | 0.1617 |
| 81926 | ABHD17A | P22T-E | Human | Esophagus | ESCC | 2.01e-17 | 2.61e-01 | 0.1236 |
| 81926 | ABHD17A | P23T-E | Human | Esophagus | ESCC | 7.82e-19 | 4.94e-01 | 0.108 |
| 81926 | ABHD17A | P24T-E | Human | Esophagus | ESCC | 1.99e-06 | 1.41e-01 | 0.1287 |
| 81926 | ABHD17A | P26T-E | Human | Esophagus | ESCC | 1.05e-11 | 2.40e-01 | 0.1276 |
| 81926 | ABHD17A | P27T-E | Human | Esophagus | ESCC | 7.76e-19 | 2.15e-01 | 0.1055 |
| Page: 1 2 3 4 5 6 |
| Tissue | Expression Dynamics | Abbreviation |
| Esophagus |  | ESCC: Esophageal squamous cell carcinoma |
| HGIN: High-grade intraepithelial neoplasias | ||
| LGIN: Low-grade intraepithelial neoplasias | ||
| Liver | 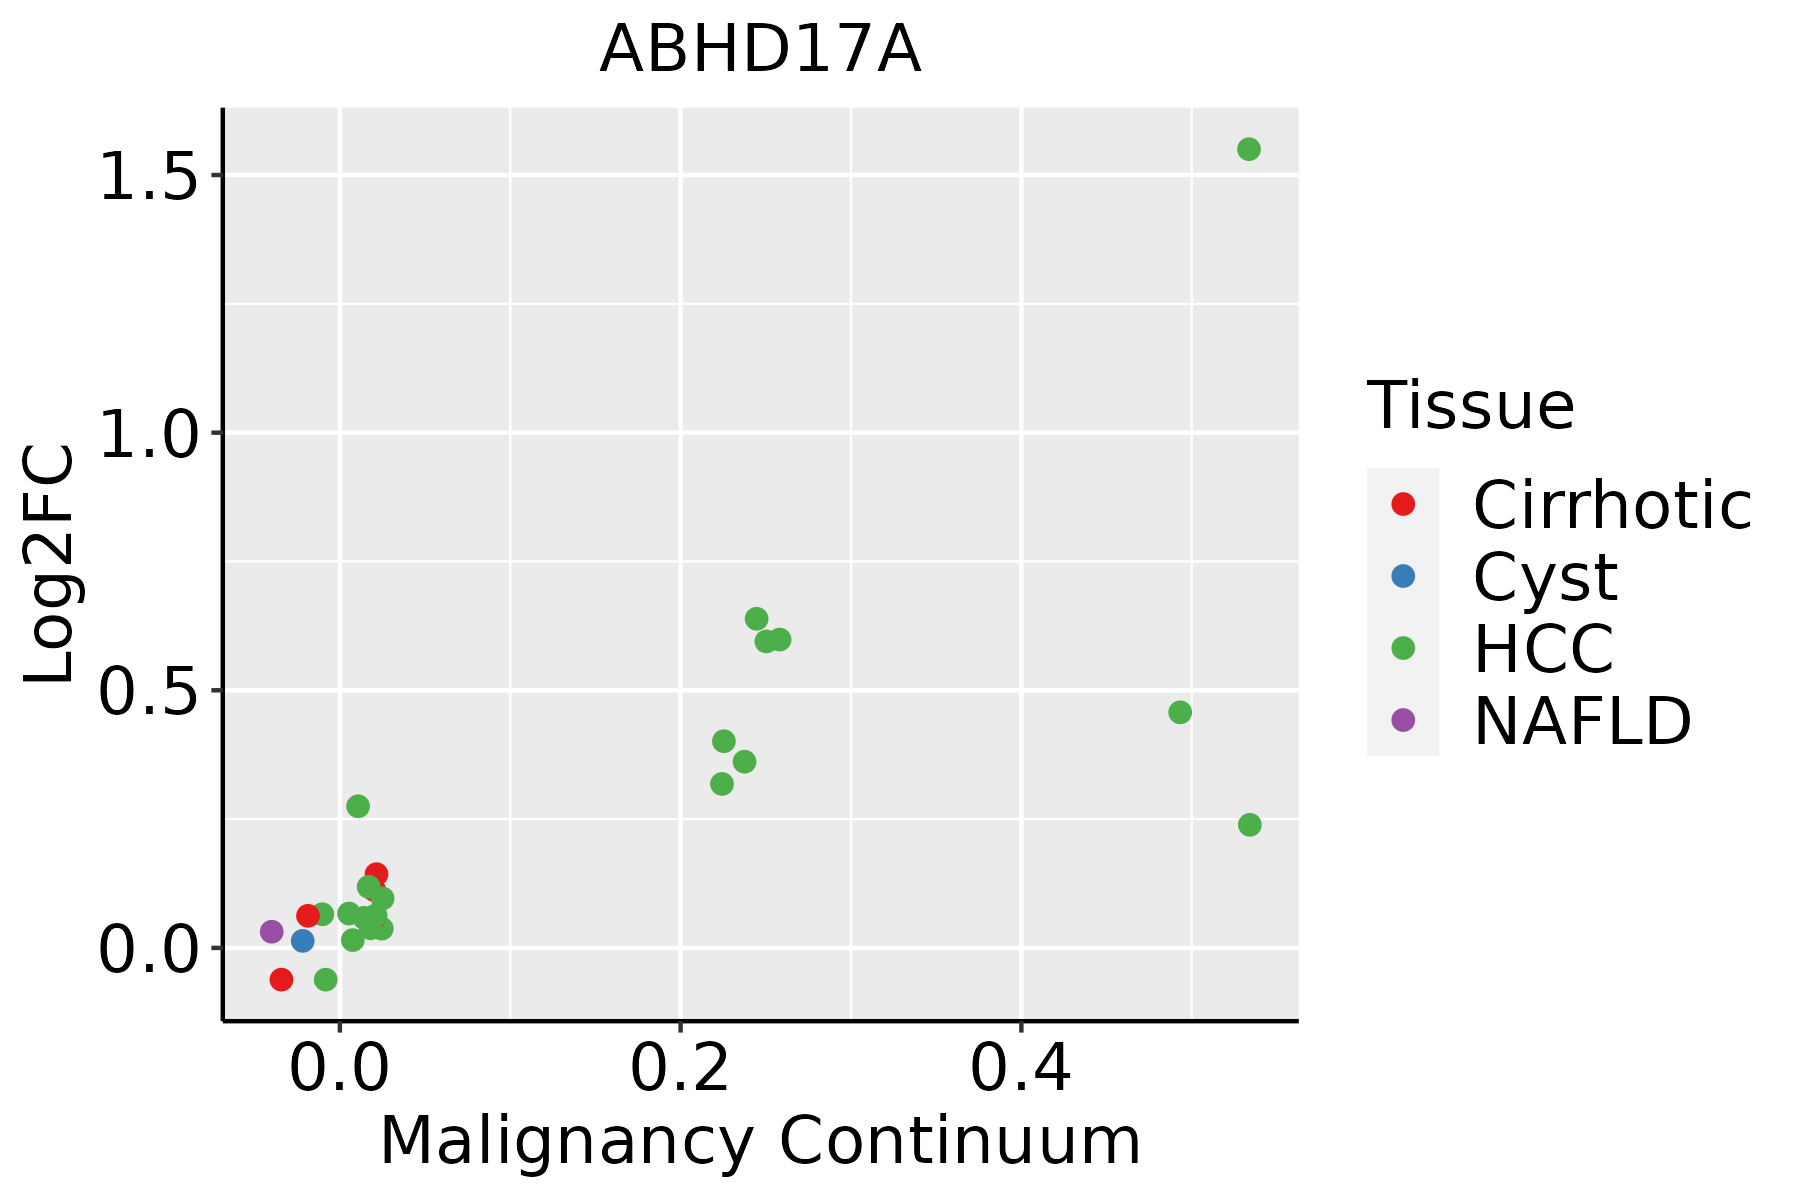 | HCC: Hepatocellular carcinoma |
| NAFLD: Non-alcoholic fatty liver disease | ||
| Oral Cavity |  | EOLP: Erosive Oral lichen planus |
| LP: leukoplakia | ||
| NEOLP: Non-erosive oral lichen planus | ||
| OSCC: Oral squamous cell carcinoma | ||
| Skin | 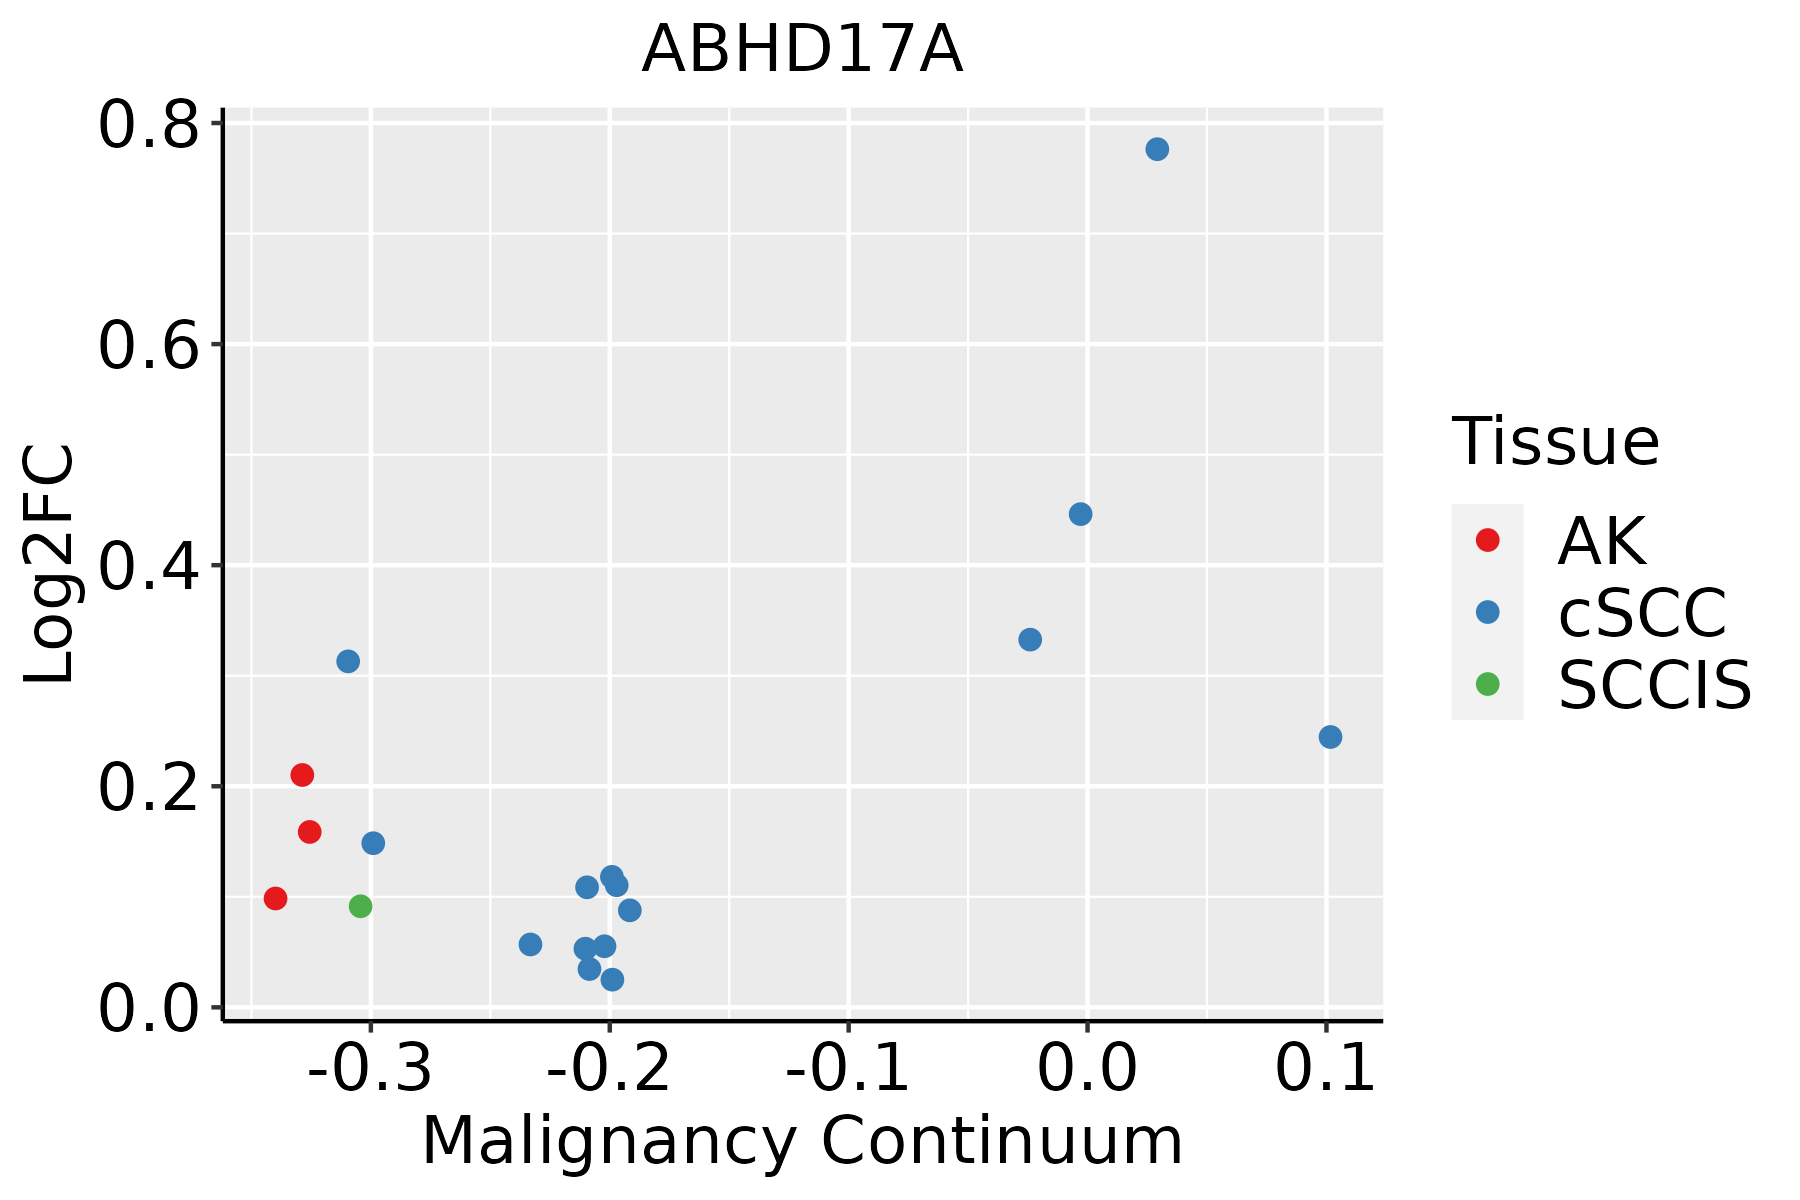 | AK: Actinic keratosis |
| cSCC: Cutaneous squamous cell carcinoma | ||
| SCCIS:squamous cell carcinoma in situ | ||
| Thyroid | 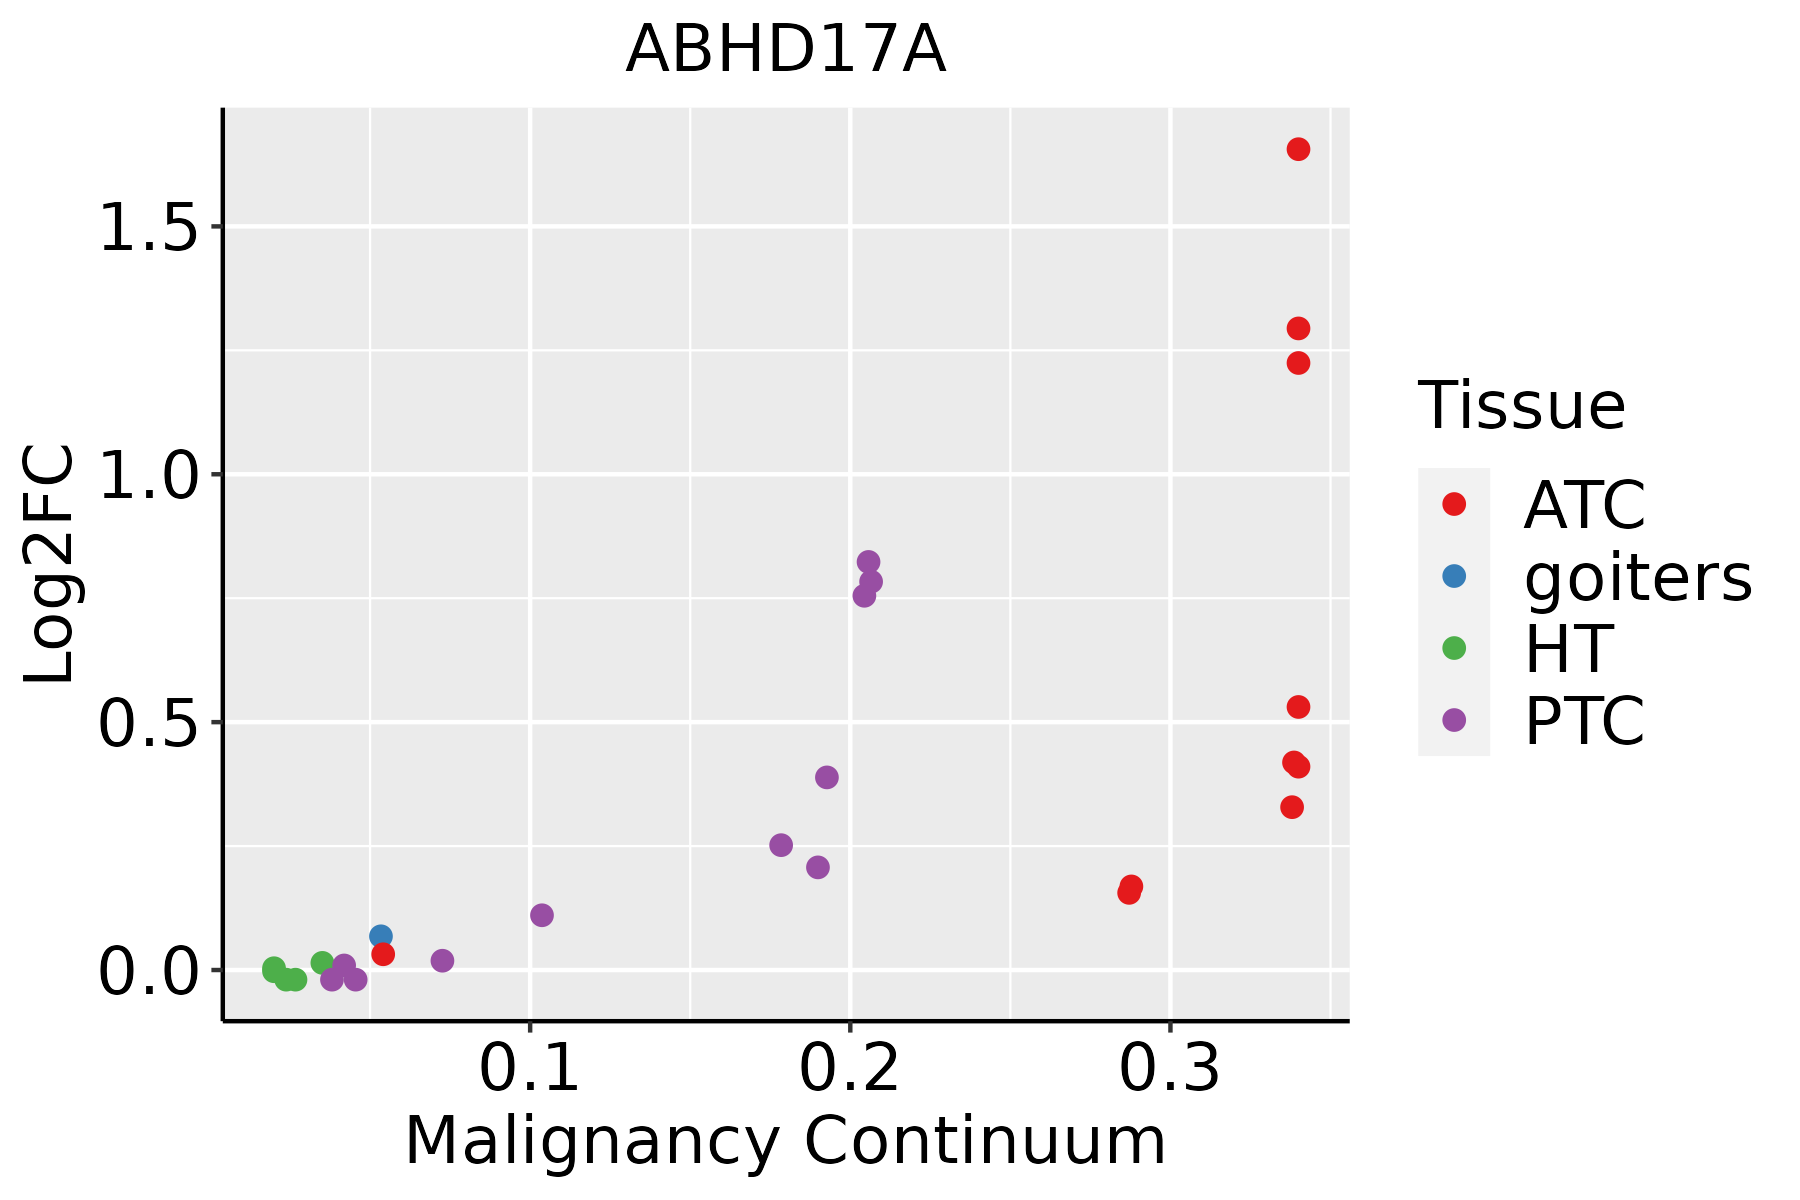 | ATC: Anaplastic thyroid cancer |
| HT: Hashimoto's thyroiditis | ||
| PTC: Papillary thyroid cancer |
| ∗log2FC in expression of this searched gene in stem-like cells from each diseased tissue sample relative to stem-like cells in normal samples in each tissue plotted against the malignancy continuum. Samples are colored based on if they are from different disease stage. |
Top |
Malignant transformation related pathway analysis |
| Find out the enriched GO biological processes and KEGG pathways involved in transition from healthy to precancer to cancer |
| Tissue | Disease Stage | Enriched GO biological Processes |
| Colorectum | AD |  |
| Colorectum | SER |  |
| Colorectum | MSS |  |
| Colorectum | MSI-H |  |
| Colorectum | FAP |  |
| ∗Top 15 enriched GO BP terms are showed in the bar plot of each disease state in each tissue. Each row represents a significant GO biological process which is colored according to the -log10(p.adjust). |
| Page: 1 2 3 4 5 6 7 8 9 |
| GO ID | Tissue | Disease Stage | Description | Gene Ratio | Bg Ratio | pvalue | p.adjust | Count |
| GO:1903829111 | Esophagus | ESCC | positive regulation of cellular protein localization | 199/8552 | 276/18723 | 2.99e-19 | 3.45e-17 | 199 |
| GO:00356015 | Esophagus | ESCC | protein deacylation | 79/8552 | 112/18723 | 8.30e-08 | 1.42e-06 | 79 |
| GO:00987325 | Esophagus | ESCC | macromolecule deacylation | 80/8552 | 116/18723 | 3.19e-07 | 4.50e-06 | 80 |
| GO:00726985 | Esophagus | ESCC | protein localization to microtubule cytoskeleton | 43/8552 | 54/18723 | 3.28e-07 | 4.61e-06 | 43 |
| GO:00443804 | Esophagus | ESCC | protein localization to cytoskeleton | 45/8552 | 58/18723 | 6.89e-07 | 8.99e-06 | 45 |
| GO:00421573 | Esophagus | ESCC | lipoprotein metabolic process | 86/8552 | 135/18723 | 1.78e-05 | 1.57e-04 | 86 |
| GO:19038289 | Esophagus | ESCC | negative regulation of cellular protein localization | 76/8552 | 117/18723 | 1.97e-05 | 1.72e-04 | 76 |
| GO:0035372 | Esophagus | ESCC | protein localization to microtubule | 15/8552 | 18/18723 | 1.20e-03 | 5.88e-03 | 15 |
| GO:00360106 | Esophagus | ESCC | protein localization to endosome | 18/8552 | 24/18723 | 3.43e-03 | 1.41e-02 | 18 |
| GO:00020842 | Esophagus | ESCC | protein depalmitoylation | 9/8552 | 10/18723 | 5.09e-03 | 1.92e-02 | 9 |
| GO:00421593 | Esophagus | ESCC | lipoprotein catabolic process | 12/8552 | 15/18723 | 7.31e-03 | 2.63e-02 | 12 |
| GO:190382922 | Liver | HCC | positive regulation of cellular protein localization | 199/7958 | 276/18723 | 1.15e-23 | 2.62e-21 | 199 |
| GO:00421571 | Liver | HCC | lipoprotein metabolic process | 86/7958 | 135/18723 | 5.21e-07 | 8.38e-06 | 86 |
| GO:190382811 | Liver | HCC | negative regulation of cellular protein localization | 71/7958 | 117/18723 | 5.44e-05 | 5.12e-04 | 71 |
| GO:00360103 | Liver | HCC | protein localization to endosome | 19/7958 | 24/18723 | 2.80e-04 | 2.02e-03 | 19 |
| GO:00443802 | Liver | HCC | protein localization to cytoskeleton | 38/7958 | 58/18723 | 3.37e-04 | 2.36e-03 | 38 |
| GO:0042159 | Liver | HCC | lipoprotein catabolic process | 13/7958 | 15/18723 | 5.67e-04 | 3.61e-03 | 13 |
| GO:0098732 | Liver | HCC | macromolecule deacylation | 67/7958 | 116/18723 | 6.46e-04 | 3.99e-03 | 67 |
| GO:007269811 | Liver | HCC | protein localization to microtubule cytoskeleton | 35/7958 | 54/18723 | 7.73e-04 | 4.65e-03 | 35 |
| GO:00356011 | Liver | HCC | protein deacylation | 64/7958 | 112/18723 | 1.23e-03 | 6.83e-03 | 64 |
| Page: 1 2 3 4 |
| Pathway ID | Tissue | Disease Stage | Description | Gene Ratio | Bg Ratio | pvalue | p.adjust | qvalue | Count |
| Page: 1 |
Top |
Cell-cell communication analysis |
| Identification of potential cell-cell interactions between two cell types and their ligand-receptor pairs for different disease states |
| Ligand | Receptor | LRpair | Pathway | Tissue | Disease Stage |
| Page: 1 |
Top |
Single-cell gene regulatory network inference analysis |
| Find out the significant the regulons (TFs) and the target genes of each regulon across cell types for different disease states |
| TF | Cell Type | Tissue | Disease Stage | Target Gene | RSS | Regulon Activity |
| ∗The dot plots of a searched regulon are shown for all cell subpopulations in each disease state of each tissue based on the regulon specific score inferred using pySCENIC and by calculating the average expression. |
| Page: 1 |
Top |
Somatic mutation of malignant transformation related genes |
| Annotation of somatic variants for genes involved in malignant transformation |
| Hugo Symbol | Variant Class | Variant Classification | dbSNP RS | HGVSc | HGVSp | HGVSp Short | SWISSPROT | BIOTYPE | SIFT | PolyPhen | Tumor Sample Barcode | Tissue | Histology | Sex | Age | Stage | Therapy Types | Drugs | Outcome |
| ABHD17A | SNV | Missense_Mutation | rs771725139 | c.802N>T | p.Gly268Cys | p.G268C | Q96GS6 | protein_coding | deleterious(0) | probably_damaging(0.999) | TCGA-E2-A14N-01 | Breast | breast invasive carcinoma | Female | <65 | I/II | Chemotherapy | cyclophosphamide | SD |
| ABHD17A | SNV | Missense_Mutation | novel | c.299C>G | p.Ser100Cys | p.S100C | Q96GS6 | protein_coding | tolerated(0.11) | benign(0.012) | TCGA-OL-A66P-01 | Breast | breast invasive carcinoma | Female | >=65 | I/II | Chemotherapy | cytoxan | CR |
| ABHD17A | SNV | Missense_Mutation | novel | c.962G>A | p.Cys321Tyr | p.C321Y | Q96GS6 | protein_coding | deleterious(0) | probably_damaging(0.993) | TCGA-EA-A410-01 | Cervix | cervical & endocervical cancer | Female | <65 | I/II | Unknown | Unknown | SD |
| ABHD17A | SNV | Missense_Mutation | rs773838028 | c.889C>T | p.Pro297Ser | p.P297S | Q96GS6 | protein_coding | deleterious(0) | probably_damaging(0.944) | TCGA-ZJ-AAXD-01 | Cervix | cervical & endocervical cancer | Female | <65 | III/IV | Unknown | Unknown | SD |
| ABHD17A | SNV | Missense_Mutation | c.911N>T | p.Thr304Met | p.T304M | Q96GS6 | protein_coding | deleterious(0.02) | benign(0.397) | TCGA-AD-6889-01 | Colorectum | colon adenocarcinoma | Male | >=65 | I/II | Chemotherapy | xeloda | PD | |
| ABHD17A | SNV | Missense_Mutation | rs146504373 | c.295N>A | p.Val99Ile | p.V99I | Q96GS6 | protein_coding | tolerated(1) | benign(0.006) | TCGA-CK-4951-01 | Colorectum | colon adenocarcinoma | Female | >=65 | I/II | Unknown | Unknown | PD |
| ABHD17A | SNV | Missense_Mutation | c.298N>C | p.Ser100Pro | p.S100P | Q96GS6 | protein_coding | tolerated(0.16) | benign(0.308) | TCGA-CM-6162-01 | Colorectum | colon adenocarcinoma | Female | <65 | III/IV | Chemotherapy | oxaliplatin | SD | |
| ABHD17A | SNV | Missense_Mutation | rs765695569 | c.563N>A | p.Arg188His | p.R188H | Q96GS6 | protein_coding | tolerated(0.34) | possibly_damaging(0.629) | TCGA-AX-A2HC-01 | Endometrium | uterine corpus endometrioid carcinoma | Female | <65 | III/IV | Chemotherapy | paclitaxel | PD |
| ABHD17A | SNV | Missense_Mutation | novel | c.172N>A | p.Ala58Thr | p.A58T | Q96GS6 | protein_coding | tolerated(0.47) | benign(0.01) | TCGA-AX-A2HJ-01 | Endometrium | uterine corpus endometrioid carcinoma | Female | <65 | I/II | Unknown | Unknown | SD |
| ABHD17A | SNV | Missense_Mutation | novel | c.742G>A | p.Val248Met | p.V248M | Q96GS6 | protein_coding | deleterious(0) | possibly_damaging(0.501) | TCGA-B5-A3FC-01 | Endometrium | uterine corpus endometrioid carcinoma | Female | <65 | I/II | Unknown | Unknown | SD |
| Page: 1 2 3 |
Top |
Related drugs of malignant transformation related genes |
| Identification of chemicals and drugs interact with genes involved in malignant transfromation |
| (DGIdb 4.0) |
| Entrez ID | Symbol | Category | Interaction Types | Drug Claim Name | Drug Name | PMIDs |
| Page: 1 |

Copyright 2023-Present -The University of Texas Health Science Center at Houston |