
|
|||||
|
 | |
| |
| |
| |
| |
| |
|
Gene: ABHD16A |
Gene summary for ABHD16A |
| Gene information | Species | Human | Gene symbol | ABHD16A | Gene ID | 7920 |
| Gene name | abhydrolase domain containing 16A, phospholipase | |
| Gene Alias | BAT5 | |
| Cytomap | 6p21.33 | |
| Gene Type | protein-coding | GO ID | GO:0006575 | UniProtAcc | B3KNX9 |
Top |
Malignant transformation analysis |
| Identification of the aberrant gene expression in precancerous and cancerous lesions by comparing the gene expression of stem-like cells in diseased tissues with normal stem cells |
| Entrez ID | Symbol | Replicates | Species | Organ | Tissue | Adj P-value | Log2FC | Malignancy |
| 7920 | ABHD16A | LZE4T | Human | Esophagus | ESCC | 2.18e-06 | 1.93e-01 | 0.0811 |
| 7920 | ABHD16A | LZE5T | Human | Esophagus | ESCC | 1.57e-02 | 2.22e-01 | 0.0514 |
| 7920 | ABHD16A | LZE7T | Human | Esophagus | ESCC | 5.23e-19 | 7.62e-01 | 0.0667 |
| 7920 | ABHD16A | LZE8T | Human | Esophagus | ESCC | 1.08e-12 | 3.67e-01 | 0.067 |
| 7920 | ABHD16A | LZE20T | Human | Esophagus | ESCC | 7.18e-07 | 2.61e-01 | 0.0662 |
| 7920 | ABHD16A | LZE21D1 | Human | Esophagus | HGIN | 5.38e-03 | 3.63e-01 | 0.0632 |
| 7920 | ABHD16A | LZE22D1 | Human | Esophagus | HGIN | 5.14e-03 | 2.19e-01 | 0.0595 |
| 7920 | ABHD16A | LZE22T | Human | Esophagus | ESCC | 1.00e-09 | 4.66e-01 | 0.068 |
| 7920 | ABHD16A | LZE24T | Human | Esophagus | ESCC | 4.72e-43 | 7.70e-01 | 0.0596 |
| 7920 | ABHD16A | LZE21T | Human | Esophagus | ESCC | 1.37e-06 | 3.44e-01 | 0.0655 |
| 7920 | ABHD16A | LZE6T | Human | Esophagus | ESCC | 2.61e-09 | 4.51e-01 | 0.0845 |
| 7920 | ABHD16A | P1T-E | Human | Esophagus | ESCC | 2.44e-06 | 2.78e-01 | 0.0875 |
| 7920 | ABHD16A | P2T-E | Human | Esophagus | ESCC | 1.24e-51 | 8.89e-01 | 0.1177 |
| 7920 | ABHD16A | P4T-E | Human | Esophagus | ESCC | 1.72e-42 | 8.20e-01 | 0.1323 |
| 7920 | ABHD16A | P5T-E | Human | Esophagus | ESCC | 6.56e-15 | 2.61e-01 | 0.1327 |
| 7920 | ABHD16A | P8T-E | Human | Esophagus | ESCC | 3.87e-34 | 5.69e-01 | 0.0889 |
| 7920 | ABHD16A | P9T-E | Human | Esophagus | ESCC | 9.50e-13 | 3.26e-01 | 0.1131 |
| 7920 | ABHD16A | P10T-E | Human | Esophagus | ESCC | 1.35e-23 | 4.39e-01 | 0.116 |
| 7920 | ABHD16A | P11T-E | Human | Esophagus | ESCC | 1.85e-29 | 7.68e-01 | 0.1426 |
| 7920 | ABHD16A | P12T-E | Human | Esophagus | ESCC | 1.15e-45 | 7.80e-01 | 0.1122 |
| Page: 1 2 3 4 |
| Tissue | Expression Dynamics | Abbreviation |
| Esophagus | 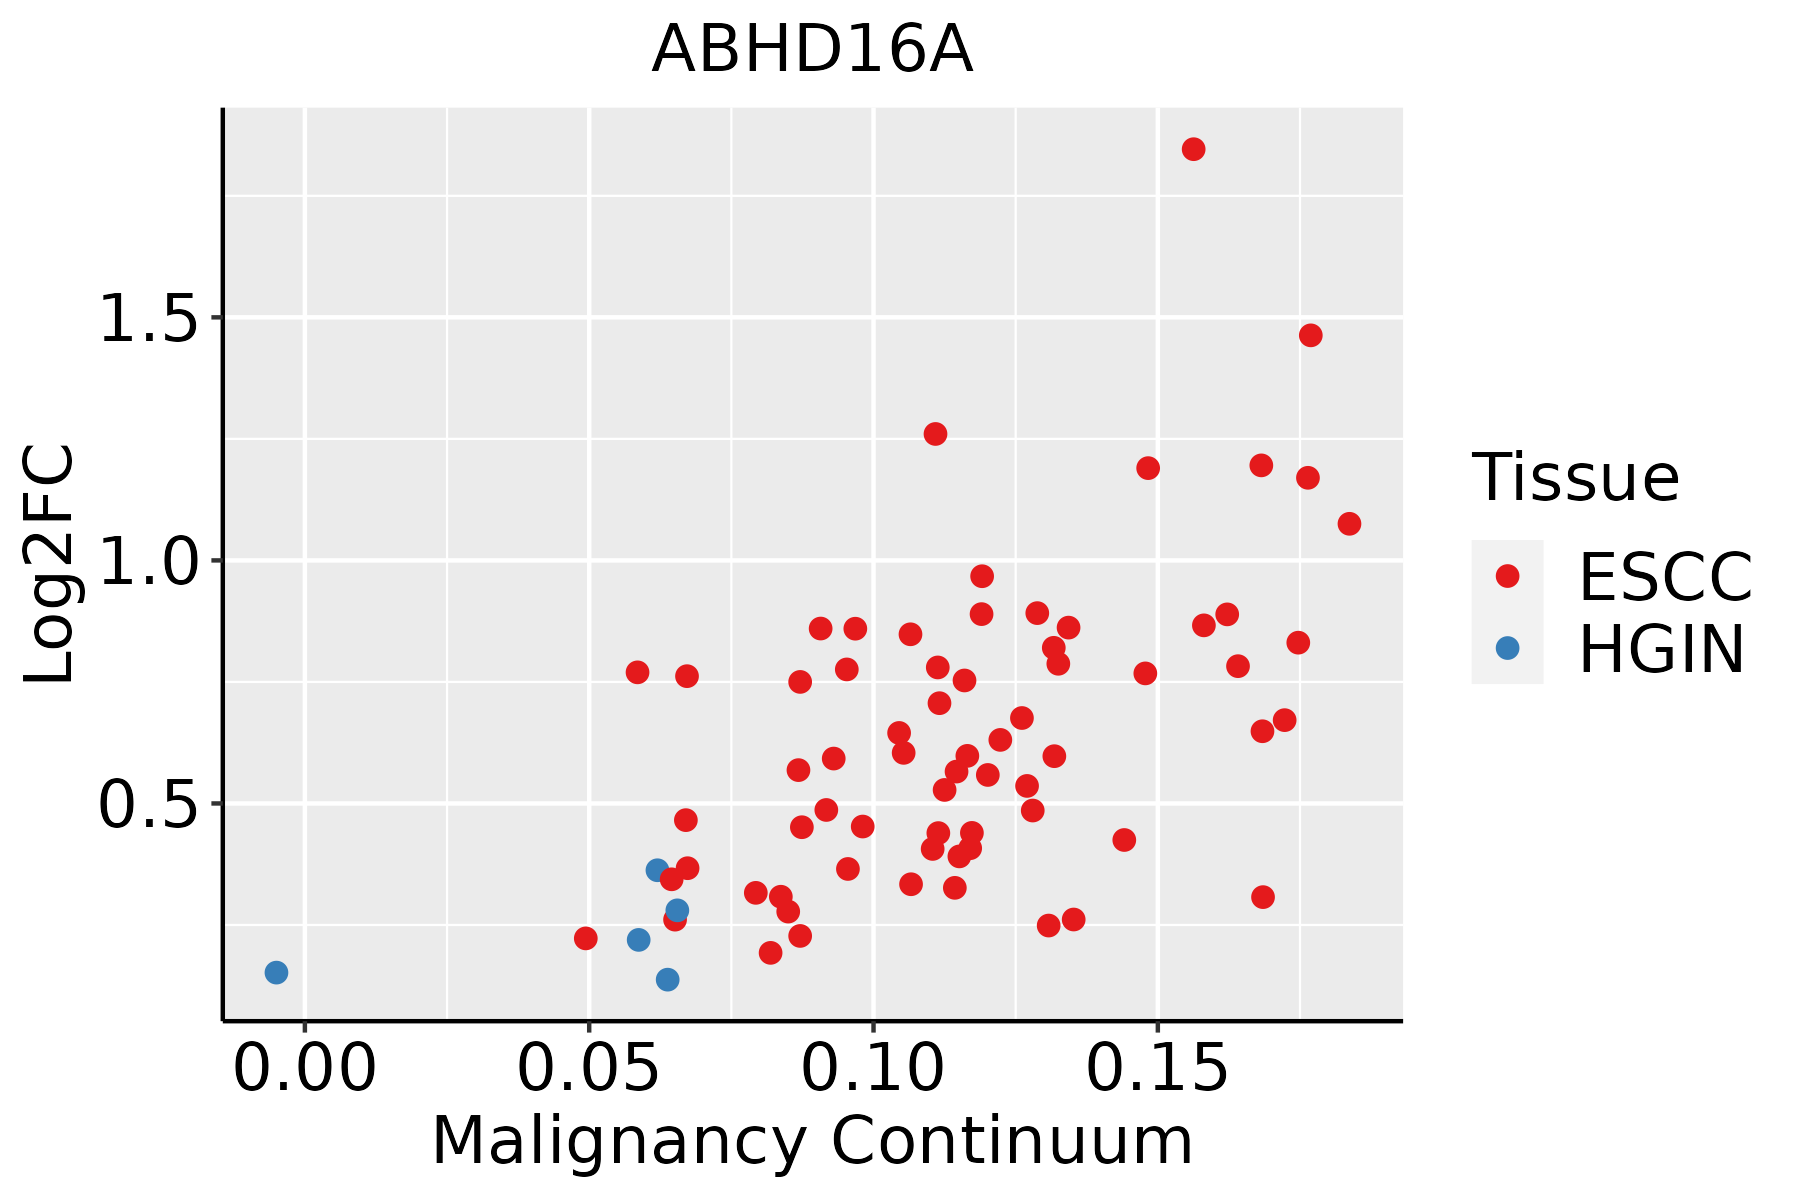 | ESCC: Esophageal squamous cell carcinoma |
| HGIN: High-grade intraepithelial neoplasias | ||
| LGIN: Low-grade intraepithelial neoplasias | ||
| Liver | 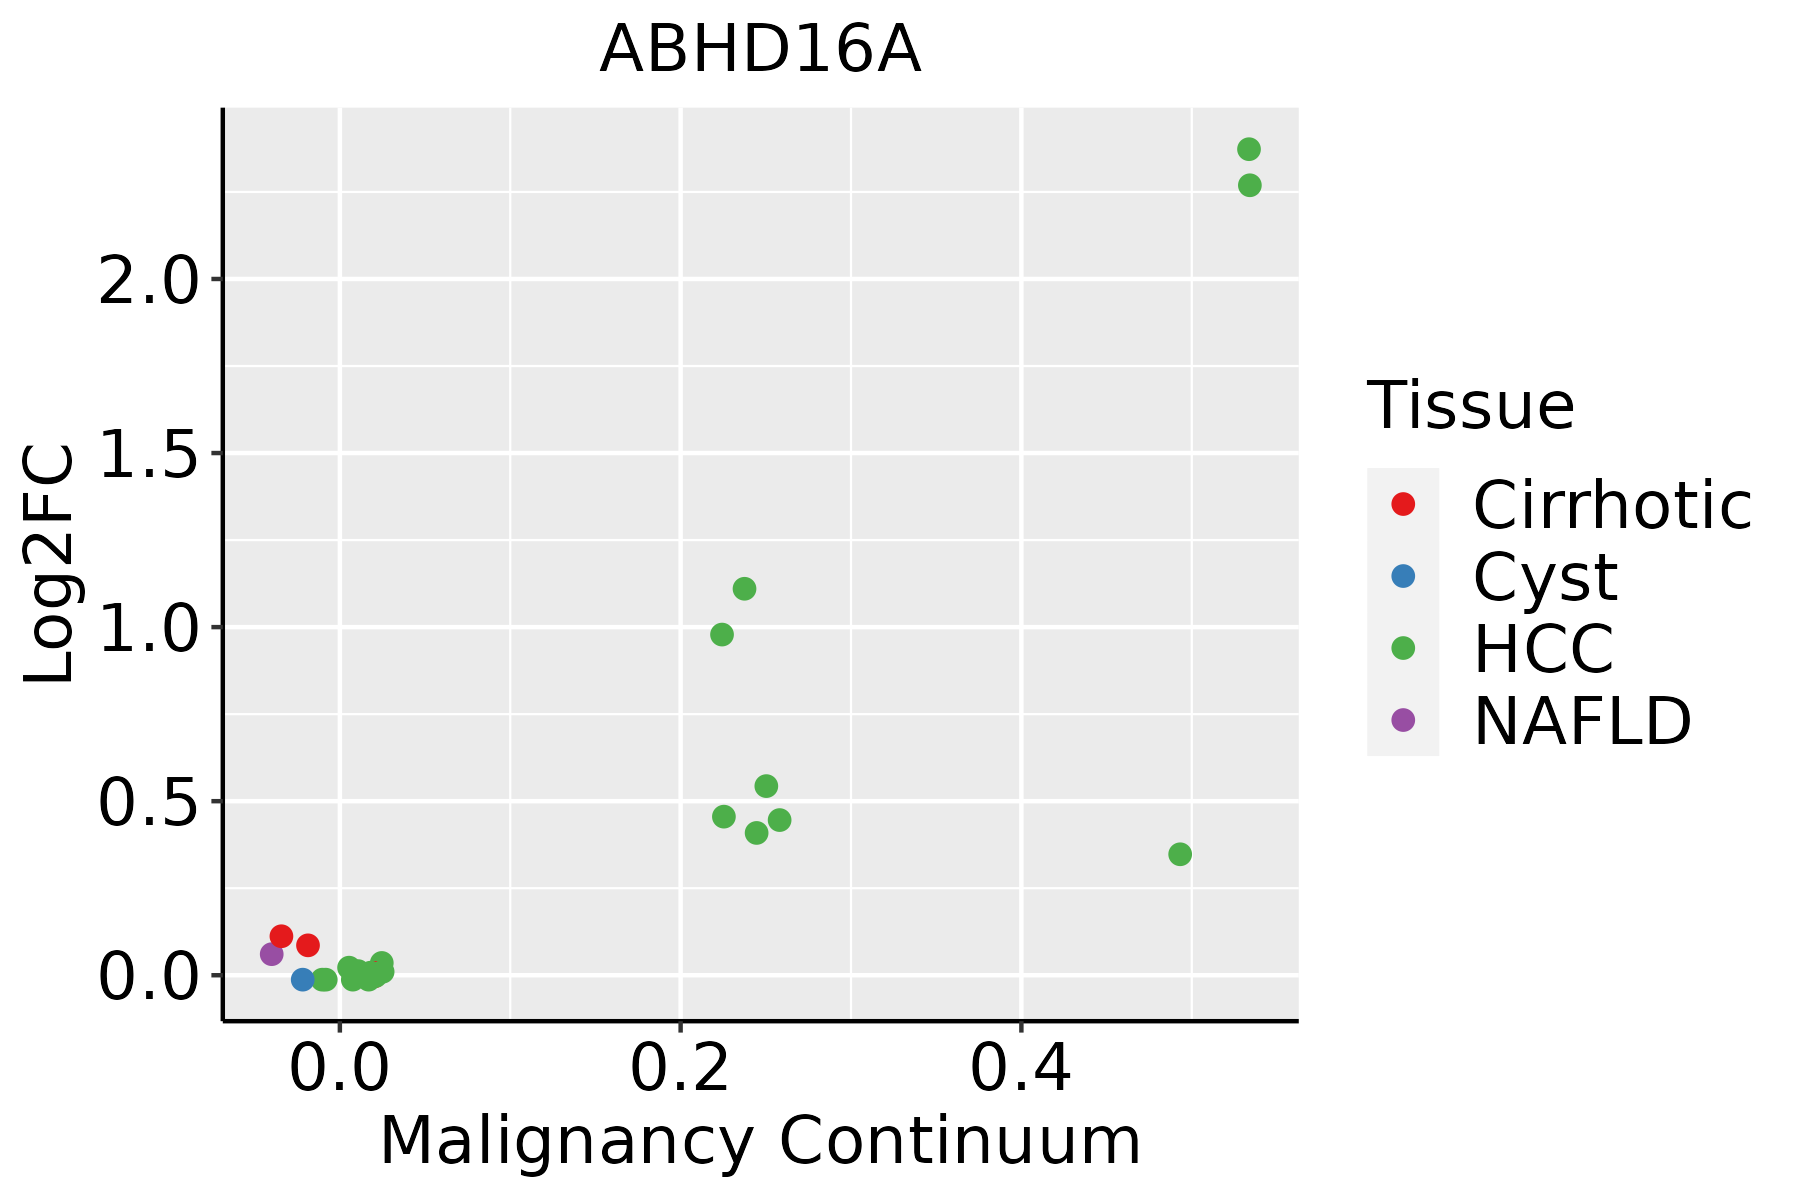 | HCC: Hepatocellular carcinoma |
| NAFLD: Non-alcoholic fatty liver disease |
| ∗log2FC in expression of this searched gene in stem-like cells from each diseased tissue sample relative to stem-like cells in normal samples in each tissue plotted against the malignancy continuum. Samples are colored based on if they are from different disease stage. |
Top |
Malignant transformation related pathway analysis |
| Find out the enriched GO biological processes and KEGG pathways involved in transition from healthy to precancer to cancer |
| Tissue | Disease Stage | Enriched GO biological Processes |
| Colorectum | AD |  |
| Colorectum | SER |  |
| Colorectum | MSS |  |
| Colorectum | MSI-H |  |
| Colorectum | FAP |  |
| ∗Top 15 enriched GO BP terms are showed in the bar plot of each disease state in each tissue. Each row represents a significant GO biological process which is colored according to the -log10(p.adjust). |
| Page: 1 2 3 4 5 6 7 8 9 |
| GO ID | Tissue | Disease Stage | Description | Gene Ratio | Bg Ratio | pvalue | p.adjust | Count |
| GO:00987325 | Esophagus | ESCC | macromolecule deacylation | 80/8552 | 116/18723 | 3.19e-07 | 4.50e-06 | 80 |
| GO:00066446 | Esophagus | ESCC | phospholipid metabolic process | 218/8552 | 383/18723 | 5.37e-06 | 5.59e-05 | 218 |
| GO:00066505 | Esophagus | ESCC | glycerophospholipid metabolic process | 174/8552 | 306/18723 | 4.92e-05 | 3.85e-04 | 174 |
| GO:00065757 | Esophagus | ESCC | cellular modified amino acid metabolic process | 112/8552 | 188/18723 | 8.31e-05 | 6.06e-04 | 112 |
| GO:00464864 | Esophagus | ESCC | glycerolipid metabolic process | 211/8552 | 392/18723 | 6.51e-04 | 3.46e-03 | 211 |
| GO:00442427 | Esophagus | ESCC | cellular lipid catabolic process | 121/8552 | 214/18723 | 8.63e-04 | 4.43e-03 | 121 |
| GO:00160427 | Esophagus | ESCC | lipid catabolic process | 168/8552 | 320/18723 | 7.97e-03 | 2.84e-02 | 168 |
| GO:004424222 | Liver | HCC | cellular lipid catabolic process | 134/7958 | 214/18723 | 2.07e-09 | 5.79e-08 | 134 |
| GO:000657521 | Liver | HCC | cellular modified amino acid metabolic process | 119/7958 | 188/18723 | 6.47e-09 | 1.67e-07 | 119 |
| GO:00066444 | Liver | HCC | phospholipid metabolic process | 214/7958 | 383/18723 | 7.25e-08 | 1.48e-06 | 214 |
| GO:004648611 | Liver | HCC | glycerolipid metabolic process | 215/7958 | 392/18723 | 4.54e-07 | 7.49e-06 | 215 |
| GO:001604221 | Liver | HCC | lipid catabolic process | 175/7958 | 320/18723 | 6.50e-06 | 7.88e-05 | 175 |
| GO:00066504 | Liver | HCC | glycerophospholipid metabolic process | 168/7958 | 306/18723 | 7.27e-06 | 8.62e-05 | 168 |
| GO:00464342 | Liver | HCC | organophosphate catabolic process | 89/7958 | 155/18723 | 1.24e-04 | 1.03e-03 | 89 |
| GO:0098732 | Liver | HCC | macromolecule deacylation | 67/7958 | 116/18723 | 6.46e-04 | 3.99e-03 | 67 |
| GO:000663911 | Liver | HCC | acylglycerol metabolic process | 72/7958 | 128/18723 | 1.16e-03 | 6.54e-03 | 72 |
| GO:000663811 | Liver | HCC | neutral lipid metabolic process | 72/7958 | 129/18723 | 1.54e-03 | 8.14e-03 | 72 |
| GO:1901568 | Liver | HCC | fatty acid derivative metabolic process | 43/7958 | 74/18723 | 4.85e-03 | 2.04e-02 | 43 |
| GO:0098734 | Liver | HCC | macromolecule depalmitoylation | 11/7958 | 14/18723 | 6.81e-03 | 2.73e-02 | 11 |
| Page: 1 |
| Pathway ID | Tissue | Disease Stage | Description | Gene Ratio | Bg Ratio | pvalue | p.adjust | qvalue | Count |
| hsa005615 | Liver | HCC | Glycerolipid metabolism | 41/4020 | 63/8465 | 3.59e-03 | 1.12e-02 | 6.22e-03 | 41 |
| hsa0056112 | Liver | HCC | Glycerolipid metabolism | 41/4020 | 63/8465 | 3.59e-03 | 1.12e-02 | 6.22e-03 | 41 |
| Page: 1 |
Top |
Cell-cell communication analysis |
| Identification of potential cell-cell interactions between two cell types and their ligand-receptor pairs for different disease states |
| Ligand | Receptor | LRpair | Pathway | Tissue | Disease Stage |
| Page: 1 |
Top |
Single-cell gene regulatory network inference analysis |
| Find out the significant the regulons (TFs) and the target genes of each regulon across cell types for different disease states |
| TF | Cell Type | Tissue | Disease Stage | Target Gene | RSS | Regulon Activity |
| ∗The dot plots of a searched regulon are shown for all cell subpopulations in each disease state of each tissue based on the regulon specific score inferred using pySCENIC and by calculating the average expression. |
| Page: 1 |
Top |
Somatic mutation of malignant transformation related genes |
| Annotation of somatic variants for genes involved in malignant transformation |
| Hugo Symbol | Variant Class | Variant Classification | dbSNP RS | HGVSc | HGVSp | HGVSp Short | SWISSPROT | BIOTYPE | SIFT | PolyPhen | Tumor Sample Barcode | Tissue | Histology | Sex | Age | Stage | Therapy Types | Drugs | Outcome |
| ABHD16A | SNV | Missense_Mutation | c.1477N>A | p.Glu493Lys | p.E493K | O95870 | protein_coding | deleterious(0.01) | benign(0.027) | TCGA-A8-A07O-01 | Breast | breast invasive carcinoma | Female | <65 | I/II | Chemotherapy | CR | ||
| ABHD16A | SNV | Missense_Mutation | c.507G>C | p.Lys169Asn | p.K169N | O95870 | protein_coding | tolerated(0.18) | probably_damaging(0.981) | TCGA-AR-A24H-01 | Breast | breast invasive carcinoma | Female | >=65 | I/II | Hormone Therapy | tamoxiphen | SD | |
| ABHD16A | deletion | Frame_Shift_Del | novel | c.1106delN | p.Pro369GlnfsTer6 | p.P369Qfs*6 | O95870 | protein_coding | TCGA-D8-A27V-01 | Breast | breast invasive carcinoma | Female | <65 | I/II | Hormone Therapy | tamoxiphen | SD | ||
| ABHD16A | SNV | Missense_Mutation | c.176N>A | p.Ser59Asn | p.S59N | O95870 | protein_coding | tolerated(0.34) | benign(0.378) | TCGA-AA-3672-01 | Colorectum | colon adenocarcinoma | Female | >=65 | III/IV | Unknown | Unknown | SD | |
| ABHD16A | SNV | Missense_Mutation | c.1174N>T | p.Pro392Ser | p.P392S | O95870 | protein_coding | deleterious(0) | probably_damaging(0.999) | TCGA-AA-3870-01 | Colorectum | colon adenocarcinoma | Female | >=65 | III/IV | Chemotherapy | folinic | CR | |
| ABHD16A | SNV | Missense_Mutation | c.431N>T | p.Arg144Met | p.R144M | O95870 | protein_coding | tolerated(0.08) | benign(0.275) | TCGA-AD-6889-01 | Colorectum | colon adenocarcinoma | Male | >=65 | I/II | Chemotherapy | xeloda | PD | |
| ABHD16A | SNV | Missense_Mutation | c.779N>A | p.Gly260Asp | p.G260D | O95870 | protein_coding | deleterious(0.01) | probably_damaging(0.998) | TCGA-AD-6964-01 | Colorectum | colon adenocarcinoma | Male | <65 | III/IV | Chemotherapy | folfox | PD | |
| ABHD16A | SNV | Missense_Mutation | rs758057318 | c.1543G>A | p.Val515Met | p.V515M | O95870 | protein_coding | deleterious(0) | probably_damaging(0.993) | TCGA-AZ-6601-01 | Colorectum | colon adenocarcinoma | Male | >=65 | I/II | Unknown | Unknown | PD |
| ABHD16A | SNV | Missense_Mutation | rs780015445 | c.653G>A | p.Arg218His | p.R218H | O95870 | protein_coding | deleterious(0) | probably_damaging(0.99) | TCGA-AZ-6601-01 | Colorectum | colon adenocarcinoma | Male | >=65 | I/II | Unknown | Unknown | PD |
| ABHD16A | SNV | Missense_Mutation | c.350N>A | p.Gly117Asp | p.G117D | O95870 | protein_coding | tolerated(0.06) | possibly_damaging(0.789) | TCGA-AP-A056-01 | Endometrium | uterine corpus endometrioid carcinoma | Female | <65 | I/II | Unknown | Unknown | SD |
| Page: 1 2 3 4 |
Top |
Related drugs of malignant transformation related genes |
| Identification of chemicals and drugs interact with genes involved in malignant transfromation |
| (DGIdb 4.0) |
| Entrez ID | Symbol | Category | Interaction Types | Drug Claim Name | Drug Name | PMIDs |
| Page: 1 |

Copyright 2023-Present -The University of Texas Health Science Center at Houston |