
|
|||||
|
 | |
| |
| |
| |
| |
| |
|
Gene: ABHD14B |
Gene summary for ABHD14B |
| Gene information | Species | Human | Gene symbol | ABHD14B | Gene ID | 84836 |
| Gene name | abhydrolase domain containing 14B | |
| Gene Alias | CIB | |
| Cytomap | 3p21.2 | |
| Gene Type | protein-coding | GO ID | GO:0006082 | UniProtAcc | Q96IU4 |
Top |
Malignant transformation analysis |
| Identification of the aberrant gene expression in precancerous and cancerous lesions by comparing the gene expression of stem-like cells in diseased tissues with normal stem cells |
| Entrez ID | Symbol | Replicates | Species | Organ | Tissue | Adj P-value | Log2FC | Malignancy |
| 84836 | ABHD14B | HTA11_3410_2000001011 | Human | Colorectum | AD | 1.84e-22 | 3.94e-01 | 0.0155 |
| 84836 | ABHD14B | HTA11_2487_2000001011 | Human | Colorectum | SER | 1.32e-31 | 7.10e-01 | -0.1808 |
| 84836 | ABHD14B | HTA11_2951_2000001011 | Human | Colorectum | AD | 3.22e-05 | 3.63e-01 | 0.0216 |
| 84836 | ABHD14B | HTA11_1938_2000001011 | Human | Colorectum | AD | 8.28e-25 | 6.91e-01 | -0.0811 |
| 84836 | ABHD14B | HTA11_78_2000001011 | Human | Colorectum | AD | 2.19e-30 | 6.73e-01 | -0.1088 |
| 84836 | ABHD14B | HTA11_347_2000001011 | Human | Colorectum | AD | 1.60e-53 | 8.74e-01 | -0.1954 |
| 84836 | ABHD14B | HTA11_411_2000001011 | Human | Colorectum | SER | 6.89e-14 | 8.01e-01 | -0.2602 |
| 84836 | ABHD14B | HTA11_2112_2000001011 | Human | Colorectum | SER | 2.75e-12 | 5.85e-01 | -0.2196 |
| 84836 | ABHD14B | HTA11_3361_2000001011 | Human | Colorectum | AD | 8.49e-18 | 5.64e-01 | -0.1207 |
| 84836 | ABHD14B | HTA11_83_2000001011 | Human | Colorectum | SER | 2.68e-22 | 6.86e-01 | -0.1526 |
| 84836 | ABHD14B | HTA11_696_2000001011 | Human | Colorectum | AD | 2.49e-45 | 7.63e-01 | -0.1464 |
| 84836 | ABHD14B | HTA11_866_2000001011 | Human | Colorectum | AD | 1.29e-28 | 5.40e-01 | -0.1001 |
| 84836 | ABHD14B | HTA11_1391_2000001011 | Human | Colorectum | AD | 1.60e-36 | 8.41e-01 | -0.059 |
| 84836 | ABHD14B | HTA11_2992_2000001011 | Human | Colorectum | SER | 2.50e-12 | 6.60e-01 | -0.1706 |
| 84836 | ABHD14B | HTA11_5212_2000001011 | Human | Colorectum | AD | 2.59e-17 | 5.85e-01 | -0.2061 |
| 84836 | ABHD14B | HTA11_5216_2000001011 | Human | Colorectum | SER | 1.51e-11 | 5.85e-01 | -0.1462 |
| 84836 | ABHD14B | HTA11_546_2000001011 | Human | Colorectum | AD | 3.21e-19 | 6.37e-01 | -0.0842 |
| 84836 | ABHD14B | HTA11_9341_2000001011 | Human | Colorectum | SER | 7.44e-09 | 5.69e-01 | -0.00410000000000005 |
| 84836 | ABHD14B | HTA11_7862_2000001011 | Human | Colorectum | AD | 5.05e-17 | 5.56e-01 | -0.0179 |
| 84836 | ABHD14B | HTA11_866_3004761011 | Human | Colorectum | AD | 1.19e-25 | 5.63e-01 | 0.096 |
| Page: 1 2 3 4 5 6 7 8 |
| Tissue | Expression Dynamics | Abbreviation |
| Colorectum (GSE201348) |  | FAP: Familial adenomatous polyposis |
| CRC: Colorectal cancer | ||
| Colorectum (HTA11) |  | AD: Adenomas |
| SER: Sessile serrated lesions | ||
| MSI-H: Microsatellite-high colorectal cancer | ||
| MSS: Microsatellite stable colorectal cancer | ||
| Esophagus | 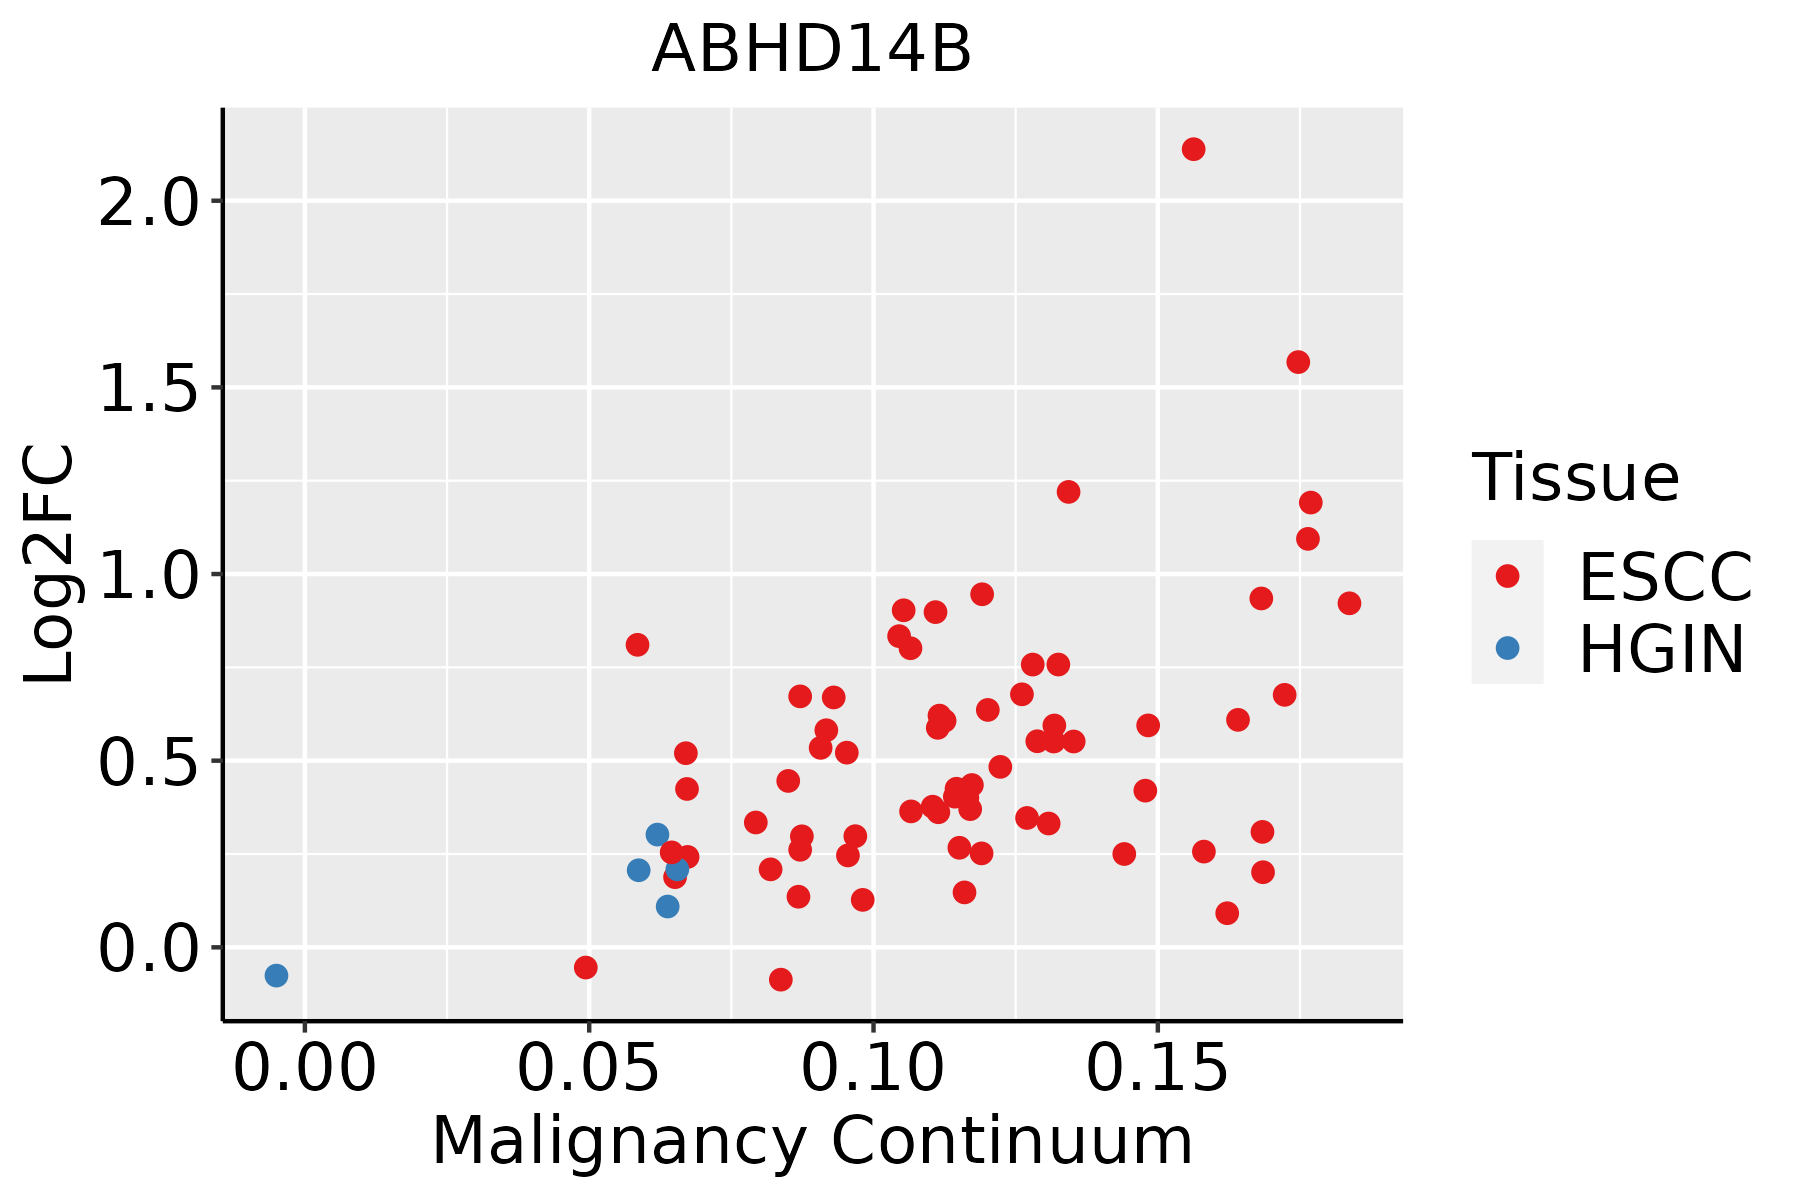 | ESCC: Esophageal squamous cell carcinoma |
| HGIN: High-grade intraepithelial neoplasias | ||
| LGIN: Low-grade intraepithelial neoplasias | ||
| Liver | 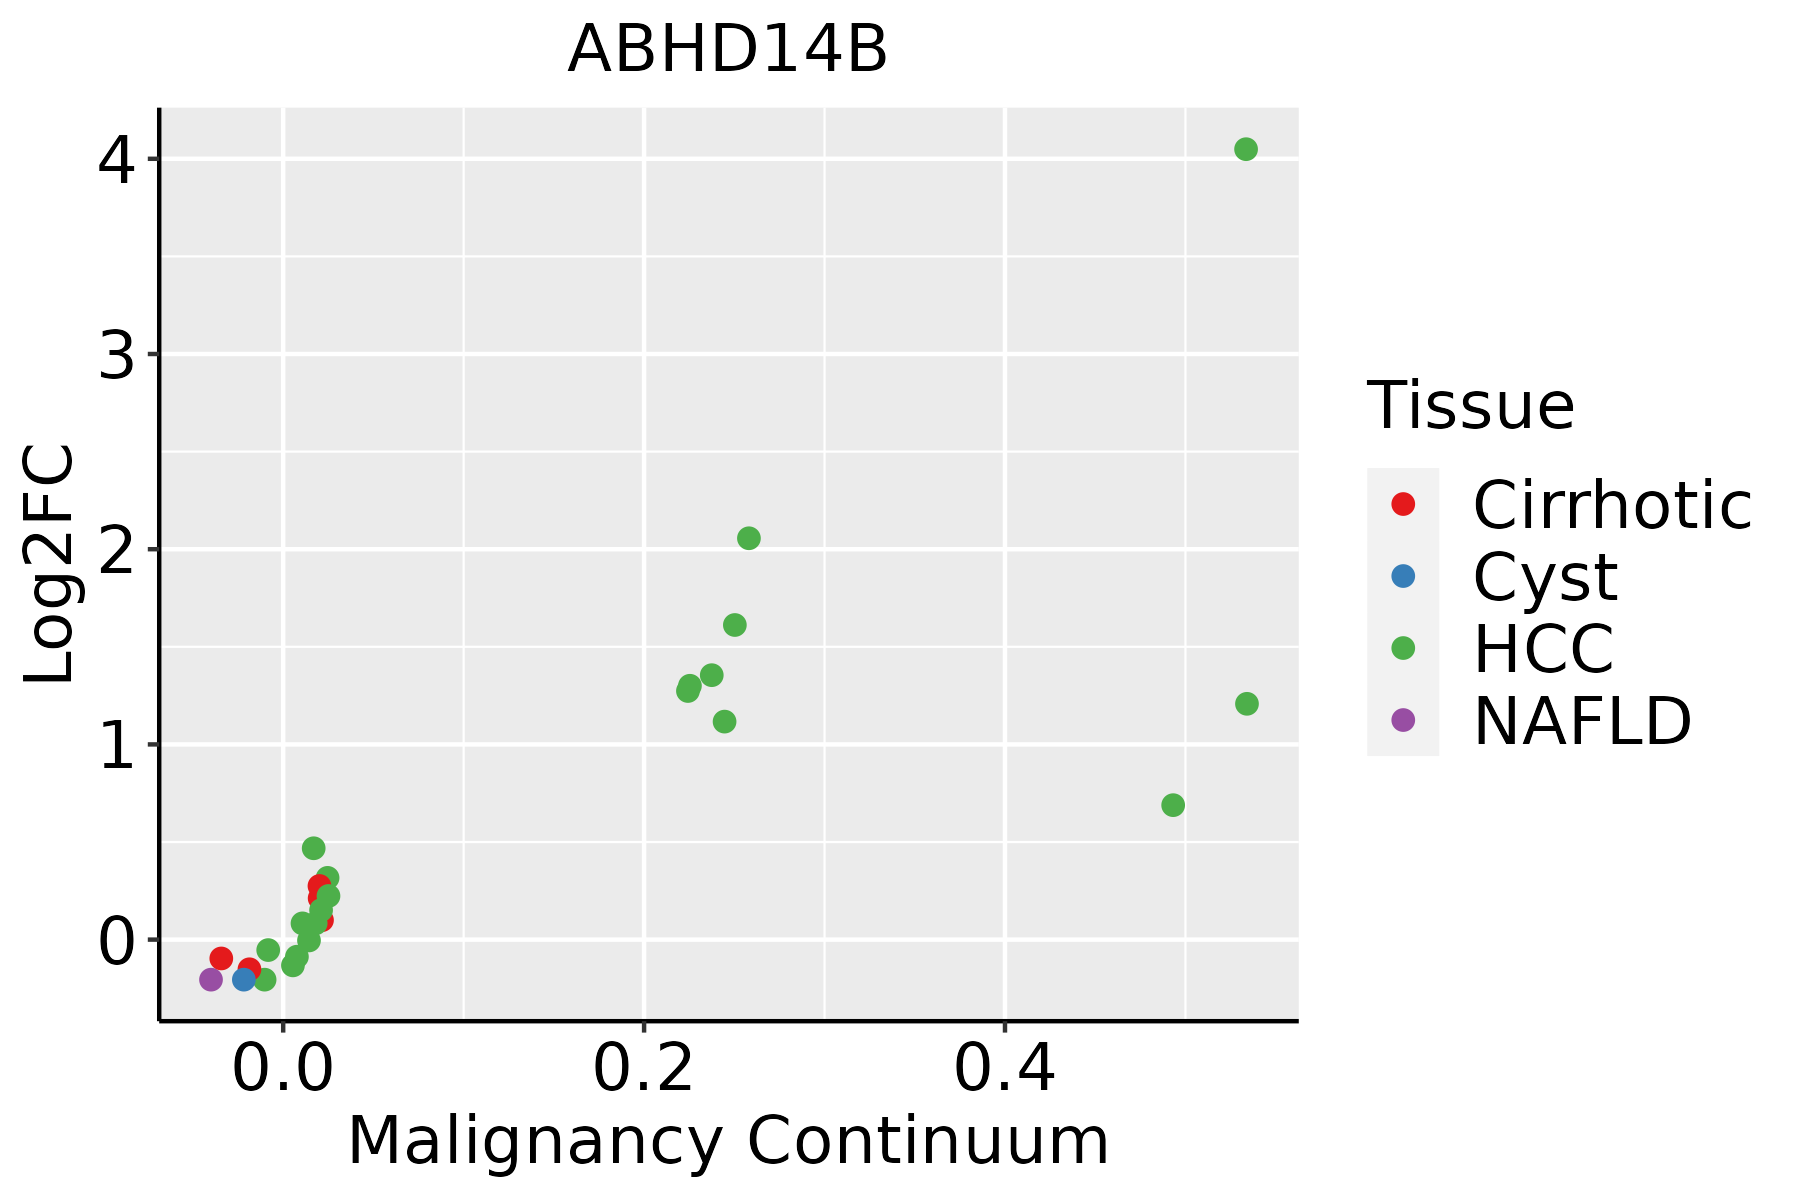 | HCC: Hepatocellular carcinoma |
| NAFLD: Non-alcoholic fatty liver disease | ||
| Oral Cavity |  | EOLP: Erosive Oral lichen planus |
| LP: leukoplakia | ||
| NEOLP: Non-erosive oral lichen planus | ||
| OSCC: Oral squamous cell carcinoma | ||
| Thyroid | 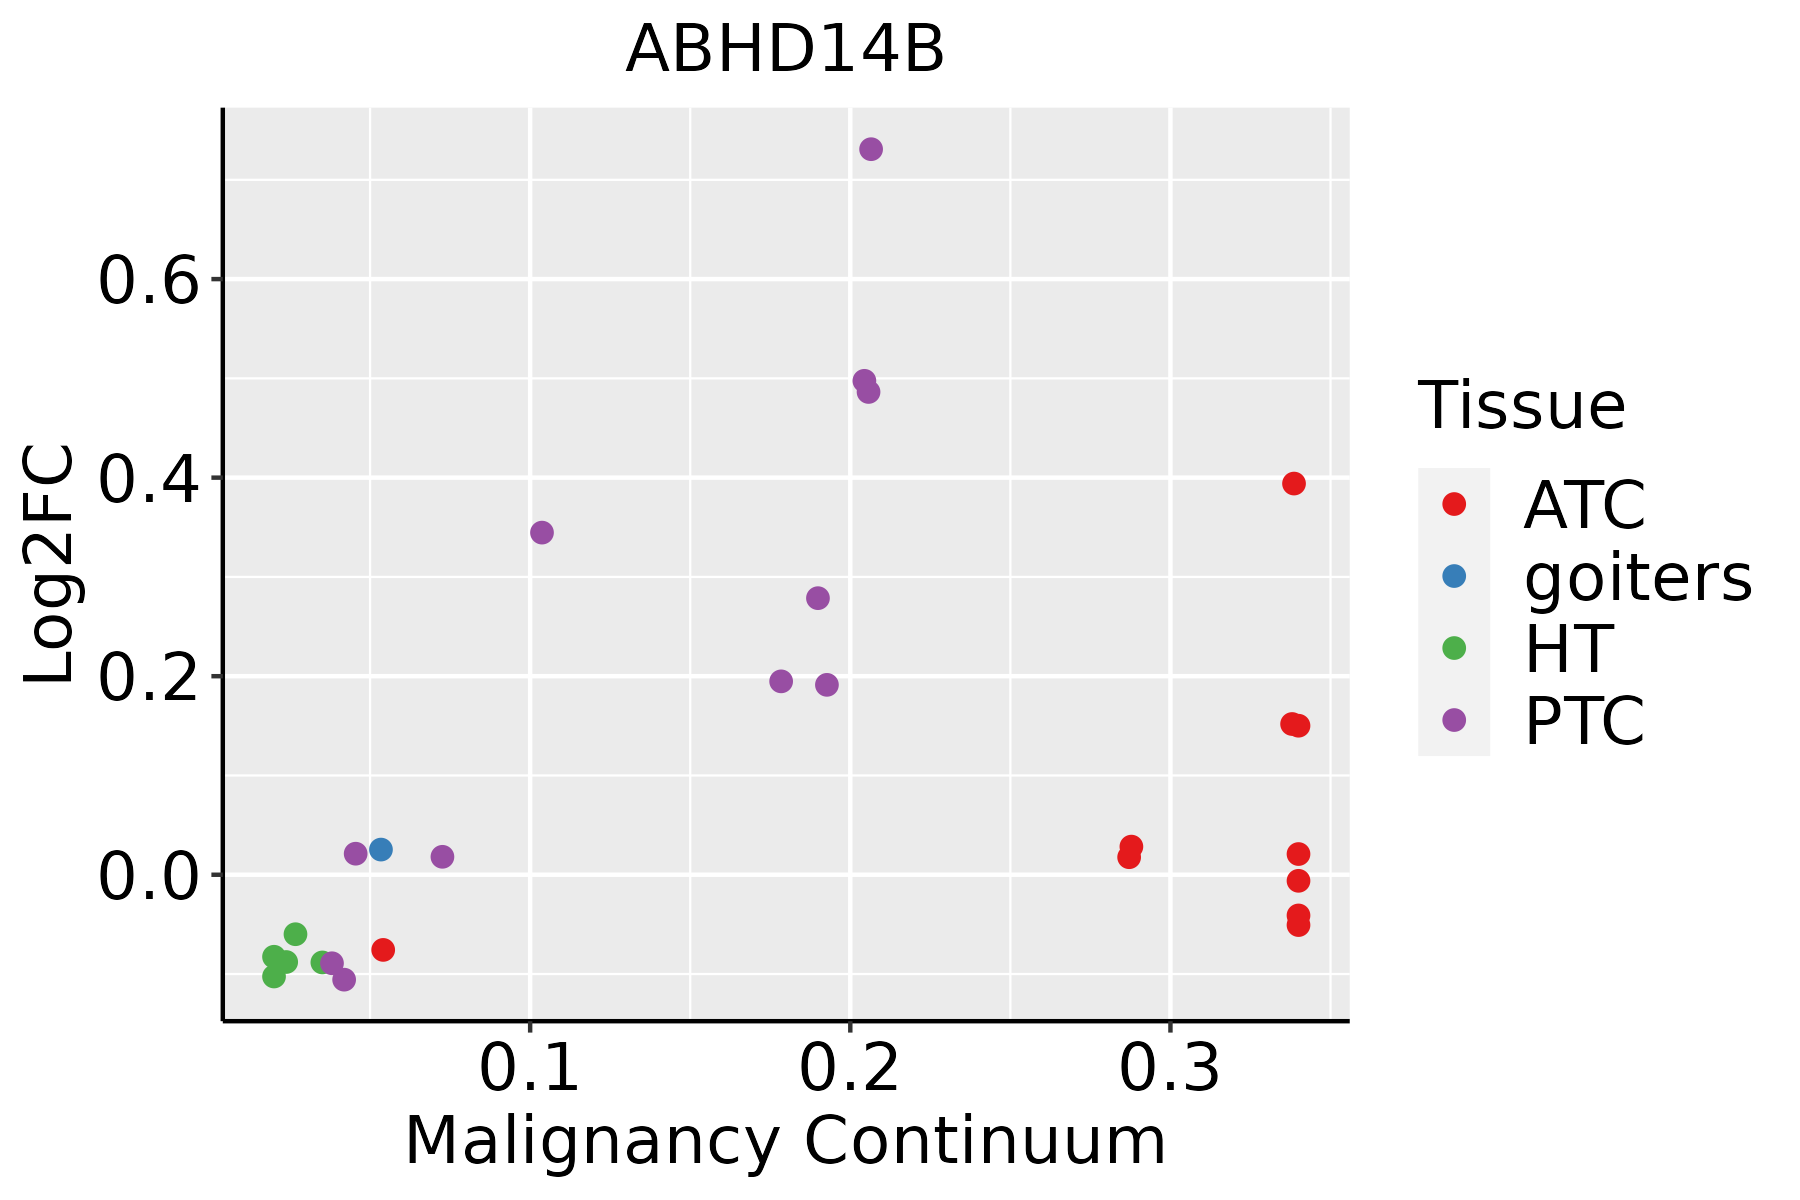 | ATC: Anaplastic thyroid cancer |
| HT: Hashimoto's thyroiditis | ||
| PTC: Papillary thyroid cancer |
| ∗log2FC in expression of this searched gene in stem-like cells from each diseased tissue sample relative to stem-like cells in normal samples in each tissue plotted against the malignancy continuum. Samples are colored based on if they are from different disease stage. |
Top |
Malignant transformation related pathway analysis |
| Find out the enriched GO biological processes and KEGG pathways involved in transition from healthy to precancer to cancer |
| Tissue | Disease Stage | Enriched GO biological Processes |
| Colorectum | AD |  |
| Colorectum | SER |  |
| Colorectum | MSS |  |
| Colorectum | MSI-H |  |
| Colorectum | FAP |  |
| ∗Top 15 enriched GO BP terms are showed in the bar plot of each disease state in each tissue. Each row represents a significant GO biological process which is colored according to the -log10(p.adjust). |
| Page: 1 2 3 4 5 6 7 8 9 |
| GO ID | Tissue | Disease Stage | Description | Gene Ratio | Bg Ratio | pvalue | p.adjust | Count |
| GO:0009150 | Colorectum | AD | purine ribonucleotide metabolic process | 142/3918 | 368/18723 | 4.29e-15 | 1.17e-12 | 142 |
| GO:0006163 | Colorectum | AD | purine nucleotide metabolic process | 149/3918 | 396/18723 | 1.08e-14 | 2.80e-12 | 149 |
| GO:0072521 | Colorectum | AD | purine-containing compound metabolic process | 153/3918 | 416/18723 | 4.34e-14 | 1.01e-11 | 153 |
| GO:0009259 | Colorectum | AD | ribonucleotide metabolic process | 144/3918 | 385/18723 | 5.25e-14 | 1.13e-11 | 144 |
| GO:0019693 | Colorectum | AD | ribose phosphate metabolic process | 145/3918 | 396/18723 | 3.01e-13 | 5.71e-11 | 145 |
| GO:0009117 | Colorectum | AD | nucleotide metabolic process | 168/3918 | 489/18723 | 2.20e-12 | 3.36e-10 | 168 |
| GO:0006753 | Colorectum | AD | nucleoside phosphate metabolic process | 169/3918 | 497/18723 | 4.99e-12 | 6.98e-10 | 169 |
| GO:0006790 | Colorectum | AD | sulfur compound metabolic process | 101/3918 | 339/18723 | 6.46e-05 | 1.07e-03 | 101 |
| GO:0033865 | Colorectum | AD | nucleoside bisphosphate metabolic process | 42/3918 | 128/18723 | 1.12e-03 | 1.02e-02 | 42 |
| GO:0033875 | Colorectum | AD | ribonucleoside bisphosphate metabolic process | 42/3918 | 128/18723 | 1.12e-03 | 1.02e-02 | 42 |
| GO:0034032 | Colorectum | AD | purine nucleoside bisphosphate metabolic process | 42/3918 | 128/18723 | 1.12e-03 | 1.02e-02 | 42 |
| GO:0034035 | Colorectum | AD | purine ribonucleoside bisphosphate metabolic process | 11/3918 | 21/18723 | 1.43e-03 | 1.22e-02 | 11 |
| GO:0050427 | Colorectum | AD | 3'-phosphoadenosine 5'-phosphosulfate metabolic process | 11/3918 | 21/18723 | 1.43e-03 | 1.22e-02 | 11 |
| GO:00061631 | Colorectum | SER | purine nucleotide metabolic process | 109/2897 | 396/18723 | 4.26e-10 | 5.44e-08 | 109 |
| GO:00091501 | Colorectum | SER | purine ribonucleotide metabolic process | 103/2897 | 368/18723 | 4.69e-10 | 5.68e-08 | 103 |
| GO:00725211 | Colorectum | SER | purine-containing compound metabolic process | 113/2897 | 416/18723 | 4.80e-10 | 5.68e-08 | 113 |
| GO:00092591 | Colorectum | SER | ribonucleotide metabolic process | 104/2897 | 385/18723 | 3.27e-09 | 3.04e-07 | 104 |
| GO:00196931 | Colorectum | SER | ribose phosphate metabolic process | 105/2897 | 396/18723 | 8.15e-09 | 7.14e-07 | 105 |
| GO:00091171 | Colorectum | SER | nucleotide metabolic process | 122/2897 | 489/18723 | 2.50e-08 | 1.76e-06 | 122 |
| GO:00067531 | Colorectum | SER | nucleoside phosphate metabolic process | 122/2897 | 497/18723 | 6.64e-08 | 4.33e-06 | 122 |
| Page: 1 2 3 4 5 6 |
| Pathway ID | Tissue | Disease Stage | Description | Gene Ratio | Bg Ratio | pvalue | p.adjust | qvalue | Count |
| Page: 1 |
Top |
Cell-cell communication analysis |
| Identification of potential cell-cell interactions between two cell types and their ligand-receptor pairs for different disease states |
| Ligand | Receptor | LRpair | Pathway | Tissue | Disease Stage |
| Page: 1 |
Top |
Single-cell gene regulatory network inference analysis |
| Find out the significant the regulons (TFs) and the target genes of each regulon across cell types for different disease states |
| TF | Cell Type | Tissue | Disease Stage | Target Gene | RSS | Regulon Activity |
| ∗The dot plots of a searched regulon are shown for all cell subpopulations in each disease state of each tissue based on the regulon specific score inferred using pySCENIC and by calculating the average expression. |
| Page: 1 |
Top |
Somatic mutation of malignant transformation related genes |
| Annotation of somatic variants for genes involved in malignant transformation |
| Hugo Symbol | Variant Class | Variant Classification | dbSNP RS | HGVSc | HGVSp | HGVSp Short | SWISSPROT | BIOTYPE | SIFT | PolyPhen | Tumor Sample Barcode | Tissue | Histology | Sex | Age | Stage | Therapy Types | Drugs | Outcome |
| ABHD14B | SNV | Missense_Mutation | novel | c.518N>G | p.Lys173Arg | p.K173R | Q96IU4 | protein_coding | tolerated(0.99) | benign(0.056) | TCGA-A5-A1OF-01 | Endometrium | uterine corpus endometrioid carcinoma | Female | <65 | I/II | Unknown | Unknown | SD |
| ABHD14B | SNV | Missense_Mutation | rs575308151 | c.65G>A | p.Arg22Gln | p.R22Q | Q96IU4 | protein_coding | deleterious(0) | probably_damaging(0.953) | TCGA-AP-A1DK-01 | Endometrium | uterine corpus endometrioid carcinoma | Female | <65 | I/II | Unknown | Unknown | SD |
| ABHD14B | SNV | Missense_Mutation | rs751636953 | c.403N>A | p.Ala135Thr | p.A135T | Q96IU4 | protein_coding | deleterious(0) | probably_damaging(1) | TCGA-B5-A3FA-01 | Endometrium | uterine corpus endometrioid carcinoma | Female | >=65 | I/II | Unknown | Unknown | SD |
| ABHD14B | SNV | Missense_Mutation | rs199563943 | c.241N>T | p.Pro81Ser | p.P81S | Q96IU4 | protein_coding | tolerated(0.13) | benign(0.003) | TCGA-D1-A1O7-01 | Endometrium | uterine corpus endometrioid carcinoma | Female | <65 | I/II | Unknown | Unknown | SD |
| ABHD14B | SNV | Missense_Mutation | c.125G>A | p.Arg42His | p.R42H | Q96IU4 | protein_coding | tolerated(0.08) | benign(0.03) | TCGA-E6-A1LX-01 | Endometrium | uterine corpus endometrioid carcinoma | Female | <65 | I/II | Unknown | Unknown | SD | |
| ABHD14B | SNV | Missense_Mutation | novel | c.80N>A | p.Gly27Asp | p.G27D | Q96IU4 | protein_coding | tolerated(0.63) | benign(0.075) | TCGA-EY-A1GI-01 | Endometrium | uterine corpus endometrioid carcinoma | Female | <65 | I/II | Unknown | Unknown | SD |
| ABHD14B | SNV | Missense_Mutation | c.622N>A | p.Gly208Arg | p.G208R | Q96IU4 | protein_coding | tolerated(0.49) | benign(0.055) | TCGA-BC-A10R-01 | Liver | liver hepatocellular carcinoma | Female | >=65 | III/IV | Other, specify in noteschemoembolization | unknown | PD | |
| ABHD14B | SNV | Missense_Mutation | c.328N>T | p.Pro110Ser | p.P110S | Q96IU4 | protein_coding | deleterious(0.04) | probably_damaging(1) | TCGA-78-7150-01 | Lung | lung adenocarcinoma | Male | <65 | I/II | Chemotherapy | carboplatin | PD | |
| ABHD14B | SNV | Missense_Mutation | novel | c.63N>G | p.Phe21Leu | p.F21L | Q96IU4 | protein_coding | deleterious(0.01) | benign(0.007) | TCGA-85-A53L-01 | Lung | lung squamous cell carcinoma | Male | <65 | I/II | Unknown | Unknown | SD |
| Page: 1 |
Top |
Related drugs of malignant transformation related genes |
| Identification of chemicals and drugs interact with genes involved in malignant transfromation |
| (DGIdb 4.0) |
| Entrez ID | Symbol | Category | Interaction Types | Drug Claim Name | Drug Name | PMIDs |
| Page: 1 |

Copyright 2023-Present -The University of Texas Health Science Center at Houston |