
|
|||||
|
 | |
| |
| |
| |
| |
| |
|
Gene: ABHD14A |
Gene summary for ABHD14A |
| Gene information | Species | Human | Gene symbol | ABHD14A | Gene ID | 25864 |
| Gene name | abhydrolase domain containing 14A | |
| Gene Alias | DORZ1 | |
| Cytomap | 3p21.2 | |
| Gene Type | protein-coding | GO ID | GO:0005575 | UniProtAcc | Q9BUJ0 |
Top |
Malignant transformation analysis |
| Identification of the aberrant gene expression in precancerous and cancerous lesions by comparing the gene expression of stem-like cells in diseased tissues with normal stem cells |
| Entrez ID | Symbol | Replicates | Species | Organ | Tissue | Adj P-value | Log2FC | Malignancy |
| 25864 | ABHD14A | C04 | Human | Oral cavity | OSCC | 7.30e-11 | 7.29e-01 | 0.2633 |
| 25864 | ABHD14A | C30 | Human | Oral cavity | OSCC | 5.09e-22 | 1.11e+00 | 0.3055 |
| 25864 | ABHD14A | C43 | Human | Oral cavity | OSCC | 1.96e-06 | 1.93e-01 | 0.1704 |
| 25864 | ABHD14A | C46 | Human | Oral cavity | OSCC | 2.49e-02 | 1.85e-01 | 0.1673 |
| 25864 | ABHD14A | C08 | Human | Oral cavity | OSCC | 1.55e-23 | 4.90e-01 | 0.1919 |
| 25864 | ABHD14A | C09 | Human | Oral cavity | OSCC | 6.53e-09 | 4.17e-01 | 0.1431 |
| 25864 | ABHD14A | LN22 | Human | Oral cavity | OSCC | 2.34e-02 | 7.32e-01 | 0.1733 |
| 25864 | ABHD14A | LN46 | Human | Oral cavity | OSCC | 1.62e-03 | 2.75e-01 | 0.1666 |
| 25864 | ABHD14A | LP15 | Human | Oral cavity | LP | 4.83e-02 | 7.80e-01 | 0.2174 |
| 25864 | ABHD14A | SYSMH2 | Human | Oral cavity | OSCC | 2.79e-07 | 2.18e-01 | 0.2326 |
| 25864 | ABHD14A | SYSMH3 | Human | Oral cavity | OSCC | 1.25e-18 | 4.70e-01 | 0.2442 |
| 25864 | ABHD14A | SYSMH6 | Human | Oral cavity | OSCC | 7.71e-13 | 3.17e-01 | 0.1275 |
| 25864 | ABHD14A | male-WTA | Human | Thyroid | PTC | 4.26e-44 | 2.26e-01 | 0.1037 |
| 25864 | ABHD14A | PTC01 | Human | Thyroid | PTC | 1.30e-26 | 7.32e-01 | 0.1899 |
| 25864 | ABHD14A | PTC04 | Human | Thyroid | PTC | 1.29e-09 | 4.93e-01 | 0.1927 |
| 25864 | ABHD14A | PTC05 | Human | Thyroid | PTC | 7.89e-21 | 9.44e-01 | 0.2065 |
| 25864 | ABHD14A | PTC06 | Human | Thyroid | PTC | 7.18e-36 | 8.98e-01 | 0.2057 |
| 25864 | ABHD14A | PTC07 | Human | Thyroid | PTC | 7.32e-71 | 1.28e+00 | 0.2044 |
| 25864 | ABHD14A | ATC09 | Human | Thyroid | ATC | 1.71e-03 | 4.67e-02 | 0.2871 |
| 25864 | ABHD14A | ATC12 | Human | Thyroid | ATC | 3.36e-08 | 3.19e-02 | 0.34 |
| Page: 1 2 |
| Tissue | Expression Dynamics | Abbreviation |
| Oral Cavity |  | EOLP: Erosive Oral lichen planus |
| LP: leukoplakia | ||
| NEOLP: Non-erosive oral lichen planus | ||
| OSCC: Oral squamous cell carcinoma | ||
| Thyroid | 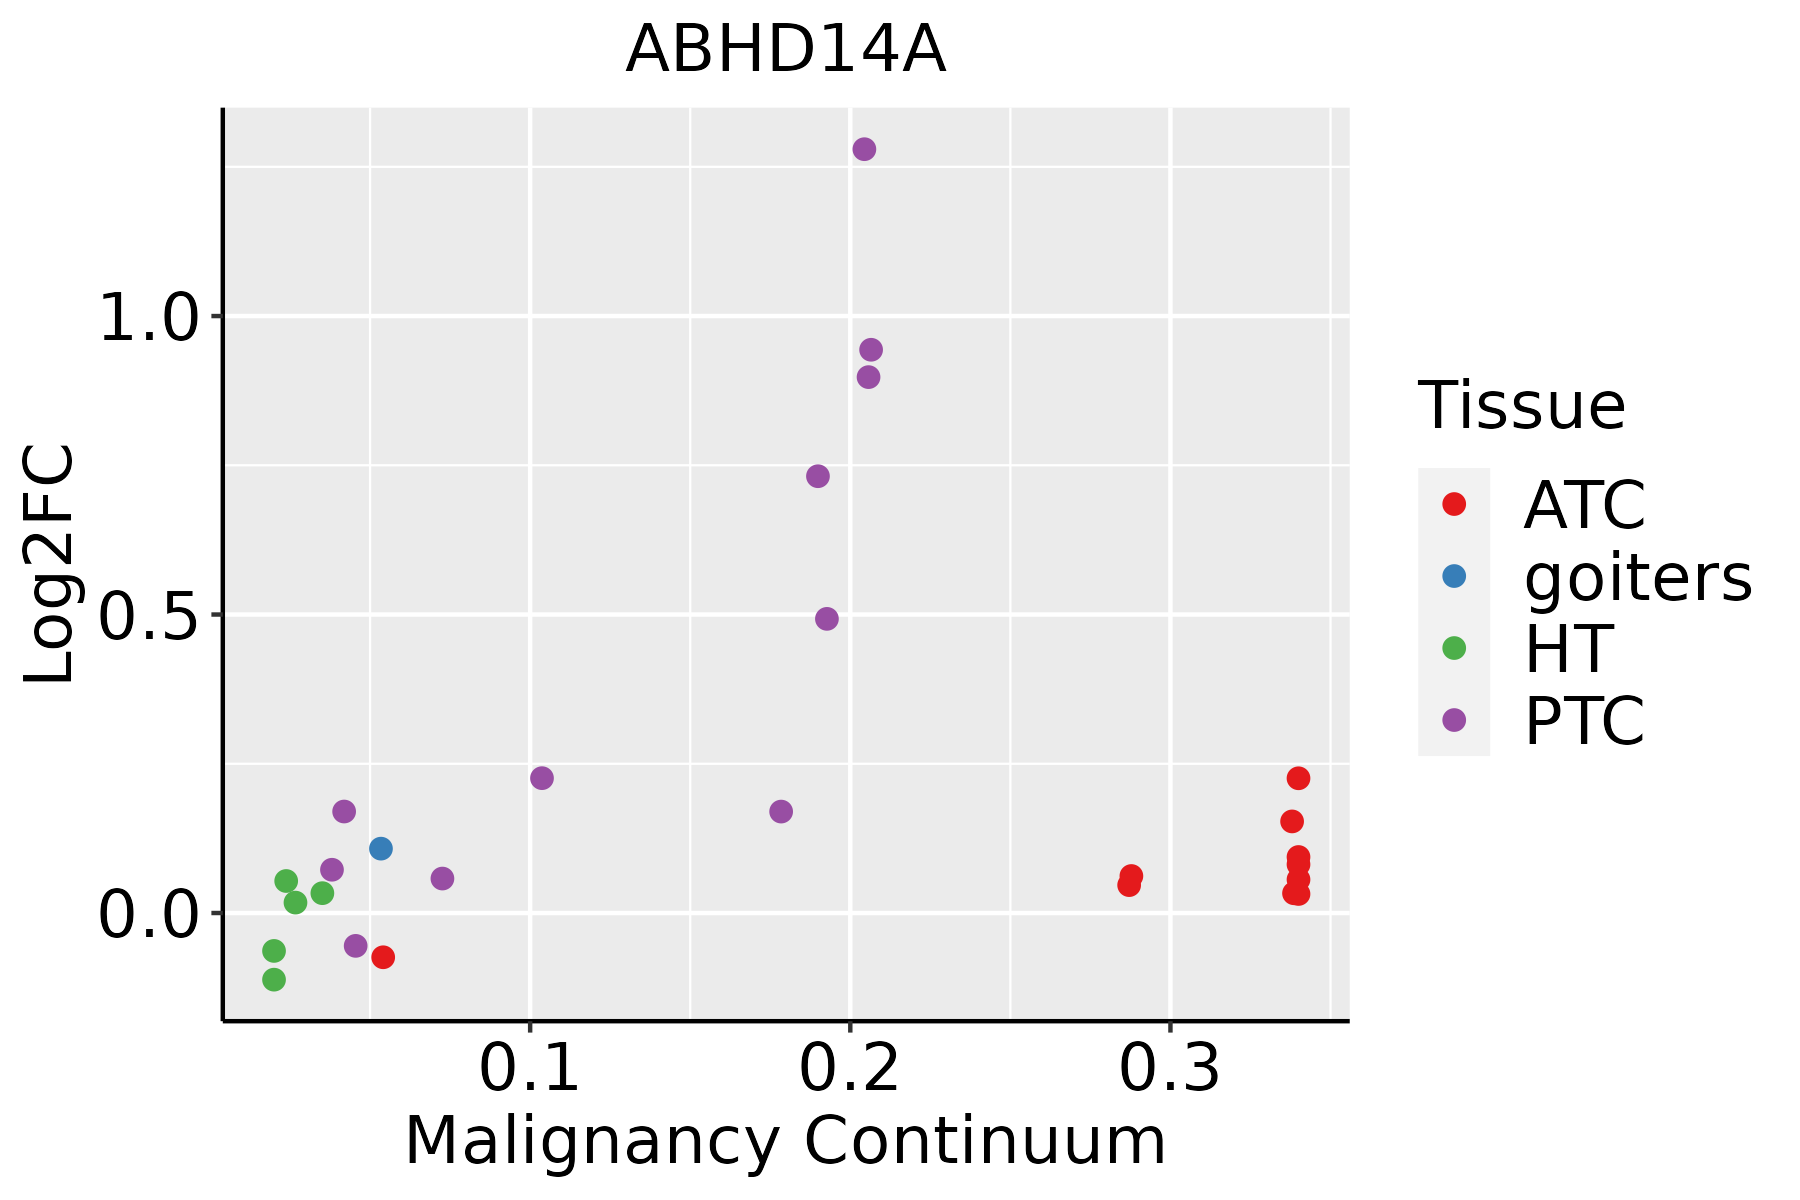 | ATC: Anaplastic thyroid cancer |
| HT: Hashimoto's thyroiditis | ||
| PTC: Papillary thyroid cancer |
| ∗log2FC in expression of this searched gene in stem-like cells from each diseased tissue sample relative to stem-like cells in normal samples in each tissue plotted against the malignancy continuum. Samples are colored based on if they are from different disease stage. |
Top |
Malignant transformation related pathway analysis |
| Find out the enriched GO biological processes and KEGG pathways involved in transition from healthy to precancer to cancer |
| Tissue | Disease Stage | Enriched GO biological Processes |
| Colorectum | AD |  |
| Colorectum | SER |  |
| Colorectum | MSS |  |
| Colorectum | MSI-H |  |
| Colorectum | FAP |  |
| ∗Top 15 enriched GO BP terms are showed in the bar plot of each disease state in each tissue. Each row represents a significant GO biological process which is colored according to the -log10(p.adjust). |
| Page: 1 2 3 4 5 6 7 8 9 |
| GO ID | Tissue | Disease Stage | Description | Gene Ratio | Bg Ratio | pvalue | p.adjust | Count |
| Page: 1 |
| Pathway ID | Tissue | Disease Stage | Description | Gene Ratio | Bg Ratio | pvalue | p.adjust | qvalue | Count |
| Page: 1 |
Top |
Cell-cell communication analysis |
| Identification of potential cell-cell interactions between two cell types and their ligand-receptor pairs for different disease states |
| Ligand | Receptor | LRpair | Pathway | Tissue | Disease Stage |
| Page: 1 |
Top |
Single-cell gene regulatory network inference analysis |
| Find out the significant the regulons (TFs) and the target genes of each regulon across cell types for different disease states |
| TF | Cell Type | Tissue | Disease Stage | Target Gene | RSS | Regulon Activity |
| ∗The dot plots of a searched regulon are shown for all cell subpopulations in each disease state of each tissue based on the regulon specific score inferred using pySCENIC and by calculating the average expression. |
| Page: 1 |
Top |
Somatic mutation of malignant transformation related genes |
| Annotation of somatic variants for genes involved in malignant transformation |
| Hugo Symbol | Variant Class | Variant Classification | dbSNP RS | HGVSc | HGVSp | HGVSp Short | SWISSPROT | BIOTYPE | SIFT | PolyPhen | Tumor Sample Barcode | Tissue | Histology | Sex | Age | Stage | Therapy Types | Drugs | Outcome |
| ABHD14A | SNV | Missense_Mutation | rs751690320 | c.250N>T | p.Arg84Cys | p.R84C | Q9BUJ0 | protein_coding | deleterious(0) | probably_damaging(0.991) | TCGA-D8-A1J8-01 | Breast | breast invasive carcinoma | Female | >=65 | I/II | Hormone Therapy | nolvadex | SD |
| ABHD14A | SNV | Missense_Mutation | novel | c.81N>C | p.Gln27His | p.Q27H | Q9BUJ0 | protein_coding | deleterious_low_confidence(0) | possibly_damaging(0.533) | TCGA-PE-A5DE-01 | Breast | breast invasive carcinoma | Female | <65 | I/II | Chemotherapy | taxotere | CR |
| ABHD14A | SNV | Missense_Mutation | novel | c.557A>G | p.His186Arg | p.H186R | Q9BUJ0 | protein_coding | tolerated(0.38) | benign(0.119) | TCGA-5M-AAT6-01 | Colorectum | colon adenocarcinoma | Female | <65 | III/IV | Unknown | Unknown | PD |
| ABHD14A | SNV | Missense_Mutation | c.572N>G | p.Phe191Cys | p.F191C | Q9BUJ0 | protein_coding | deleterious(0) | probably_damaging(1) | TCGA-AP-A1DV-01 | Endometrium | uterine corpus endometrioid carcinoma | Female | <65 | I/II | Unknown | Unknown | SD | |
| ABHD14A | SNV | Missense_Mutation | c.572N>G | p.Phe191Cys | p.F191C | Q9BUJ0 | protein_coding | deleterious(0) | probably_damaging(1) | TCGA-B5-A11N-01 | Endometrium | uterine corpus endometrioid carcinoma | Female | >=65 | I/II | Unknown | Unknown | SD | |
| ABHD14A | SNV | Missense_Mutation | novel | c.214N>A | p.Ala72Thr | p.A72T | Q9BUJ0 | protein_coding | tolerated(0.47) | benign(0.003) | TCGA-B5-A3FA-01 | Endometrium | uterine corpus endometrioid carcinoma | Female | >=65 | I/II | Unknown | Unknown | SD |
| ABHD14A | SNV | Missense_Mutation | rs770851638 | c.467C>T | p.Ala156Val | p.A156V | Q9BUJ0 | protein_coding | tolerated(1) | benign(0) | TCGA-B5-A3FC-01 | Endometrium | uterine corpus endometrioid carcinoma | Female | <65 | I/II | Unknown | Unknown | SD |
| ABHD14A | SNV | Missense_Mutation | novel | c.577N>T | p.Pro193Ser | p.P193S | Q9BUJ0 | protein_coding | deleterious(0.04) | possibly_damaging(0.607) | TCGA-BG-A222-01 | Endometrium | uterine corpus endometrioid carcinoma | Female | <65 | I/II | Unknown | Unknown | SD |
| ABHD14A | SNV | Missense_Mutation | novel | c.544A>T | p.Met182Leu | p.M182L | Q9BUJ0 | protein_coding | tolerated(0.65) | benign(0) | TCGA-D1-A2G0-01 | Endometrium | uterine corpus endometrioid carcinoma | Female | >=65 | I/II | Unknown | Unknown | SD |
| ABHD14A | SNV | Missense_Mutation | novel | c.136N>T | p.Leu46Phe | p.L46F | Q9BUJ0 | protein_coding | tolerated_low_confidence(0.19) | benign(0.046) | TCGA-EO-A22R-01 | Endometrium | uterine corpus endometrioid carcinoma | Female | <65 | I/II | Unknown | Unknown | SD |
| Page: 1 2 3 |
Top |
Related drugs of malignant transformation related genes |
| Identification of chemicals and drugs interact with genes involved in malignant transfromation |
| (DGIdb 4.0) |
| Entrez ID | Symbol | Category | Interaction Types | Drug Claim Name | Drug Name | PMIDs |
| Page: 1 |

Copyright 2023-Present -The University of Texas Health Science Center at Houston |