
|
|||||
|
 | |
| |
| |
| |
| |
| |
|
Gene: ABHD12B |
Gene summary for ABHD12B |
| Gene information | Species | Human | Gene symbol | ABHD12B | Gene ID | 145447 |
| Gene name | abhydrolase domain containing 12B | |
| Gene Alias | BEM46L3 | |
| Cytomap | 14q22.1 | |
| Gene Type | protein-coding | GO ID | GO:0006575 | UniProtAcc | Q7Z5M8 |
Top |
Malignant transformation analysis |
| Identification of the aberrant gene expression in precancerous and cancerous lesions by comparing the gene expression of stem-like cells in diseased tissues with normal stem cells |
| Entrez ID | Symbol | Replicates | Species | Organ | Tissue | Adj P-value | Log2FC | Malignancy |
| 145447 | ABHD12B | S014 | Human | Liver | HCC | 1.19e-50 | 1.65e+00 | 0.2254 |
| 145447 | ABHD12B | S015 | Human | Liver | HCC | 3.28e-44 | 1.78e+00 | 0.2375 |
| 145447 | ABHD12B | S016 | Human | Liver | HCC | 1.55e-66 | 1.90e+00 | 0.2243 |
| Page: 1 |
| Tissue | Expression Dynamics | Abbreviation |
| Liver | 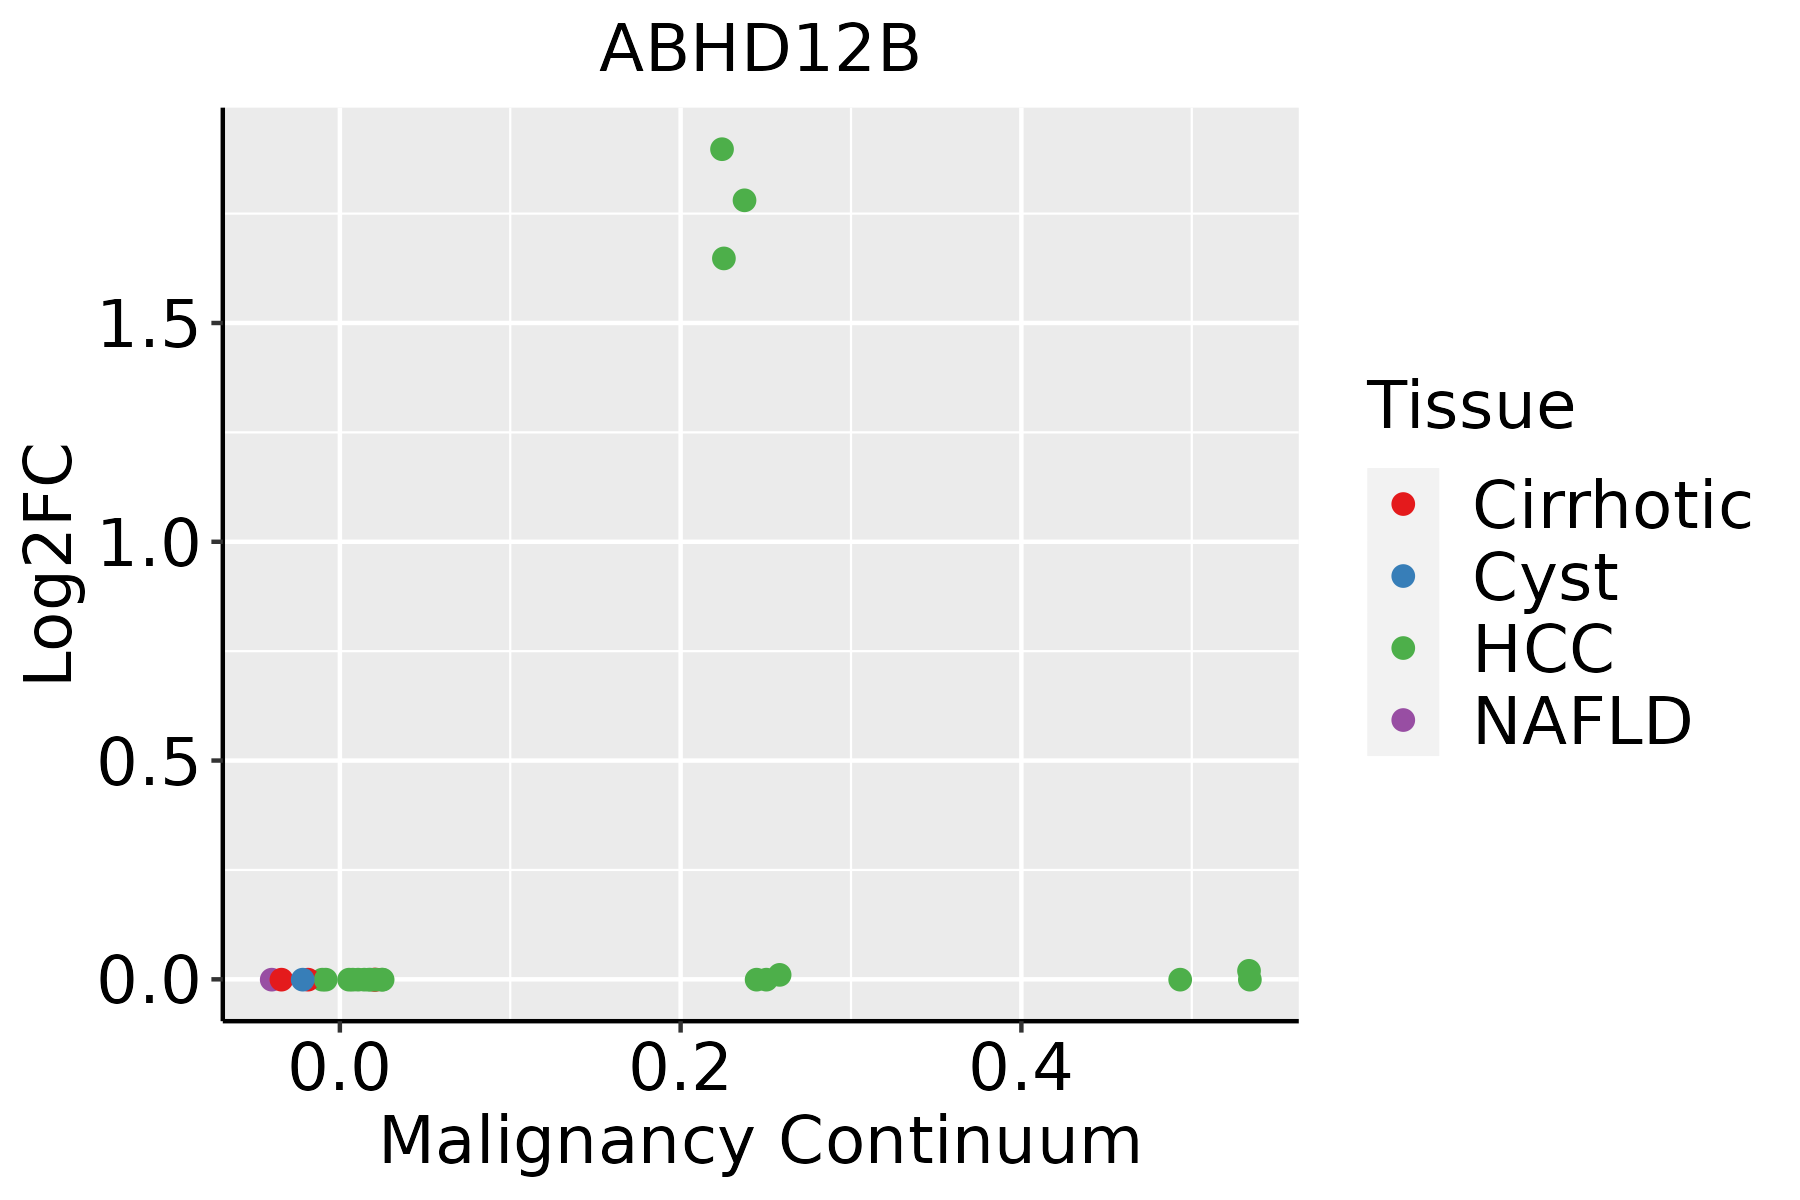 | HCC: Hepatocellular carcinoma |
| NAFLD: Non-alcoholic fatty liver disease |
| ∗log2FC in expression of this searched gene in stem-like cells from each diseased tissue sample relative to stem-like cells in normal samples in each tissue plotted against the malignancy continuum. Samples are colored based on if they are from different disease stage. |
Top |
Malignant transformation related pathway analysis |
| Find out the enriched GO biological processes and KEGG pathways involved in transition from healthy to precancer to cancer |
| Tissue | Disease Stage | Enriched GO biological Processes |
| Colorectum | AD |  |
| Colorectum | SER |  |
| Colorectum | MSS |  |
| Colorectum | MSI-H |  |
| Colorectum | FAP |  |
| ∗Top 15 enriched GO BP terms are showed in the bar plot of each disease state in each tissue. Each row represents a significant GO biological process which is colored according to the -log10(p.adjust). |
| Page: 1 2 3 4 5 6 7 8 9 |
| GO ID | Tissue | Disease Stage | Description | Gene Ratio | Bg Ratio | pvalue | p.adjust | Count |
| GO:004424222 | Liver | HCC | cellular lipid catabolic process | 134/7958 | 214/18723 | 2.07e-09 | 5.79e-08 | 134 |
| GO:000657521 | Liver | HCC | cellular modified amino acid metabolic process | 119/7958 | 188/18723 | 6.47e-09 | 1.67e-07 | 119 |
| GO:00066444 | Liver | HCC | phospholipid metabolic process | 214/7958 | 383/18723 | 7.25e-08 | 1.48e-06 | 214 |
| GO:004648611 | Liver | HCC | glycerolipid metabolic process | 215/7958 | 392/18723 | 4.54e-07 | 7.49e-06 | 215 |
| GO:001604221 | Liver | HCC | lipid catabolic process | 175/7958 | 320/18723 | 6.50e-06 | 7.88e-05 | 175 |
| GO:00066504 | Liver | HCC | glycerophospholipid metabolic process | 168/7958 | 306/18723 | 7.27e-06 | 8.62e-05 | 168 |
| GO:00464342 | Liver | HCC | organophosphate catabolic process | 89/7958 | 155/18723 | 1.24e-04 | 1.03e-03 | 89 |
| GO:0098732 | Liver | HCC | macromolecule deacylation | 67/7958 | 116/18723 | 6.46e-04 | 3.99e-03 | 67 |
| GO:000663911 | Liver | HCC | acylglycerol metabolic process | 72/7958 | 128/18723 | 1.16e-03 | 6.54e-03 | 72 |
| GO:000663811 | Liver | HCC | neutral lipid metabolic process | 72/7958 | 129/18723 | 1.54e-03 | 8.14e-03 | 72 |
| GO:0098734 | Liver | HCC | macromolecule depalmitoylation | 11/7958 | 14/18723 | 6.81e-03 | 2.73e-02 | 11 |
| Page: 1 |
| Pathway ID | Tissue | Disease Stage | Description | Gene Ratio | Bg Ratio | pvalue | p.adjust | qvalue | Count |
| Page: 1 |
Top |
Cell-cell communication analysis |
| Identification of potential cell-cell interactions between two cell types and their ligand-receptor pairs for different disease states |
| Ligand | Receptor | LRpair | Pathway | Tissue | Disease Stage |
| Page: 1 |
Top |
Single-cell gene regulatory network inference analysis |
| Find out the significant the regulons (TFs) and the target genes of each regulon across cell types for different disease states |
| TF | Cell Type | Tissue | Disease Stage | Target Gene | RSS | Regulon Activity |
| ∗The dot plots of a searched regulon are shown for all cell subpopulations in each disease state of each tissue based on the regulon specific score inferred using pySCENIC and by calculating the average expression. |
| Page: 1 |
Top |
Somatic mutation of malignant transformation related genes |
| Annotation of somatic variants for genes involved in malignant transformation |
| Hugo Symbol | Variant Class | Variant Classification | dbSNP RS | HGVSc | HGVSp | HGVSp Short | SWISSPROT | BIOTYPE | SIFT | PolyPhen | Tumor Sample Barcode | Tissue | Histology | Sex | Age | Stage | Therapy Types | Drugs | Outcome |
| ABHD12B | insertion | In_Frame_Ins | novel | c.431_432insCAG | p.Tyr144_Leu145insSer | p.Y144_L145insS | Q7Z5M8 | protein_coding | TCGA-AO-A0J9-01 | Breast | breast invasive carcinoma | Female | <65 | III/IV | Chemotherapy | cyclophosphamide | PD | ||
| ABHD12B | insertion | Nonsense_Mutation | novel | c.432_433insGACCTGTTTTCTATTTCATCTCCCTGAGTTCAAAC | p.Leu145AspfsTer9 | p.L145Dfs*9 | Q7Z5M8 | protein_coding | TCGA-AO-A0J9-01 | Breast | breast invasive carcinoma | Female | <65 | III/IV | Chemotherapy | cyclophosphamide | PD | ||
| ABHD12B | SNV | Missense_Mutation | rs528682615 | c.809G>A | p.Arg270His | p.R270H | Q7Z5M8 | protein_coding | tolerated(0.52) | benign(0.022) | TCGA-VS-A8EB-01 | Cervix | cervical & endocervical cancer | Female | <65 | III/IV | Unknown | Unknown | PD |
| ABHD12B | SNV | Missense_Mutation | rs746001641 | c.238N>A | p.Ala80Thr | p.A80T | Q7Z5M8 | protein_coding | tolerated(0.37) | benign(0.005) | TCGA-AA-3984-01 | Colorectum | colon adenocarcinoma | Female | <65 | I/II | Unknown | Unknown | SD |
| ABHD12B | SNV | Missense_Mutation | c.556C>T | p.Pro186Ser | p.P186S | Q7Z5M8 | protein_coding | deleterious(0) | possibly_damaging(0.528) | TCGA-AA-A022-01 | Colorectum | colon adenocarcinoma | Female | >=65 | I/II | Unknown | Unknown | SD | |
| ABHD12B | SNV | Missense_Mutation | c.511G>A | p.Val171Ile | p.V171I | Q7Z5M8 | protein_coding | tolerated(0.18) | possibly_damaging(0.806) | TCGA-AY-4070-01 | Colorectum | colon adenocarcinoma | Female | <65 | III/IV | Chemotherapy | 5-fu | PD | |
| ABHD12B | SNV | Missense_Mutation | novel | c.364G>A | p.Asp122Asn | p.D122N | Q7Z5M8 | protein_coding | tolerated(0.1) | benign(0.01) | TCGA-A5-A2K5-01 | Endometrium | uterine corpus endometrioid carcinoma | Female | >=65 | I/II | Unknown | Unknown | SD |
| ABHD12B | SNV | Missense_Mutation | rs200066805 | c.808N>T | p.Arg270Cys | p.R270C | Q7Z5M8 | protein_coding | tolerated(0.16) | possibly_damaging(0.849) | TCGA-AJ-A3OK-01 | Endometrium | uterine corpus endometrioid carcinoma | Female | >=65 | I/II | Chemotherapy | carboplatin | CR |
| ABHD12B | SNV | Missense_Mutation | rs777753471 | c.494G>A | p.Ser165Asn | p.S165N | Q7Z5M8 | protein_coding | deleterious(0) | benign(0.297) | TCGA-AP-A051-01 | Endometrium | uterine corpus endometrioid carcinoma | Female | >=65 | I/II | Unknown | Unknown | SD |
| ABHD12B | SNV | Missense_Mutation | rs769164034 | c.631N>A | p.Val211Met | p.V211M | Q7Z5M8 | protein_coding | deleterious(0) | probably_damaging(0.997) | TCGA-AP-A059-01 | Endometrium | uterine corpus endometrioid carcinoma | Female | >=65 | I/II | Unknown | Unknown | SD |
| Page: 1 2 3 |
Top |
Related drugs of malignant transformation related genes |
| Identification of chemicals and drugs interact with genes involved in malignant transfromation |
| (DGIdb 4.0) |
| Entrez ID | Symbol | Category | Interaction Types | Drug Claim Name | Drug Name | PMIDs |
| Page: 1 |

Copyright 2023-Present -The University of Texas Health Science Center at Houston |