
|
|||||
|
 | |
| |
| |
| |
| |
| |
|
Gene: ABHD12 |
Gene summary for ABHD12 |
| Gene information | Species | Human | Gene symbol | ABHD12 | Gene ID | 26090 |
| Gene name | abhydrolase domain containing 12, lysophospholipase | |
| Gene Alias | ABHD12A | |
| Cytomap | 20p11.21 | |
| Gene Type | protein-coding | GO ID | GO:0001676 | UniProtAcc | Q8N2K0 |
Top |
Malignant transformation analysis |
| Identification of the aberrant gene expression in precancerous and cancerous lesions by comparing the gene expression of stem-like cells in diseased tissues with normal stem cells |
| Entrez ID | Symbol | Replicates | Species | Organ | Tissue | Adj P-value | Log2FC | Malignancy |
| 26090 | ABHD12 | LZE20T | Human | Esophagus | ESCC | 4.74e-05 | 3.65e-01 | 0.0662 |
| 26090 | ABHD12 | LZE22D1 | Human | Esophagus | HGIN | 4.19e-05 | 1.66e-01 | 0.0595 |
| 26090 | ABHD12 | LZE22T | Human | Esophagus | ESCC | 2.14e-06 | 6.08e-01 | 0.068 |
| 26090 | ABHD12 | LZE24T | Human | Esophagus | ESCC | 1.26e-23 | 7.16e-01 | 0.0596 |
| 26090 | ABHD12 | LZE21T | Human | Esophagus | ESCC | 3.32e-05 | 2.79e-01 | 0.0655 |
| 26090 | ABHD12 | P1T-E | Human | Esophagus | ESCC | 2.26e-06 | 5.48e-01 | 0.0875 |
| 26090 | ABHD12 | P2T-E | Human | Esophagus | ESCC | 3.01e-44 | 8.36e-01 | 0.1177 |
| 26090 | ABHD12 | P4T-E | Human | Esophagus | ESCC | 4.87e-30 | 9.72e-01 | 0.1323 |
| 26090 | ABHD12 | P5T-E | Human | Esophagus | ESCC | 6.67e-13 | 3.74e-01 | 0.1327 |
| 26090 | ABHD12 | P8T-E | Human | Esophagus | ESCC | 3.33e-36 | 7.32e-01 | 0.0889 |
| 26090 | ABHD12 | P9T-E | Human | Esophagus | ESCC | 1.25e-16 | 5.09e-01 | 0.1131 |
| 26090 | ABHD12 | P10T-E | Human | Esophagus | ESCC | 4.10e-66 | 1.25e+00 | 0.116 |
| 26090 | ABHD12 | P11T-E | Human | Esophagus | ESCC | 6.52e-30 | 1.21e+00 | 0.1426 |
| 26090 | ABHD12 | P12T-E | Human | Esophagus | ESCC | 6.01e-39 | 8.75e-01 | 0.1122 |
| 26090 | ABHD12 | P15T-E | Human | Esophagus | ESCC | 6.31e-33 | 6.93e-01 | 0.1149 |
| 26090 | ABHD12 | P16T-E | Human | Esophagus | ESCC | 3.21e-35 | 1.01e+00 | 0.1153 |
| 26090 | ABHD12 | P17T-E | Human | Esophagus | ESCC | 1.53e-14 | 8.16e-01 | 0.1278 |
| 26090 | ABHD12 | P19T-E | Human | Esophagus | ESCC | 1.41e-08 | 6.13e-01 | 0.1662 |
| 26090 | ABHD12 | P20T-E | Human | Esophagus | ESCC | 1.14e-48 | 1.03e+00 | 0.1124 |
| 26090 | ABHD12 | P21T-E | Human | Esophagus | ESCC | 8.67e-54 | 1.29e+00 | 0.1617 |
| Page: 1 2 3 4 5 6 |
| Tissue | Expression Dynamics | Abbreviation |
| Esophagus | 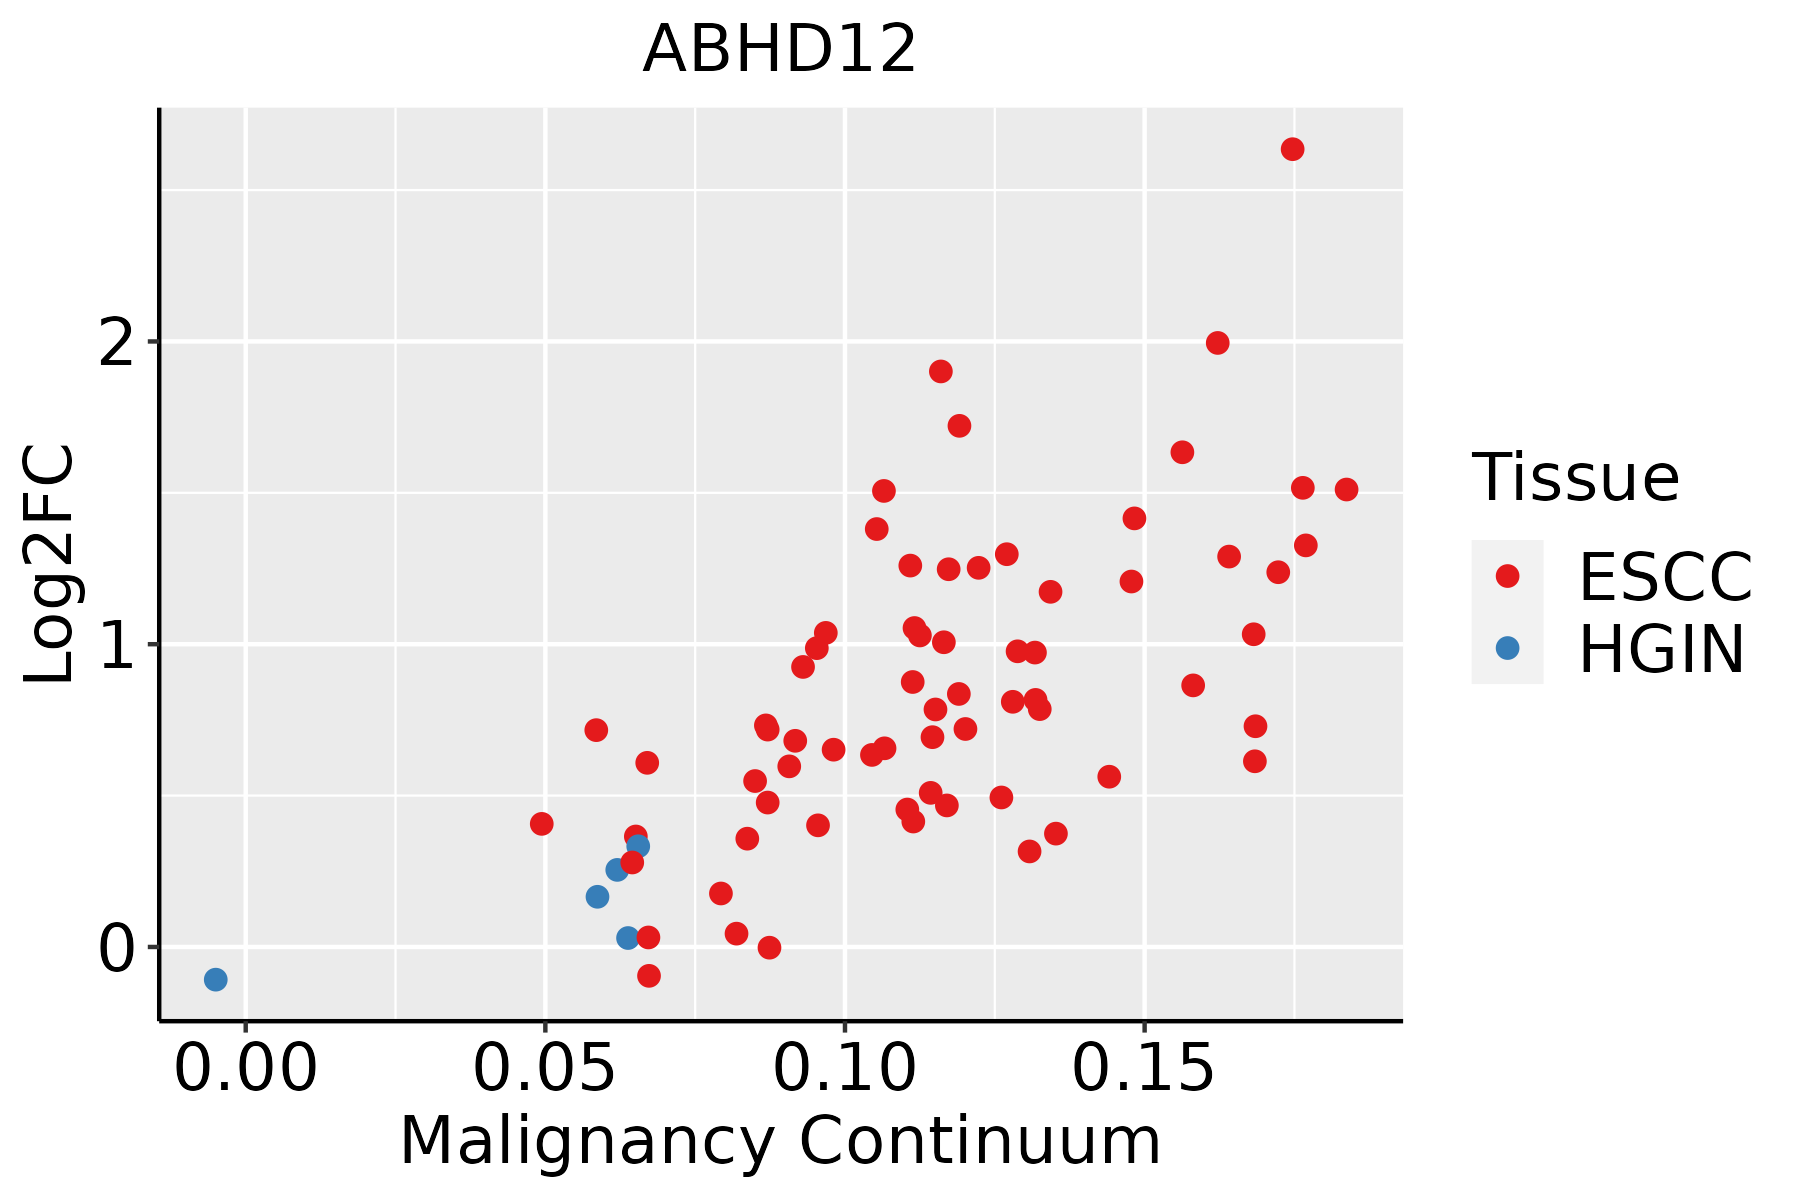 | ESCC: Esophageal squamous cell carcinoma |
| HGIN: High-grade intraepithelial neoplasias | ||
| LGIN: Low-grade intraepithelial neoplasias | ||
| Liver |  | HCC: Hepatocellular carcinoma |
| NAFLD: Non-alcoholic fatty liver disease | ||
| Oral Cavity |  | EOLP: Erosive Oral lichen planus |
| LP: leukoplakia | ||
| NEOLP: Non-erosive oral lichen planus | ||
| OSCC: Oral squamous cell carcinoma | ||
| Thyroid | 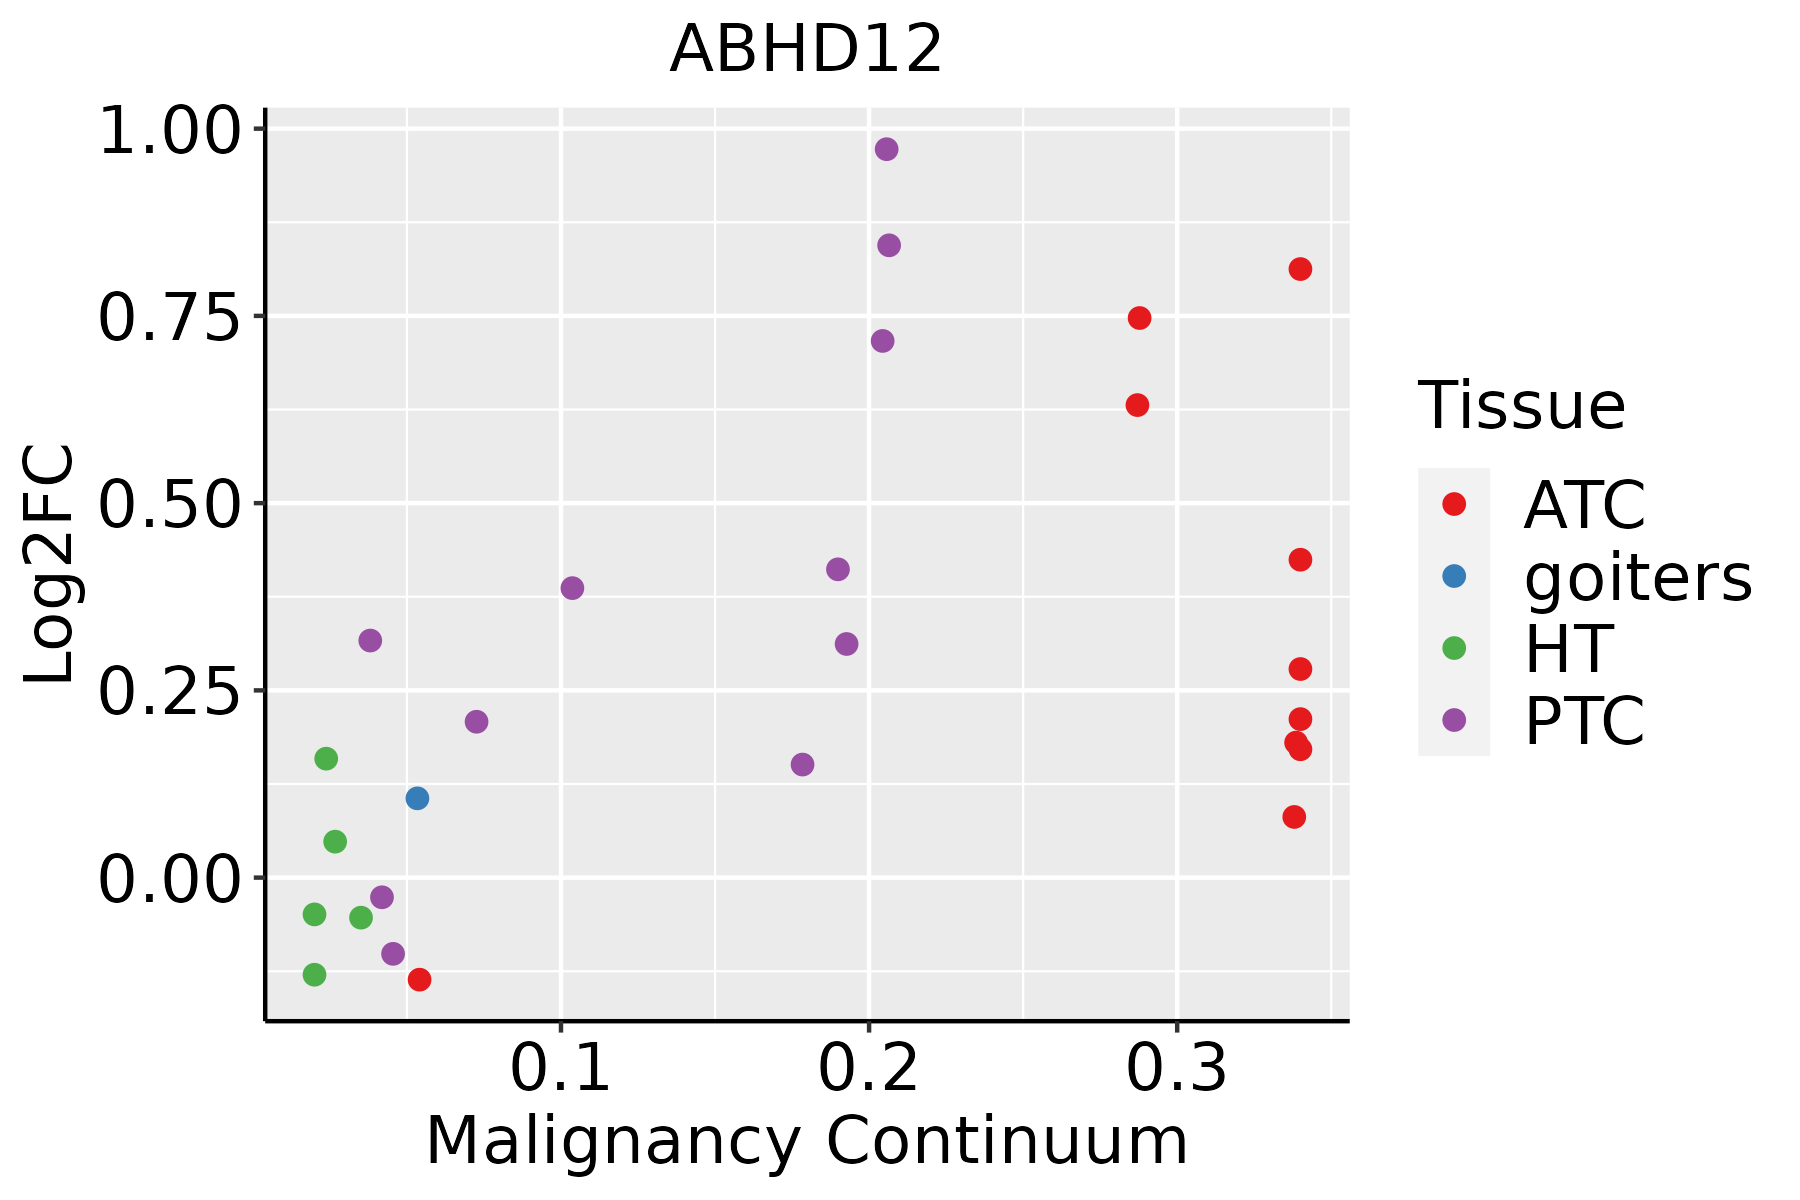 | ATC: Anaplastic thyroid cancer |
| HT: Hashimoto's thyroiditis | ||
| PTC: Papillary thyroid cancer |
| ∗log2FC in expression of this searched gene in stem-like cells from each diseased tissue sample relative to stem-like cells in normal samples in each tissue plotted against the malignancy continuum. Samples are colored based on if they are from different disease stage. |
Top |
Malignant transformation related pathway analysis |
| Find out the enriched GO biological processes and KEGG pathways involved in transition from healthy to precancer to cancer |
| Tissue | Disease Stage | Enriched GO biological Processes |
| Colorectum | AD |  |
| Colorectum | SER |  |
| Colorectum | MSS |  |
| Colorectum | MSI-H |  |
| Colorectum | FAP |  |
| ∗Top 15 enriched GO BP terms are showed in the bar plot of each disease state in each tissue. Each row represents a significant GO biological process which is colored according to the -log10(p.adjust). |
| Page: 1 2 3 4 5 6 7 8 9 |
| GO ID | Tissue | Disease Stage | Description | Gene Ratio | Bg Ratio | pvalue | p.adjust | Count |
| GO:00356015 | Esophagus | ESCC | protein deacylation | 79/8552 | 112/18723 | 8.30e-08 | 1.42e-06 | 79 |
| GO:00987325 | Esophagus | ESCC | macromolecule deacylation | 80/8552 | 116/18723 | 3.19e-07 | 4.50e-06 | 80 |
| GO:00066446 | Esophagus | ESCC | phospholipid metabolic process | 218/8552 | 383/18723 | 5.37e-06 | 5.59e-05 | 218 |
| GO:00421573 | Esophagus | ESCC | lipoprotein metabolic process | 86/8552 | 135/18723 | 1.78e-05 | 1.57e-04 | 86 |
| GO:00066318 | Esophagus | ESCC | fatty acid metabolic process | 217/8552 | 390/18723 | 4.21e-05 | 3.39e-04 | 217 |
| GO:00066505 | Esophagus | ESCC | glycerophospholipid metabolic process | 174/8552 | 306/18723 | 4.92e-05 | 3.85e-04 | 174 |
| GO:00065757 | Esophagus | ESCC | cellular modified amino acid metabolic process | 112/8552 | 188/18723 | 8.31e-05 | 6.06e-04 | 112 |
| GO:000961216 | Esophagus | ESCC | response to mechanical stimulus | 124/8552 | 216/18723 | 3.30e-04 | 1.94e-03 | 124 |
| GO:00464864 | Esophagus | ESCC | glycerolipid metabolic process | 211/8552 | 392/18723 | 6.51e-04 | 3.46e-03 | 211 |
| GO:00442427 | Esophagus | ESCC | cellular lipid catabolic process | 121/8552 | 214/18723 | 8.63e-04 | 4.43e-03 | 121 |
| GO:00020842 | Esophagus | ESCC | protein depalmitoylation | 9/8552 | 10/18723 | 5.09e-03 | 1.92e-02 | 9 |
| GO:00421593 | Esophagus | ESCC | lipoprotein catabolic process | 12/8552 | 15/18723 | 7.31e-03 | 2.63e-02 | 12 |
| GO:00160427 | Esophagus | ESCC | lipid catabolic process | 168/8552 | 320/18723 | 7.97e-03 | 2.84e-02 | 168 |
| GO:00066316 | Liver | NAFLD | fatty acid metabolic process | 92/1882 | 390/18723 | 3.38e-15 | 3.29e-12 | 92 |
| GO:00442425 | Liver | NAFLD | cellular lipid catabolic process | 52/1882 | 214/18723 | 1.15e-09 | 2.17e-07 | 52 |
| GO:00160426 | Liver | NAFLD | lipid catabolic process | 63/1882 | 320/18723 | 1.35e-07 | 1.02e-05 | 63 |
| GO:00066392 | Liver | NAFLD | acylglycerol metabolic process | 32/1882 | 128/18723 | 8.82e-07 | 4.60e-05 | 32 |
| GO:00066382 | Liver | NAFLD | neutral lipid metabolic process | 32/1882 | 129/18723 | 1.06e-06 | 5.35e-05 | 32 |
| GO:00464863 | Liver | NAFLD | glycerolipid metabolic process | 66/1882 | 392/18723 | 1.94e-05 | 5.52e-04 | 66 |
| GO:00464612 | Liver | NAFLD | neutral lipid catabolic process | 12/1882 | 39/18723 | 3.02e-04 | 4.75e-03 | 12 |
| Page: 1 2 3 4 |
| Pathway ID | Tissue | Disease Stage | Description | Gene Ratio | Bg Ratio | pvalue | p.adjust | qvalue | Count |
| Page: 1 |
Top |
Cell-cell communication analysis |
| Identification of potential cell-cell interactions between two cell types and their ligand-receptor pairs for different disease states |
| Ligand | Receptor | LRpair | Pathway | Tissue | Disease Stage |
| Page: 1 |
Top |
Single-cell gene regulatory network inference analysis |
| Find out the significant the regulons (TFs) and the target genes of each regulon across cell types for different disease states |
| TF | Cell Type | Tissue | Disease Stage | Target Gene | RSS | Regulon Activity |
| ∗The dot plots of a searched regulon are shown for all cell subpopulations in each disease state of each tissue based on the regulon specific score inferred using pySCENIC and by calculating the average expression. |
| Page: 1 |
Top |
Somatic mutation of malignant transformation related genes |
| Annotation of somatic variants for genes involved in malignant transformation |
| Hugo Symbol | Variant Class | Variant Classification | dbSNP RS | HGVSc | HGVSp | HGVSp Short | SWISSPROT | BIOTYPE | SIFT | PolyPhen | Tumor Sample Barcode | Tissue | Histology | Sex | Age | Stage | Therapy Types | Drugs | Outcome |
| ABHD12 | SNV | Missense_Mutation | novel | c.353N>G | p.Gln118Arg | p.Q118R | Q8N2K0 | protein_coding | tolerated(0.2) | benign(0.229) | TCGA-AC-A23G-01 | Breast | breast invasive carcinoma | Female | >=65 | I/II | Chemotherapy | cytoxan | CR |
| ABHD12 | insertion | In_Frame_Ins | novel | c.1158_1159insTTCCTTGTCAGCCCAAGGGAGGGC | p.Arg386_Pro387insPheLeuValSerProArgGluGly | p.R386_P387insFLVSPREG | Q8N2K0 | protein_coding | TCGA-A8-A06P-01 | Breast | breast invasive carcinoma | Female | <65 | III/IV | Unspecific | SD | |||
| ABHD12 | insertion | Frame_Shift_Ins | novel | c.1084_1085insCTGCTCAGGGGGCCTC | p.Val362AlafsTer24 | p.V362Afs*24 | Q8N2K0 | protein_coding | TCGA-AR-A0TY-01 | Breast | breast invasive carcinoma | Female | <65 | I/II | Unspecific | Paclitaxel | PD | ||
| ABHD12 | SNV | Missense_Mutation | novel | c.1039N>G | p.Ile347Val | p.I347V | Q8N2K0 | protein_coding | tolerated(0.06) | benign(0.023) | TCGA-2W-A8YY-01 | Cervix | cervical & endocervical cancer | Female | <65 | I/II | Chemotherapy | cisplatin | CR |
| ABHD12 | SNV | Missense_Mutation | rs535070738 | c.430N>A | p.Val144Ile | p.V144I | Q8N2K0 | protein_coding | deleterious(0.03) | benign(0.104) | TCGA-AA-3815-01 | Colorectum | colon adenocarcinoma | Female | >=65 | I/II | Unknown | Unknown | SD |
| ABHD12 | SNV | Missense_Mutation | c.349C>A | p.Pro117Thr | p.P117T | Q8N2K0 | protein_coding | deleterious(0) | possibly_damaging(0.67) | TCGA-AA-A010-01 | Colorectum | colon adenocarcinoma | Female | <65 | I/II | Chemotherapy | folinic | CR | |
| ABHD12 | SNV | Missense_Mutation | c.293C>G | p.Ala98Gly | p.A98G | Q8N2K0 | protein_coding | tolerated(0.12) | possibly_damaging(0.52) | TCGA-NH-A5IV-01 | Colorectum | colon adenocarcinoma | Female | >=65 | I/II | Unknown | Unknown | SD | |
| ABHD12 | SNV | Missense_Mutation | c.905N>C | p.Leu302Pro | p.L302P | Q8N2K0 | protein_coding | deleterious(0) | probably_damaging(0.989) | TCGA-RU-A8FL-01 | Colorectum | colon adenocarcinoma | Male | <65 | III/IV | Chemotherapy | folfox | PD | |
| ABHD12 | SNV | Missense_Mutation | novel | c.1183N>T | p.Pro395Ser | p.P395S | Q8N2K0 | protein_coding | deleterious_low_confidence(0) | probably_damaging(0.932) | TCGA-A5-A0G2-01 | Endometrium | uterine corpus endometrioid carcinoma | Female | <65 | III/IV | Unknown | Unknown | SD |
| ABHD12 | SNV | Missense_Mutation | rs771187489 | c.875N>A | p.Arg292Gln | p.R292Q | Q8N2K0 | protein_coding | tolerated(0.1) | probably_damaging(0.975) | TCGA-AP-A0LM-01 | Endometrium | uterine corpus endometrioid carcinoma | Female | <65 | III/IV | Chemotherapy | cisplatin | SD |
| Page: 1 2 3 |
Top |
Related drugs of malignant transformation related genes |
| Identification of chemicals and drugs interact with genes involved in malignant transfromation |
| (DGIdb 4.0) |
| Entrez ID | Symbol | Category | Interaction Types | Drug Claim Name | Drug Name | PMIDs |
| 26090 | ABHD12 | ENZYME, DRUGGABLE GENOME, PHOSPHOLIPASE | inhibitor | 178101960 | ORLISTAT | |
| 26090 | ABHD12 | ENZYME, DRUGGABLE GENOME, PHOSPHOLIPASE | inhibitor | 381744932 |
| Page: 1 |

Copyright 2023-Present -The University of Texas Health Science Center at Houston |