
|
|||||
|
 | |
| |
| |
| |
| |
| |
|
Gene: ABHD10 |
Gene summary for ABHD10 |
| Gene information | Species | Human | Gene symbol | ABHD10 | Gene ID | 55347 |
| Gene name | abhydrolase domain containing 10, depalmitoylase | |
| Gene Alias | ABHD10 | |
| Cytomap | 3q13.2 | |
| Gene Type | protein-coding | GO ID | GO:0002084 | UniProtAcc | Q9NUJ1 |
Top |
Malignant transformation analysis |
| Identification of the aberrant gene expression in precancerous and cancerous lesions by comparing the gene expression of stem-like cells in diseased tissues with normal stem cells |
| Entrez ID | Symbol | Replicates | Species | Organ | Tissue | Adj P-value | Log2FC | Malignancy |
| 55347 | ABHD10 | LZE4T | Human | Esophagus | ESCC | 2.56e-13 | 1.97e-01 | 0.0811 |
| 55347 | ABHD10 | LZE7T | Human | Esophagus | ESCC | 7.40e-11 | 4.16e-01 | 0.0667 |
| 55347 | ABHD10 | LZE24T | Human | Esophagus | ESCC | 3.32e-17 | 2.27e-01 | 0.0596 |
| 55347 | ABHD10 | P1T-E | Human | Esophagus | ESCC | 4.83e-03 | 1.58e-01 | 0.0875 |
| 55347 | ABHD10 | P2T-E | Human | Esophagus | ESCC | 1.95e-16 | 1.57e-01 | 0.1177 |
| 55347 | ABHD10 | P4T-E | Human | Esophagus | ESCC | 8.20e-18 | 3.64e-01 | 0.1323 |
| 55347 | ABHD10 | P5T-E | Human | Esophagus | ESCC | 8.38e-14 | 2.86e-01 | 0.1327 |
| 55347 | ABHD10 | P8T-E | Human | Esophagus | ESCC | 1.13e-23 | 4.47e-01 | 0.0889 |
| 55347 | ABHD10 | P9T-E | Human | Esophagus | ESCC | 4.94e-07 | 2.39e-01 | 0.1131 |
| 55347 | ABHD10 | P10T-E | Human | Esophagus | ESCC | 6.12e-22 | 4.39e-01 | 0.116 |
| 55347 | ABHD10 | P11T-E | Human | Esophagus | ESCC | 2.35e-14 | 3.04e-01 | 0.1426 |
| 55347 | ABHD10 | P12T-E | Human | Esophagus | ESCC | 3.00e-15 | 2.32e-01 | 0.1122 |
| 55347 | ABHD10 | P15T-E | Human | Esophagus | ESCC | 1.20e-19 | 1.91e-01 | 0.1149 |
| 55347 | ABHD10 | P16T-E | Human | Esophagus | ESCC | 9.12e-27 | 4.29e-01 | 0.1153 |
| 55347 | ABHD10 | P17T-E | Human | Esophagus | ESCC | 2.76e-05 | 1.45e-01 | 0.1278 |
| 55347 | ABHD10 | P20T-E | Human | Esophagus | ESCC | 3.81e-15 | 2.51e-01 | 0.1124 |
| 55347 | ABHD10 | P21T-E | Human | Esophagus | ESCC | 1.88e-18 | 3.28e-01 | 0.1617 |
| 55347 | ABHD10 | P22T-E | Human | Esophagus | ESCC | 7.85e-24 | 4.69e-01 | 0.1236 |
| 55347 | ABHD10 | P23T-E | Human | Esophagus | ESCC | 3.21e-13 | 2.11e-01 | 0.108 |
| 55347 | ABHD10 | P24T-E | Human | Esophagus | ESCC | 2.41e-03 | 1.08e-01 | 0.1287 |
| Page: 1 2 3 4 |
| Tissue | Expression Dynamics | Abbreviation |
| Esophagus | 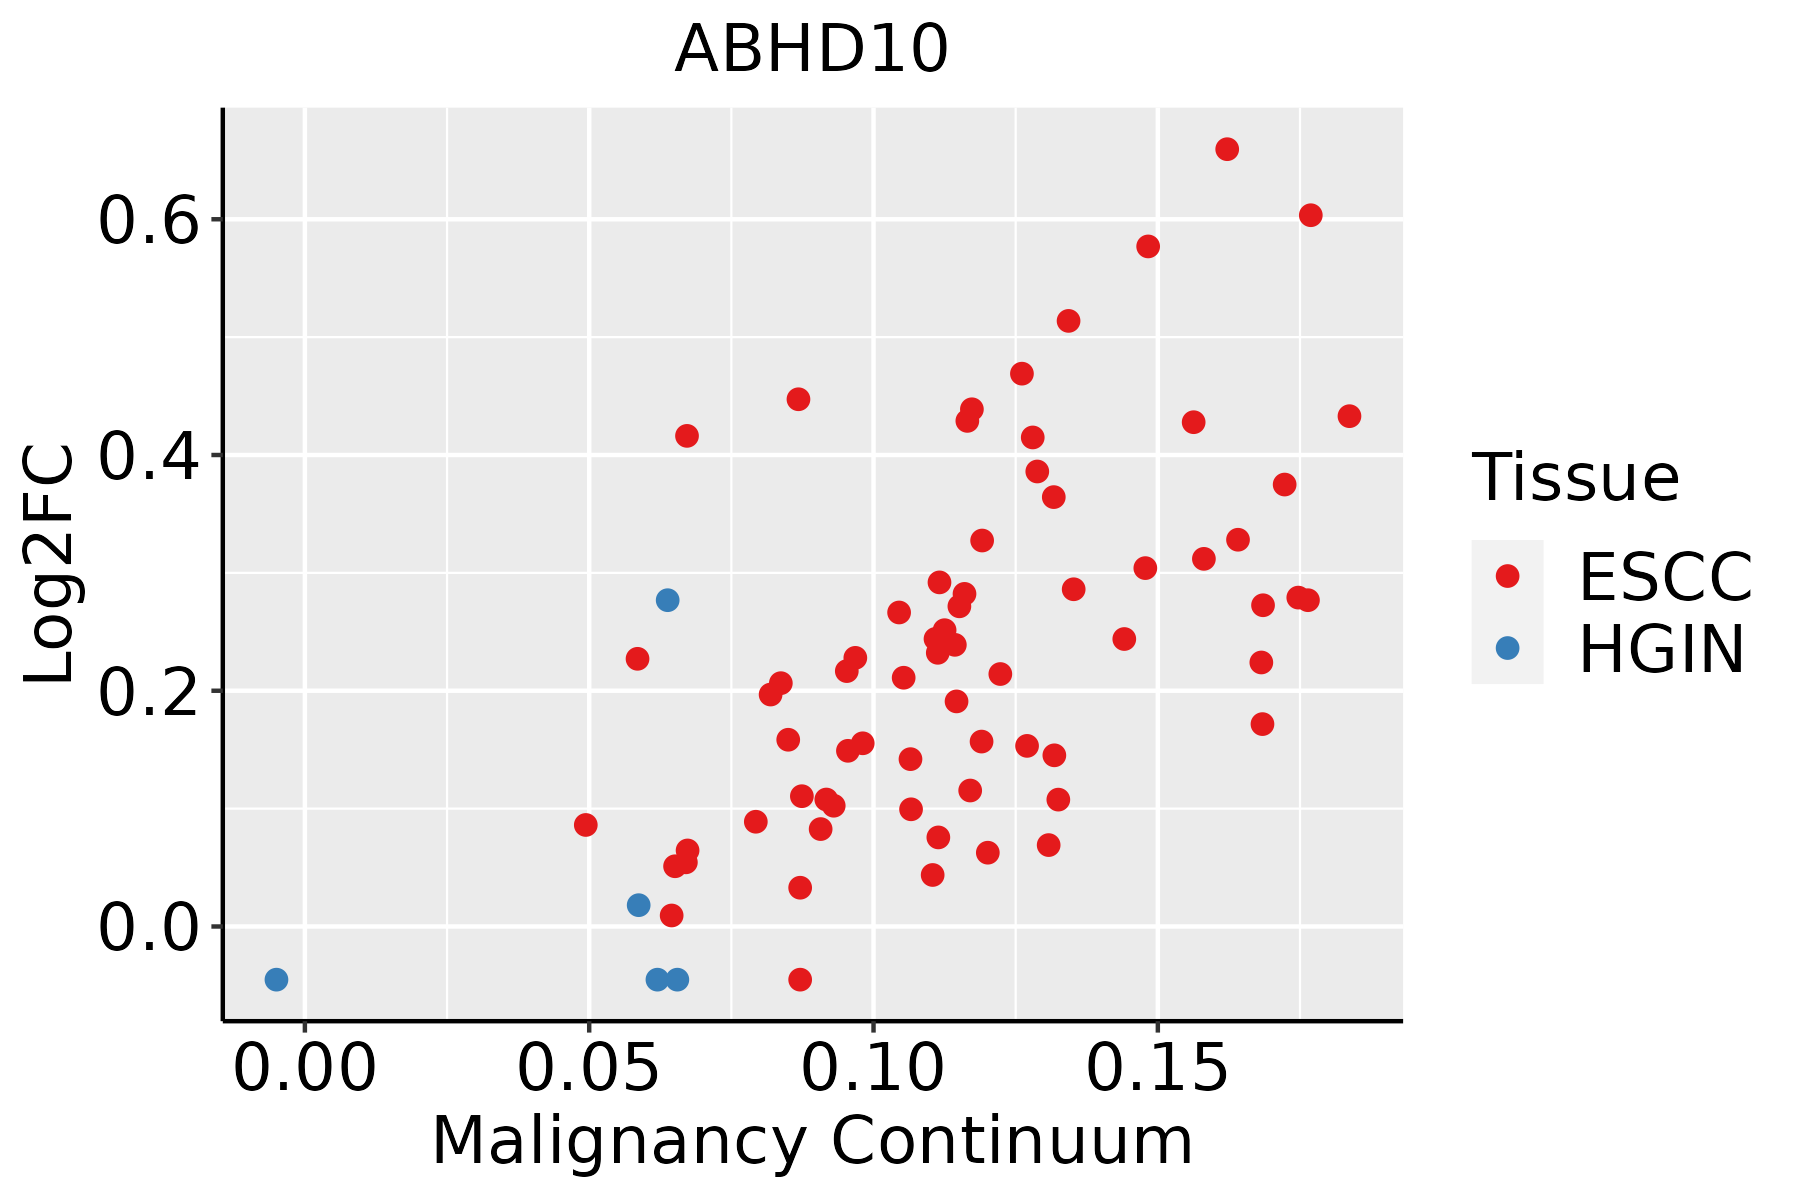 | ESCC: Esophageal squamous cell carcinoma |
| HGIN: High-grade intraepithelial neoplasias | ||
| LGIN: Low-grade intraepithelial neoplasias | ||
| Liver | 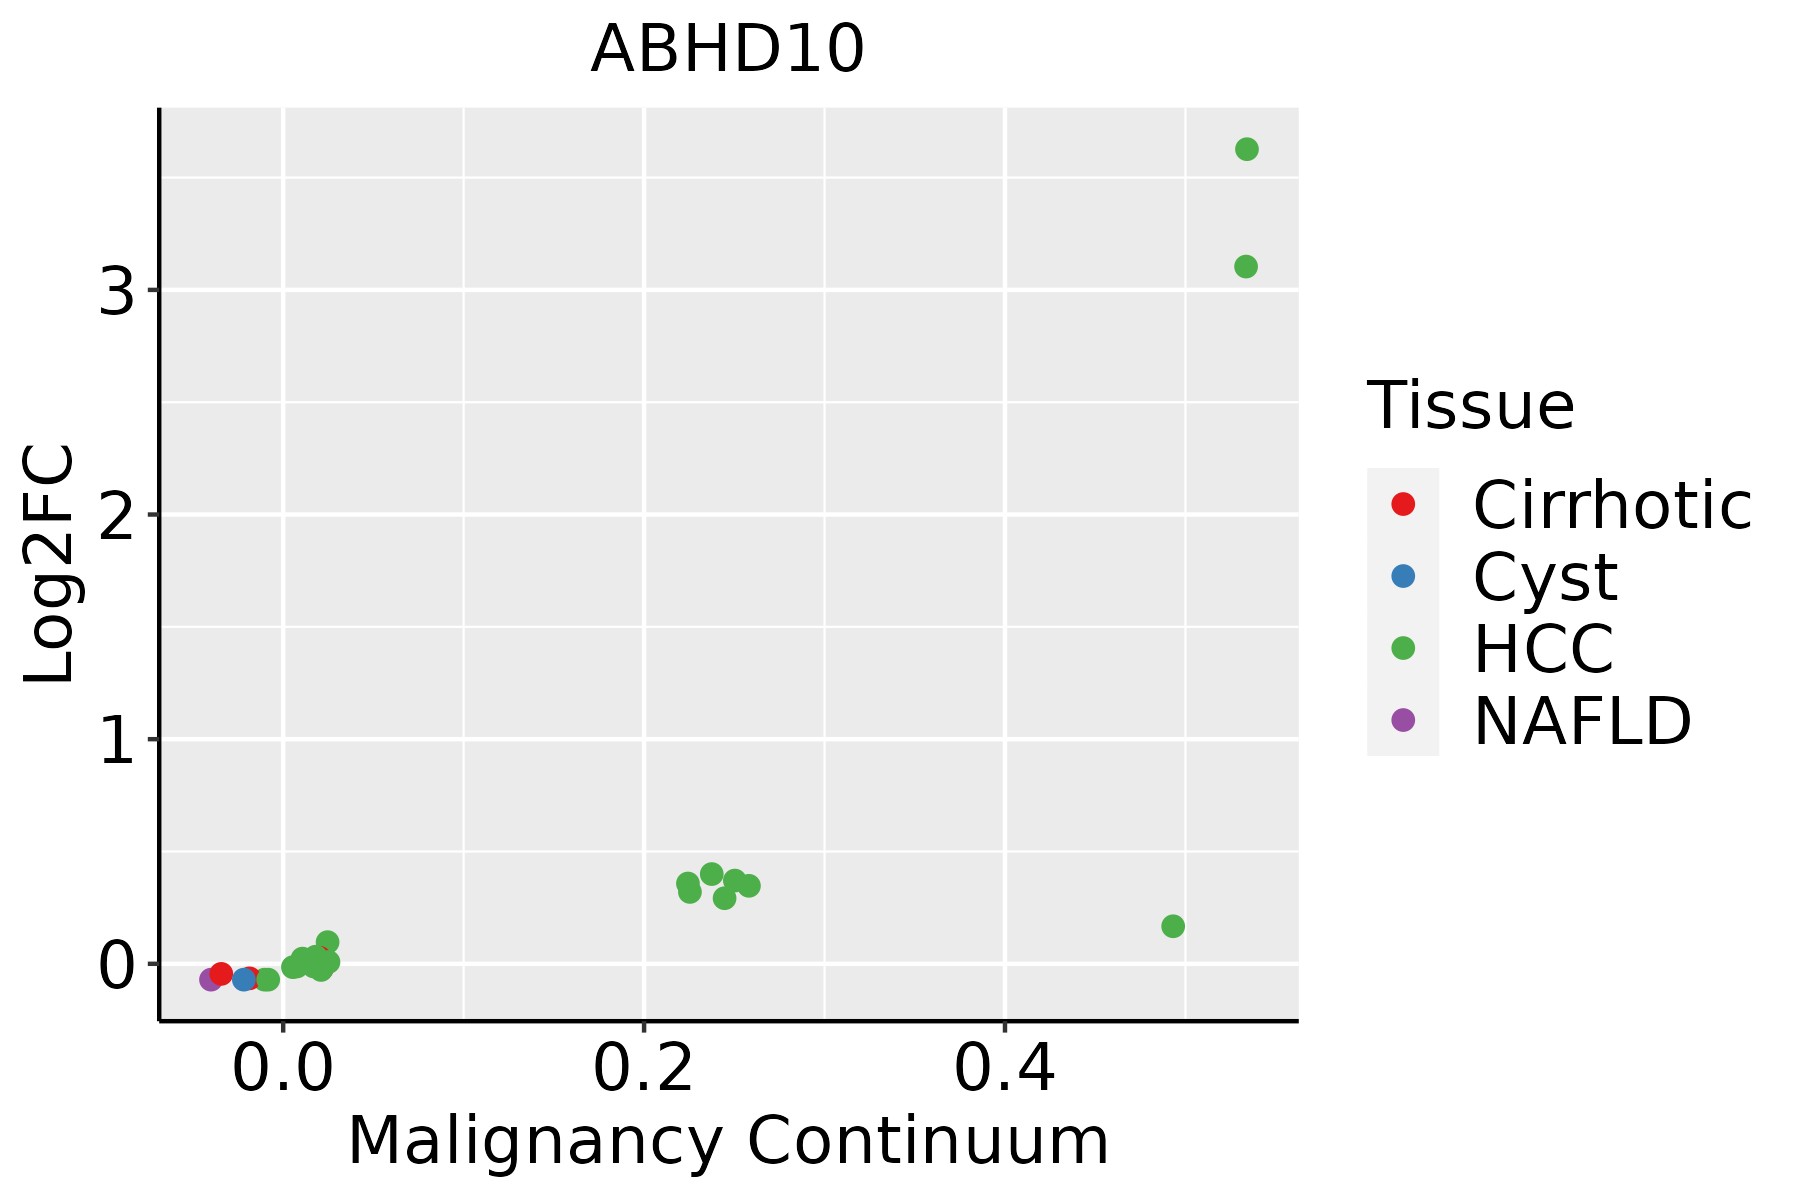 | HCC: Hepatocellular carcinoma |
| NAFLD: Non-alcoholic fatty liver disease |
| ∗log2FC in expression of this searched gene in stem-like cells from each diseased tissue sample relative to stem-like cells in normal samples in each tissue plotted against the malignancy continuum. Samples are colored based on if they are from different disease stage. |
Top |
Malignant transformation related pathway analysis |
| Find out the enriched GO biological processes and KEGG pathways involved in transition from healthy to precancer to cancer |
| Tissue | Disease Stage | Enriched GO biological Processes |
| Colorectum | AD |  |
| Colorectum | SER |  |
| Colorectum | MSS |  |
| Colorectum | MSI-H |  |
| Colorectum | FAP |  |
| ∗Top 15 enriched GO BP terms are showed in the bar plot of each disease state in each tissue. Each row represents a significant GO biological process which is colored according to the -log10(p.adjust). |
| Page: 1 2 3 4 5 6 7 8 9 |
| GO ID | Tissue | Disease Stage | Description | Gene Ratio | Bg Ratio | pvalue | p.adjust | Count |
| GO:00356015 | Esophagus | ESCC | protein deacylation | 79/8552 | 112/18723 | 8.30e-08 | 1.42e-06 | 79 |
| GO:00987325 | Esophagus | ESCC | macromolecule deacylation | 80/8552 | 116/18723 | 3.19e-07 | 4.50e-06 | 80 |
| GO:00421573 | Esophagus | ESCC | lipoprotein metabolic process | 86/8552 | 135/18723 | 1.78e-05 | 1.57e-04 | 86 |
| GO:00442626 | Esophagus | ESCC | cellular carbohydrate metabolic process | 160/8552 | 283/18723 | 1.43e-04 | 9.66e-04 | 160 |
| GO:19016574 | Esophagus | ESCC | glycosyl compound metabolic process | 57/8552 | 88/18723 | 2.32e-04 | 1.44e-03 | 57 |
| GO:001605216 | Esophagus | ESCC | carbohydrate catabolic process | 91/8552 | 154/18723 | 5.39e-04 | 2.97e-03 | 91 |
| GO:19011362 | Esophagus | ESCC | carbohydrate derivative catabolic process | 99/8552 | 172/18723 | 1.11e-03 | 5.54e-03 | 99 |
| GO:00442751 | Esophagus | ESCC | cellular carbohydrate catabolic process | 27/8552 | 40/18723 | 4.39e-03 | 1.73e-02 | 27 |
| GO:00020842 | Esophagus | ESCC | protein depalmitoylation | 9/8552 | 10/18723 | 5.09e-03 | 1.92e-02 | 9 |
| GO:00421593 | Esophagus | ESCC | lipoprotein catabolic process | 12/8552 | 15/18723 | 7.31e-03 | 2.63e-02 | 12 |
| GO:00161373 | Esophagus | ESCC | glycoside metabolic process | 16/8552 | 22/18723 | 9.46e-03 | 3.28e-02 | 16 |
| GO:001605222 | Liver | HCC | carbohydrate catabolic process | 99/7958 | 154/18723 | 3.79e-08 | 8.30e-07 | 99 |
| GO:00421571 | Liver | HCC | lipoprotein metabolic process | 86/7958 | 135/18723 | 5.21e-07 | 8.38e-06 | 86 |
| GO:004426221 | Liver | HCC | cellular carbohydrate metabolic process | 153/7958 | 283/18723 | 5.27e-05 | 5.00e-04 | 153 |
| GO:1901136 | Liver | HCC | carbohydrate derivative catabolic process | 98/7958 | 172/18723 | 8.71e-05 | 7.62e-04 | 98 |
| GO:19016571 | Liver | HCC | glycosyl compound metabolic process | 55/7958 | 88/18723 | 1.20e-04 | 1.01e-03 | 55 |
| GO:0042159 | Liver | HCC | lipoprotein catabolic process | 13/7958 | 15/18723 | 5.67e-04 | 3.61e-03 | 13 |
| GO:0098732 | Liver | HCC | macromolecule deacylation | 67/7958 | 116/18723 | 6.46e-04 | 3.99e-03 | 67 |
| GO:00356011 | Liver | HCC | protein deacylation | 64/7958 | 112/18723 | 1.23e-03 | 6.83e-03 | 64 |
| GO:00161371 | Liver | HCC | glycoside metabolic process | 16/7958 | 22/18723 | 4.03e-03 | 1.76e-02 | 16 |
| Page: 1 2 |
| Pathway ID | Tissue | Disease Stage | Description | Gene Ratio | Bg Ratio | pvalue | p.adjust | qvalue | Count |
| Page: 1 |
Top |
Cell-cell communication analysis |
| Identification of potential cell-cell interactions between two cell types and their ligand-receptor pairs for different disease states |
| Ligand | Receptor | LRpair | Pathway | Tissue | Disease Stage |
| Page: 1 |
Top |
Single-cell gene regulatory network inference analysis |
| Find out the significant the regulons (TFs) and the target genes of each regulon across cell types for different disease states |
| TF | Cell Type | Tissue | Disease Stage | Target Gene | RSS | Regulon Activity |
| ∗The dot plots of a searched regulon are shown for all cell subpopulations in each disease state of each tissue based on the regulon specific score inferred using pySCENIC and by calculating the average expression. |
| Page: 1 |
Top |
Somatic mutation of malignant transformation related genes |
| Annotation of somatic variants for genes involved in malignant transformation |
| Hugo Symbol | Variant Class | Variant Classification | dbSNP RS | HGVSc | HGVSp | HGVSp Short | SWISSPROT | BIOTYPE | SIFT | PolyPhen | Tumor Sample Barcode | Tissue | Histology | Sex | Age | Stage | Therapy Types | Drugs | Outcome |
| ABHD10 | SNV | Missense_Mutation | c.856N>A | p.Asp286Asn | p.D286N | Q9NUJ1 | protein_coding | deleterious(0.03) | possibly_damaging(0.725) | TCGA-FU-A3HY-01 | Cervix | cervical & endocervical cancer | Female | <65 | I/II | Chemotherapy | cisplatin | CR | |
| ABHD10 | SNV | Missense_Mutation | c.716N>A | p.Cys239Tyr | p.C239Y | Q9NUJ1 | protein_coding | deleterious(0) | probably_damaging(0.998) | TCGA-AA-3864-01 | Colorectum | colon adenocarcinoma | Male | >=65 | I/II | Unknown | Unknown | SD | |
| ABHD10 | SNV | Missense_Mutation | rs145014452 | c.494N>A | p.Arg165Gln | p.R165Q | Q9NUJ1 | protein_coding | deleterious(0) | possibly_damaging(0.806) | TCGA-CM-6171-01 | Colorectum | colon adenocarcinoma | Female | >=65 | I/II | Unknown | Unknown | SD |
| ABHD10 | SNV | Missense_Mutation | c.868C>A | p.Leu290Ile | p.L290I | Q9NUJ1 | protein_coding | tolerated(0.32) | benign(0.009) | TCGA-AG-3892-01 | Colorectum | rectum adenocarcinoma | Female | <65 | I/II | Unknown | Unknown | SD | |
| ABHD10 | SNV | Missense_Mutation | novel | c.589N>T | p.Val197Leu | p.V197L | Q9NUJ1 | protein_coding | tolerated(0.33) | benign(0.024) | TCGA-A5-A0G2-01 | Endometrium | uterine corpus endometrioid carcinoma | Female | <65 | III/IV | Unknown | Unknown | SD |
| ABHD10 | SNV | Missense_Mutation | novel | c.376N>G | p.Thr126Ala | p.T126A | Q9NUJ1 | protein_coding | deleterious(0.01) | possibly_damaging(0.755) | TCGA-AP-A1DV-01 | Endometrium | uterine corpus endometrioid carcinoma | Female | <65 | I/II | Unknown | Unknown | SD |
| ABHD10 | SNV | Missense_Mutation | rs779860005 | c.316N>A | p.Ala106Thr | p.A106T | Q9NUJ1 | protein_coding | deleterious(0) | possibly_damaging(0.881) | TCGA-AX-A1CE-01 | Endometrium | uterine corpus endometrioid carcinoma | Female | <65 | I/II | Unspecific | Paclitaxel | SD |
| ABHD10 | SNV | Missense_Mutation | novel | c.253N>A | p.Leu85Ile | p.L85I | Q9NUJ1 | protein_coding | tolerated(0.52) | benign(0.01) | TCGA-B5-A3FA-01 | Endometrium | uterine corpus endometrioid carcinoma | Female | >=65 | I/II | Unknown | Unknown | SD |
| ABHD10 | SNV | Missense_Mutation | novel | c.828N>G | p.His276Gln | p.H276Q | Q9NUJ1 | protein_coding | tolerated(0.52) | benign(0.011) | TCGA-D1-A17Q-01 | Endometrium | uterine corpus endometrioid carcinoma | Female | <65 | I/II | Unknown | Unknown | SD |
| ABHD10 | SNV | Missense_Mutation | novel | c.779N>C | p.Val260Ala | p.V260A | Q9NUJ1 | protein_coding | deleterious(0) | possibly_damaging(0.745) | TCGA-EO-A3B0-01 | Endometrium | uterine corpus endometrioid carcinoma | Female | <65 | III/IV | Unknown | Unknown | SD |
| Page: 1 2 3 |
Top |
Related drugs of malignant transformation related genes |
| Identification of chemicals and drugs interact with genes involved in malignant transfromation |
| (DGIdb 4.0) |
| Entrez ID | Symbol | Category | Interaction Types | Drug Claim Name | Drug Name | PMIDs |
| Page: 1 |

Copyright 2023-Present -The University of Texas Health Science Center at Houston |