
|
|||||
|
 | |
| |
| |
| |
| |
| |
|
Gene: ABCG5 |
Gene summary for ABCG5 |
| Gene information | Species | Human | Gene symbol | ABCG5 | Gene ID | 64240 |
| Gene name | ATP binding cassette subfamily G member 5 | |
| Gene Alias | STSL | |
| Cytomap | 2p21 | |
| Gene Type | protein-coding | GO ID | GO:0003008 | UniProtAcc | Q9H222 |
Top |
Malignant transformation analysis |
| Identification of the aberrant gene expression in precancerous and cancerous lesions by comparing the gene expression of stem-like cells in diseased tissues with normal stem cells |
| Entrez ID | Symbol | Replicates | Species | Organ | Tissue | Adj P-value | Log2FC | Malignancy |
| 64240 | ABCG5 | NAFLD1 | Human | Liver | NAFLD | 1.07e-09 | 9.06e-01 | -0.04 |
| 64240 | ABCG5 | S41 | Human | Liver | Cirrhotic | 2.93e-02 | 3.07e-01 | -0.0343 |
| 64240 | ABCG5 | S43 | Human | Liver | Cirrhotic | 2.84e-02 | -1.04e-01 | -0.0187 |
| 64240 | ABCG5 | HCC1_Meng | Human | Liver | HCC | 2.82e-08 | -8.45e-02 | 0.0246 |
| 64240 | ABCG5 | HCC1 | Human | Liver | HCC | 1.34e-13 | 3.56e+00 | 0.5336 |
| Page: 1 |
| Tissue | Expression Dynamics | Abbreviation |
| Liver | 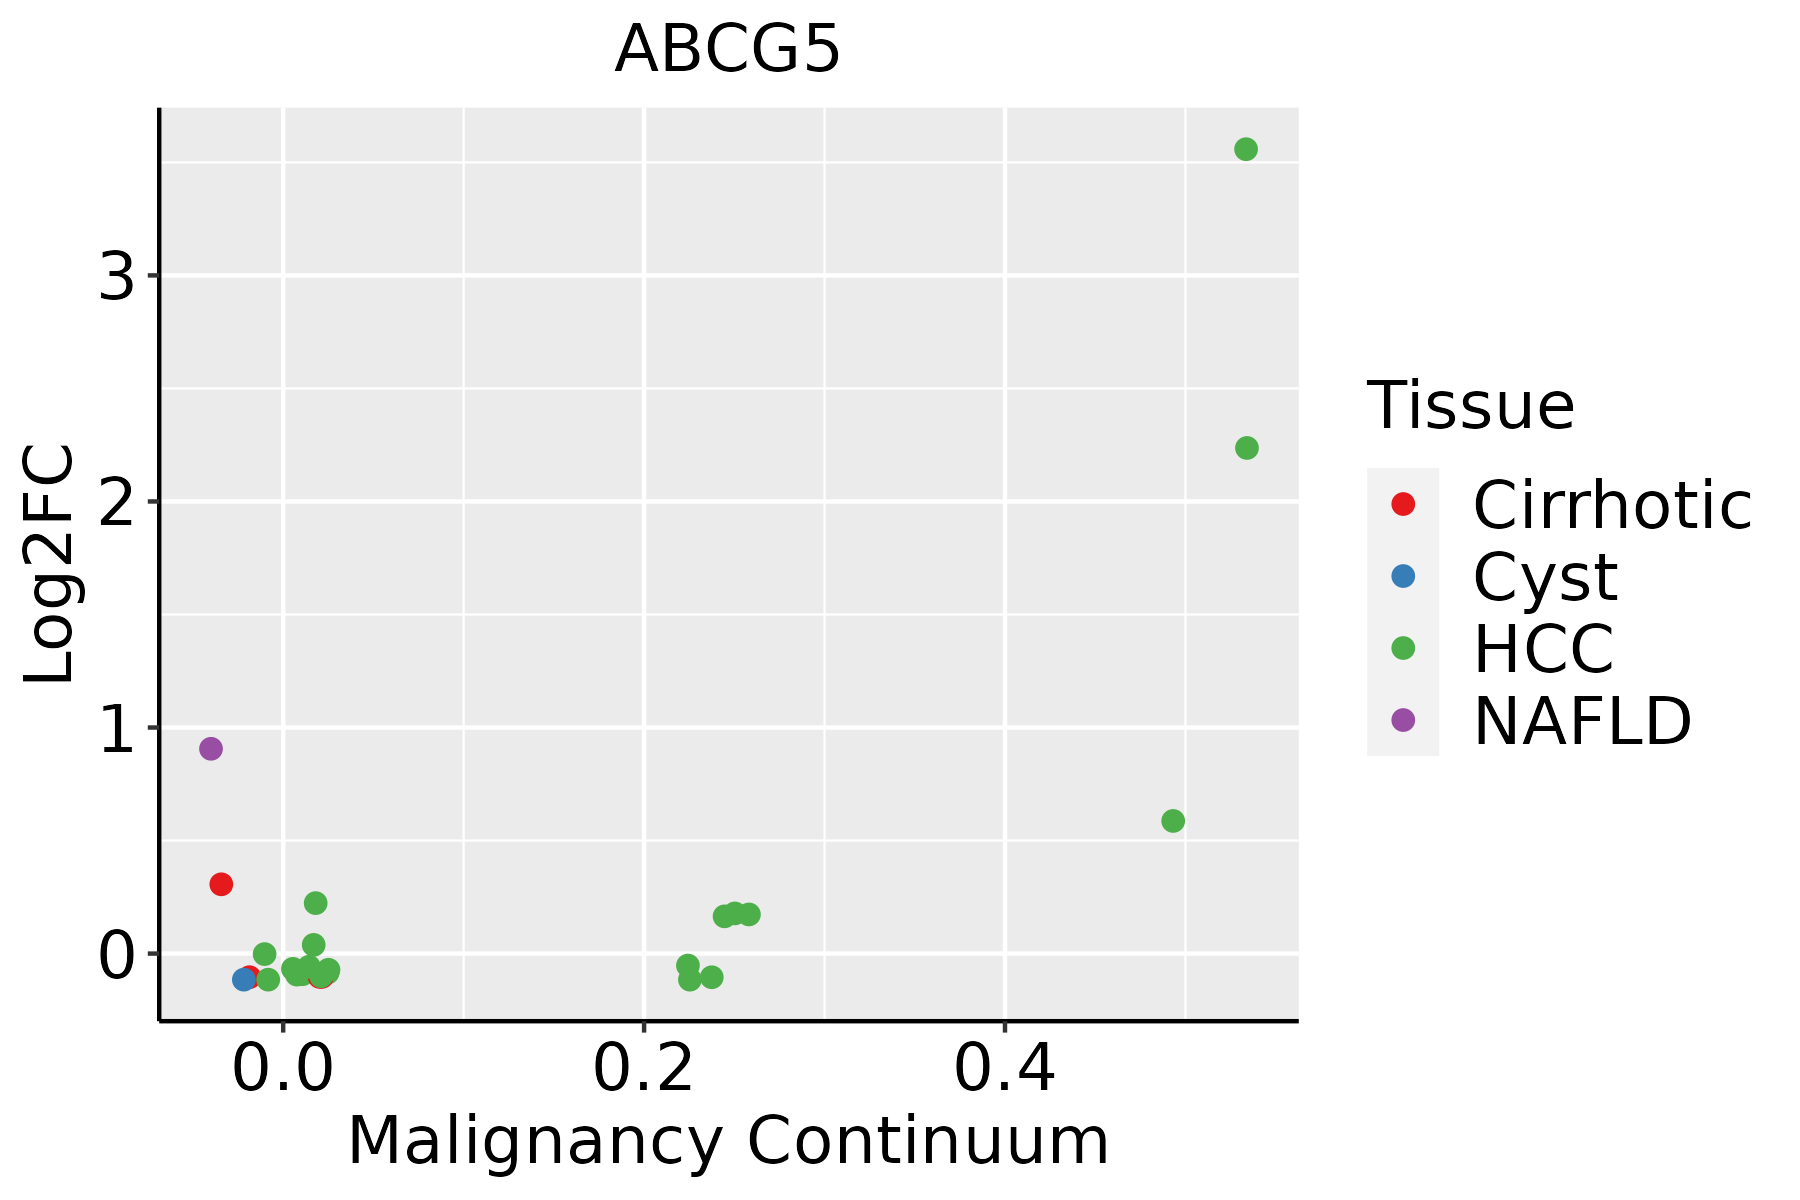 | HCC: Hepatocellular carcinoma |
| NAFLD: Non-alcoholic fatty liver disease |
| ∗log2FC in expression of this searched gene in stem-like cells from each diseased tissue sample relative to stem-like cells in normal samples in each tissue plotted against the malignancy continuum. Samples are colored based on if they are from different disease stage. |
Top |
Malignant transformation related pathway analysis |
| Find out the enriched GO biological processes and KEGG pathways involved in transition from healthy to precancer to cancer |
| Tissue | Disease Stage | Enriched GO biological Processes |
| Colorectum | AD |  |
| Colorectum | SER |  |
| Colorectum | MSS |  |
| Colorectum | MSI-H |  |
| Colorectum | FAP |  |
| ∗Top 15 enriched GO BP terms are showed in the bar plot of each disease state in each tissue. Each row represents a significant GO biological process which is colored according to the -log10(p.adjust). |
| Page: 1 2 3 4 5 6 7 8 9 |
| GO ID | Tissue | Disease Stage | Description | Gene Ratio | Bg Ratio | pvalue | p.adjust | Count |
| GO:00550883 | Liver | NAFLD | lipid homeostasis | 44/1882 | 167/18723 | 1.48e-09 | 2.54e-07 | 44 |
| GO:00094107 | Liver | NAFLD | response to xenobiotic stimulus | 88/1882 | 462/18723 | 2.53e-09 | 4.11e-07 | 88 |
| GO:00316677 | Liver | NAFLD | response to nutrient levels | 85/1882 | 474/18723 | 8.23e-08 | 7.09e-06 | 85 |
| GO:0055090 | Liver | NAFLD | acylglycerol homeostasis | 17/1882 | 42/18723 | 2.22e-07 | 1.53e-05 | 17 |
| GO:0070328 | Liver | NAFLD | triglyceride homeostasis | 17/1882 | 42/18723 | 2.22e-07 | 1.53e-05 | 17 |
| GO:00108765 | Liver | NAFLD | lipid localization | 79/1882 | 448/18723 | 4.75e-07 | 2.92e-05 | 79 |
| GO:00303013 | Liver | NAFLD | cholesterol transport | 30/1882 | 117/18723 | 1.08e-06 | 5.40e-05 | 30 |
| GO:00068694 | Liver | NAFLD | lipid transport | 71/1882 | 398/18723 | 1.16e-06 | 5.59e-05 | 71 |
| GO:00159183 | Liver | NAFLD | sterol transport | 32/1882 | 130/18723 | 1.27e-06 | 6.01e-05 | 32 |
| GO:00426323 | Liver | NAFLD | cholesterol homeostasis | 26/1882 | 96/18723 | 1.83e-06 | 7.86e-05 | 26 |
| GO:00550923 | Liver | NAFLD | sterol homeostasis | 26/1882 | 97/18723 | 2.26e-06 | 9.51e-05 | 26 |
| GO:0033344 | Liver | NAFLD | cholesterol efflux | 20/1882 | 69/18723 | 9.13e-06 | 2.98e-04 | 20 |
| GO:00075844 | Liver | NAFLD | response to nutrient | 36/1882 | 174/18723 | 2.06e-05 | 5.78e-04 | 36 |
| GO:0015850 | Liver | NAFLD | organic hydroxy compound transport | 50/1882 | 284/18723 | 6.01e-05 | 1.32e-03 | 50 |
| GO:0032371 | Liver | NAFLD | regulation of sterol transport | 20/1882 | 78/18723 | 6.46e-05 | 1.39e-03 | 20 |
| GO:0032374 | Liver | NAFLD | regulation of cholesterol transport | 20/1882 | 78/18723 | 6.46e-05 | 1.39e-03 | 20 |
| GO:19044781 | Liver | NAFLD | regulation of intestinal absorption | 7/1882 | 13/18723 | 1.02e-04 | 2.02e-03 | 7 |
| GO:0030300 | Liver | NAFLD | regulation of intestinal cholesterol absorption | 6/1882 | 10/18723 | 1.50e-04 | 2.78e-03 | 6 |
| GO:1905952 | Liver | NAFLD | regulation of lipid localization | 34/1882 | 181/18723 | 2.51e-04 | 4.12e-03 | 34 |
| GO:19047291 | Liver | NAFLD | regulation of intestinal lipid absorption | 6/1882 | 11/18723 | 3.03e-04 | 4.75e-03 | 6 |
| Page: 1 2 3 4 |
| Pathway ID | Tissue | Disease Stage | Description | Gene Ratio | Bg Ratio | pvalue | p.adjust | qvalue | Count |
| hsa049796 | Liver | NAFLD | Cholesterol metabolism | 20/1043 | 51/8465 | 9.73e-07 | 4.56e-05 | 3.67e-05 | 20 |
| hsa02010 | Liver | NAFLD | ABC transporters | 16/1043 | 45/8465 | 4.97e-05 | 1.16e-03 | 9.37e-04 | 16 |
| hsa049762 | Liver | NAFLD | Bile secretion | 20/1043 | 89/8465 | 5.08e-03 | 4.43e-02 | 3.57e-02 | 20 |
| hsa0497911 | Liver | NAFLD | Cholesterol metabolism | 20/1043 | 51/8465 | 9.73e-07 | 4.56e-05 | 3.67e-05 | 20 |
| hsa020101 | Liver | NAFLD | ABC transporters | 16/1043 | 45/8465 | 4.97e-05 | 1.16e-03 | 9.37e-04 | 16 |
| hsa0497611 | Liver | NAFLD | Bile secretion | 20/1043 | 89/8465 | 5.08e-03 | 4.43e-02 | 3.57e-02 | 20 |
| hsa049792 | Liver | Cirrhotic | Cholesterol metabolism | 30/2530 | 51/8465 | 1.59e-05 | 1.39e-04 | 8.60e-05 | 30 |
| hsa049793 | Liver | Cirrhotic | Cholesterol metabolism | 30/2530 | 51/8465 | 1.59e-05 | 1.39e-04 | 8.60e-05 | 30 |
| hsa049794 | Liver | HCC | Cholesterol metabolism | 41/4020 | 51/8465 | 1.33e-06 | 1.35e-05 | 7.49e-06 | 41 |
| hsa020102 | Liver | HCC | ABC transporters | 29/4020 | 45/8465 | 1.62e-02 | 3.88e-02 | 2.16e-02 | 29 |
| hsa049795 | Liver | HCC | Cholesterol metabolism | 41/4020 | 51/8465 | 1.33e-06 | 1.35e-05 | 7.49e-06 | 41 |
| hsa020103 | Liver | HCC | ABC transporters | 29/4020 | 45/8465 | 1.62e-02 | 3.88e-02 | 2.16e-02 | 29 |
| Page: 1 |
Top |
Cell-cell communication analysis |
| Identification of potential cell-cell interactions between two cell types and their ligand-receptor pairs for different disease states |
| Ligand | Receptor | LRpair | Pathway | Tissue | Disease Stage |
| Page: 1 |
Top |
Single-cell gene regulatory network inference analysis |
| Find out the significant the regulons (TFs) and the target genes of each regulon across cell types for different disease states |
| TF | Cell Type | Tissue | Disease Stage | Target Gene | RSS | Regulon Activity |
| ∗The dot plots of a searched regulon are shown for all cell subpopulations in each disease state of each tissue based on the regulon specific score inferred using pySCENIC and by calculating the average expression. |
| Page: 1 |
Top |
Somatic mutation of malignant transformation related genes |
| Annotation of somatic variants for genes involved in malignant transformation |
| Hugo Symbol | Variant Class | Variant Classification | dbSNP RS | HGVSc | HGVSp | HGVSp Short | SWISSPROT | BIOTYPE | SIFT | PolyPhen | Tumor Sample Barcode | Tissue | Histology | Sex | Age | Stage | Therapy Types | Drugs | Outcome |
| ABCG5 | SNV | Missense_Mutation | rs368800131 | c.827N>T | p.Thr276Met | p.T276M | Q9H222 | protein_coding | tolerated(0.07) | possibly_damaging(0.642) | TCGA-A8-A06U-01 | Breast | breast invasive carcinoma | Female | >=65 | I/II | Unknown | Unknown | SD |
| ABCG5 | SNV | Missense_Mutation | c.1942N>G | p.Leu648Val | p.L648V | Q9H222 | protein_coding | tolerated_low_confidence(0.16) | benign(0.01) | TCGA-A8-A0A7-01 | Breast | breast invasive carcinoma | Female | <65 | I/II | Unknown | Unknown | SD | |
| ABCG5 | SNV | Missense_Mutation | rs148131742 | c.1049N>T | p.Thr350Met | p.T350M | Q9H222 | protein_coding | tolerated(0.1) | benign(0.036) | TCGA-AN-A046-01 | Breast | breast invasive carcinoma | Female | >=65 | I/II | Unknown | Unknown | SD |
| ABCG5 | SNV | Missense_Mutation | rs771886629 | c.1426G>A | p.Val476Ile | p.V476I | Q9H222 | protein_coding | tolerated(1) | benign(0.003) | TCGA-LL-A7T0-01 | Breast | breast invasive carcinoma | Female | >=65 | I/II | Unknown | Unknown | SD |
| ABCG5 | insertion | Frame_Shift_Ins | novel | c.477_478insGT | p.Asn160ValfsTer17 | p.N160Vfs*17 | Q9H222 | protein_coding | TCGA-AN-A0FN-01 | Breast | breast invasive carcinoma | Female | <65 | I/II | Unknown | Unknown | SD | ||
| ABCG5 | insertion | In_Frame_Ins | novel | c.476_477insTAAAGAATTTTTTTTAGT | p.Gly159_Asn160insLysGluPhePheLeuVal | p.G159_N160insKEFFLV | Q9H222 | protein_coding | TCGA-AN-A0FN-01 | Breast | breast invasive carcinoma | Female | <65 | I/II | Unknown | Unknown | SD | ||
| ABCG5 | SNV | Missense_Mutation | c.898T>G | p.Phe300Val | p.F300V | Q9H222 | protein_coding | tolerated(0.06) | benign(0.197) | TCGA-AA-3510-01 | Colorectum | colon adenocarcinoma | Male | >=65 | I/II | Unknown | Unknown | SD | |
| ABCG5 | SNV | Missense_Mutation | rs368800131 | c.827C>T | p.Thr276Met | p.T276M | Q9H222 | protein_coding | tolerated(0.07) | possibly_damaging(0.642) | TCGA-AA-3984-01 | Colorectum | colon adenocarcinoma | Female | <65 | I/II | Unknown | Unknown | SD |
| ABCG5 | SNV | Missense_Mutation | c.982N>T | p.Ala328Ser | p.A328S | Q9H222 | protein_coding | tolerated(0.1) | benign(0.114) | TCGA-CA-5797-01 | Colorectum | colon adenocarcinoma | Male | <65 | I/II | Unknown | Unknown | SD | |
| ABCG5 | SNV | Missense_Mutation | c.1122N>T | p.Arg374Ser | p.R374S | Q9H222 | protein_coding | deleterious(0) | possibly_damaging(0.883) | TCGA-D5-6930-01 | Colorectum | colon adenocarcinoma | Male | >=65 | I/II | Unknown | Unknown | SD |
| Page: 1 2 3 4 5 6 7 |
Top |
Related drugs of malignant transformation related genes |
| Identification of chemicals and drugs interact with genes involved in malignant transfromation |
| (DGIdb 4.0) |
| Entrez ID | Symbol | Category | Interaction Types | Drug Claim Name | Drug Name | PMIDs |
| Page: 1 |

Copyright 2023-Present -The University of Texas Health Science Center at Houston |