
|
|||||
|
 | |
| |
| |
| |
| |
| |
|
Gene: ABCG2 |
Gene summary for ABCG2 |
| Gene information | Species | Human | Gene symbol | ABCG2 | Gene ID | 9429 |
| Gene name | ATP binding cassette subfamily G member 2 (Junior blood group) | |
| Gene Alias | ABC15 | |
| Cytomap | 4q22.1 | |
| Gene Type | protein-coding | GO ID | GO:0003008 | UniProtAcc | Q9UNQ0 |
Top |
Malignant transformation analysis |
| Identification of the aberrant gene expression in precancerous and cancerous lesions by comparing the gene expression of stem-like cells in diseased tissues with normal stem cells |
| Entrez ID | Symbol | Replicates | Species | Organ | Tissue | Adj P-value | Log2FC | Malignancy |
| 9429 | ABCG2 | HTA11_99999970781_79442 | Human | Colorectum | MSS | 3.08e-04 | 4.90e-02 | 0.294 |
| 9429 | ABCG2 | A008-E-015 | Human | Colorectum | FAP | 4.52e-02 | 1.10e-01 | 0.0177 |
| 9429 | ABCG2 | HCC1_Meng | Human | Liver | HCC | 9.25e-57 | 1.28e-01 | 0.0246 |
| 9429 | ABCG2 | HCC1 | Human | Liver | HCC | 9.31e-04 | 2.99e+00 | 0.5336 |
| 9429 | ABCG2 | HCC2 | Human | Liver | HCC | 3.02e-05 | 2.59e+00 | 0.5341 |
| 9429 | ABCG2 | Pat01-B | Human | Stomach | GC | 1.70e-27 | 5.20e-01 | 0.5754 |
| 9429 | ABCG2 | Pat03-B | Human | Stomach | GC | 1.15e-16 | 3.85e-01 | 0.3693 |
| 9429 | ABCG2 | Pat17-B | Human | Stomach | GC | 9.39e-08 | 2.54e-01 | 0.3109 |
| 9429 | ABCG2 | SIM_4 | Human | Stomach | SIM | 1.64e-11 | 4.67e-01 | 0.2664 |
| Page: 1 |
| Tissue | Expression Dynamics | Abbreviation |
| Colorectum (GSE201348) |  | FAP: Familial adenomatous polyposis |
| CRC: Colorectal cancer | ||
| Colorectum (HTA11) |  | AD: Adenomas |
| SER: Sessile serrated lesions | ||
| MSI-H: Microsatellite-high colorectal cancer | ||
| MSS: Microsatellite stable colorectal cancer | ||
| GC | 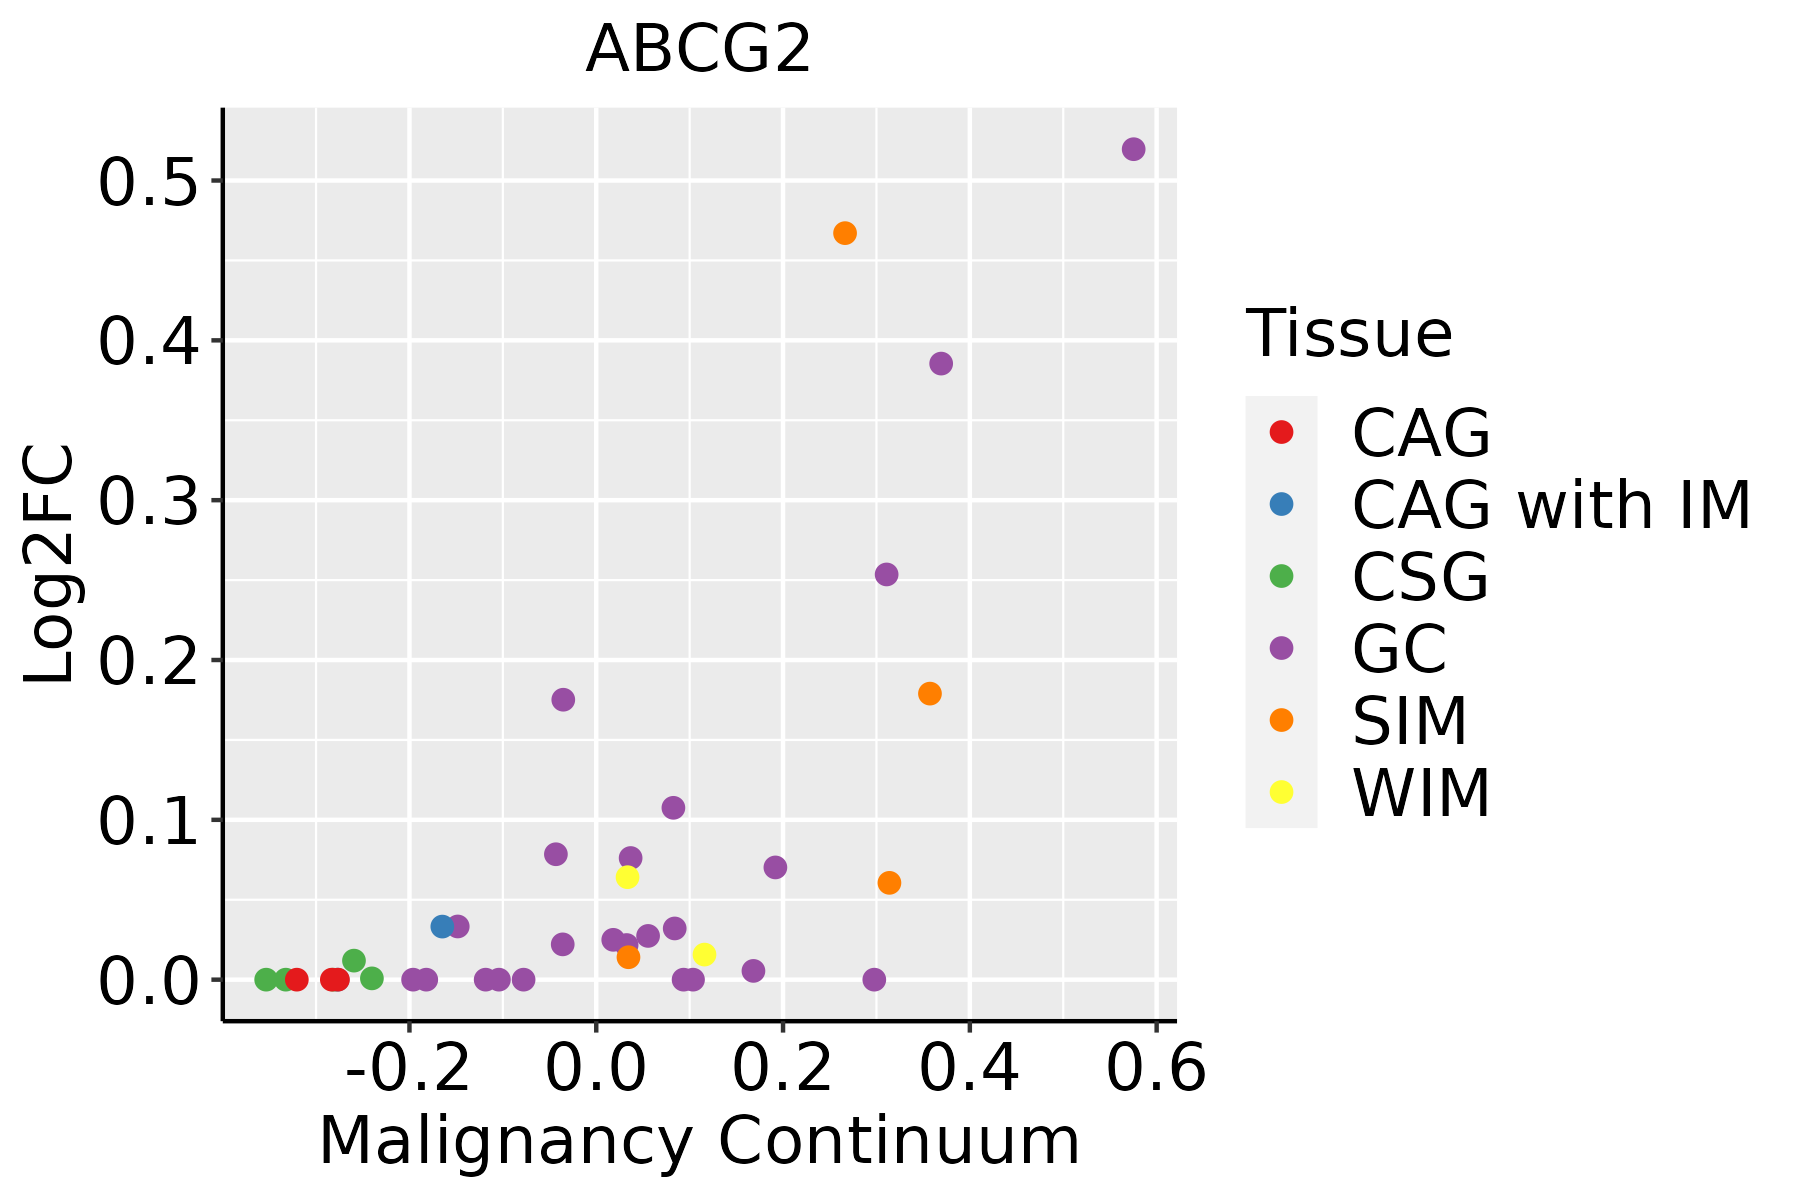 | CAG: Chronic atrophic gastritis |
| CAG with IM: Chronic atrophic gastritis with intestinal metaplasia | ||
| CSG: Chronic superficial gastritis | ||
| GC: Gastric cancer | ||
| SIM: Severe intestinal metaplasia | ||
| WIM: Wild intestinal metaplasia | ||
| Liver | 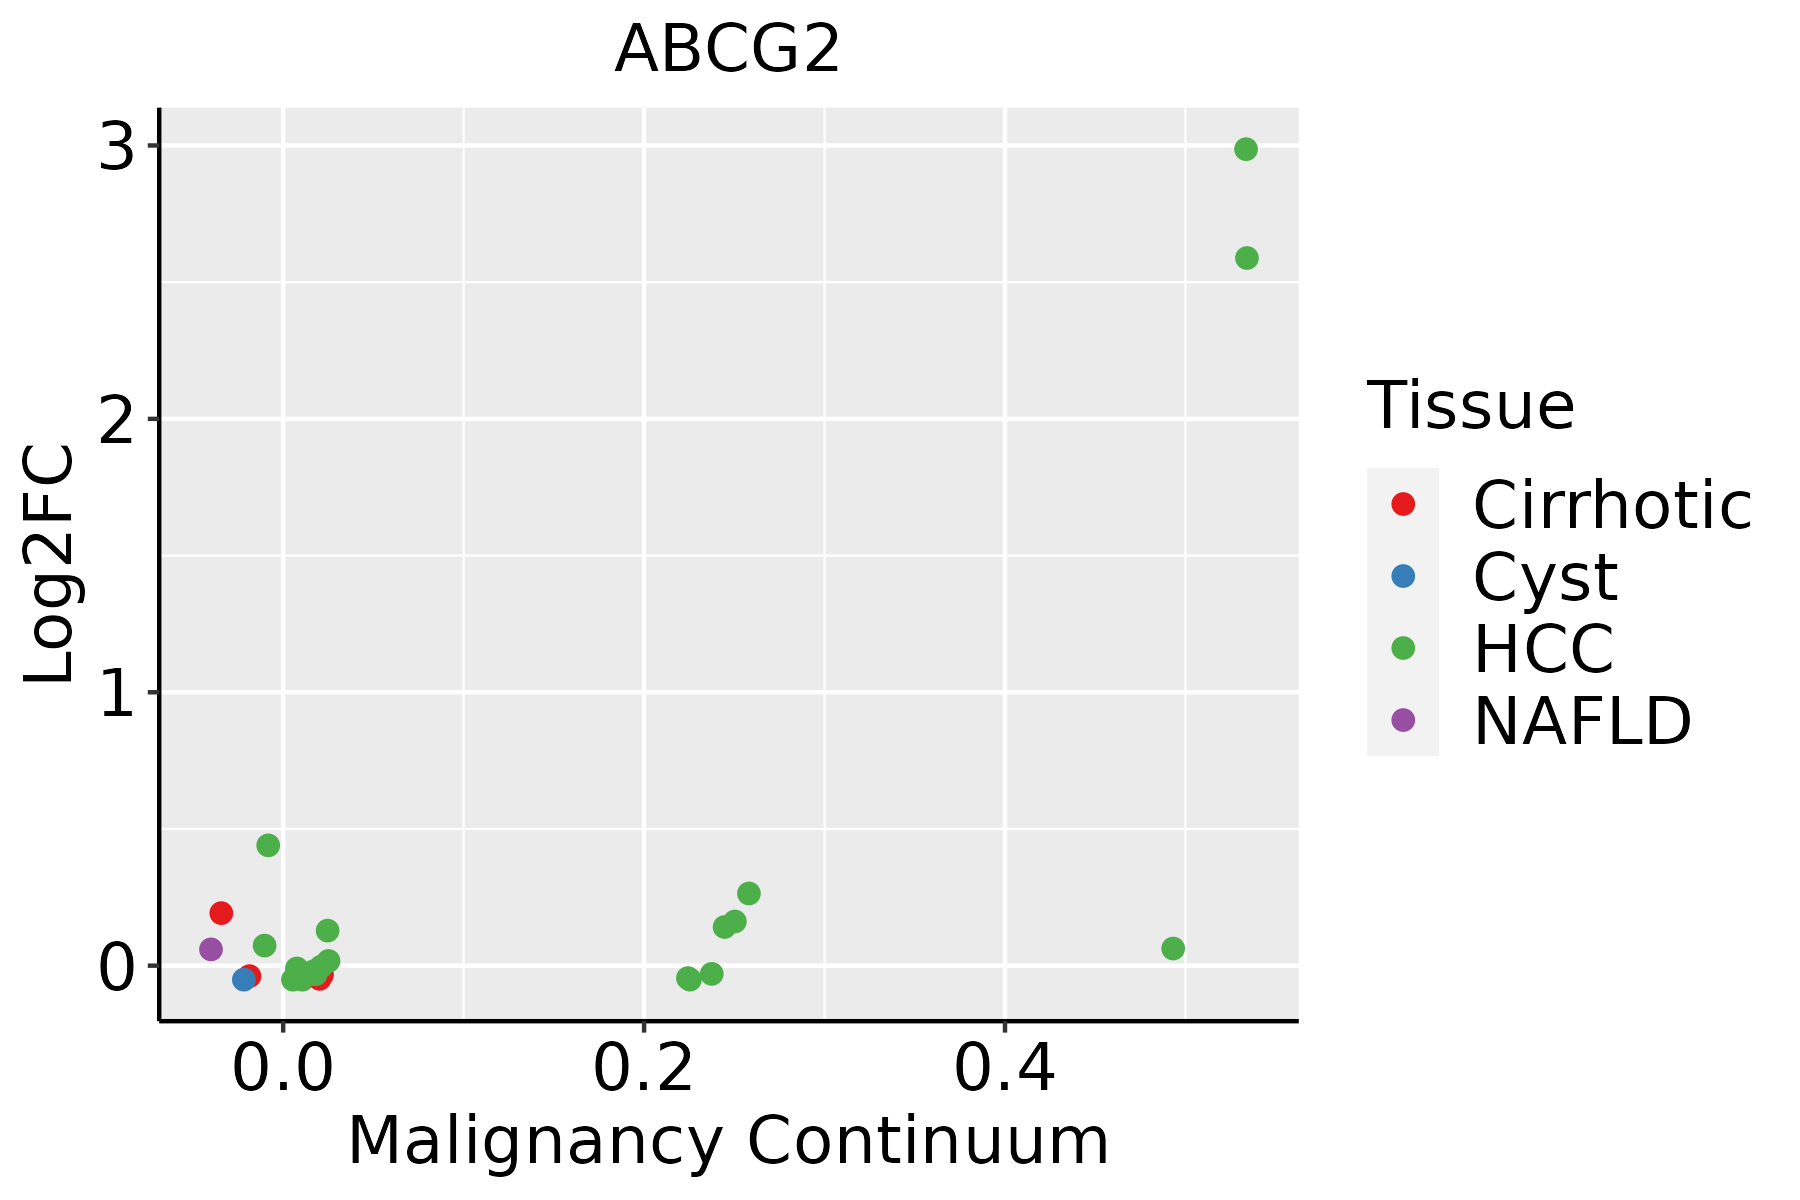 | HCC: Hepatocellular carcinoma |
| NAFLD: Non-alcoholic fatty liver disease |
| ∗log2FC in expression of this searched gene in stem-like cells from each diseased tissue sample relative to stem-like cells in normal samples in each tissue plotted against the malignancy continuum. Samples are colored based on if they are from different disease stage. |
Top |
Malignant transformation related pathway analysis |
| Find out the enriched GO biological processes and KEGG pathways involved in transition from healthy to precancer to cancer |
| Tissue | Disease Stage | Enriched GO biological Processes |
| Colorectum | AD |  |
| Colorectum | SER |  |
| Colorectum | MSS |  |
| Colorectum | MSI-H |  |
| Colorectum | FAP |  |
| ∗Top 15 enriched GO BP terms are showed in the bar plot of each disease state in each tissue. Each row represents a significant GO biological process which is colored according to the -log10(p.adjust). |
| Page: 1 2 3 4 5 6 7 8 9 |
| GO ID | Tissue | Disease Stage | Description | Gene Ratio | Bg Ratio | pvalue | p.adjust | Count |
| GO:00096362 | Colorectum | MSS | response to toxic substance | 73/3467 | 262/18723 | 1.26e-04 | 1.94e-03 | 73 |
| GO:00972372 | Colorectum | MSS | cellular response to toxic substance | 37/3467 | 124/18723 | 1.47e-03 | 1.36e-02 | 37 |
| GO:0150104 | Colorectum | MSS | transport across blood-brain barrier | 28/3467 | 87/18723 | 1.54e-03 | 1.41e-02 | 28 |
| GO:0010232 | Colorectum | MSS | vascular transport | 28/3467 | 88/18723 | 1.87e-03 | 1.64e-02 | 28 |
| GO:0070633 | Colorectum | MSS | transepithelial transport | 13/3467 | 31/18723 | 2.14e-03 | 1.80e-02 | 13 |
| GO:00428861 | Colorectum | MSS | amide transport | 76/3467 | 301/18723 | 2.14e-03 | 1.80e-02 | 76 |
| GO:19907482 | Colorectum | MSS | cellular detoxification | 34/3467 | 116/18723 | 3.08e-03 | 2.34e-02 | 34 |
| GO:00987542 | Colorectum | MSS | detoxification | 41/3467 | 152/18723 | 6.41e-03 | 4.27e-02 | 41 |
| GO:00706331 | Colorectum | FAP | transepithelial transport | 13/2622 | 31/18723 | 1.34e-04 | 2.15e-03 | 13 |
| GO:01501041 | Colorectum | FAP | transport across blood-brain barrier | 25/2622 | 87/18723 | 2.63e-04 | 3.59e-03 | 25 |
| GO:00102321 | Colorectum | FAP | vascular transport | 25/2622 | 88/18723 | 3.19e-04 | 4.12e-03 | 25 |
| GO:0003018 | Colorectum | FAP | vascular process in circulatory system | 56/2622 | 263/18723 | 7.67e-04 | 8.12e-03 | 56 |
| GO:00428862 | Colorectum | FAP | amide transport | 62/2622 | 301/18723 | 1.01e-03 | 9.93e-03 | 62 |
| GO:00096363 | Colorectum | FAP | response to toxic substance | 53/2622 | 262/18723 | 3.35e-03 | 2.46e-02 | 53 |
| GO:000963622 | Liver | HCC | response to toxic substance | 153/7958 | 262/18723 | 1.37e-07 | 2.58e-06 | 153 |
| GO:199074812 | Liver | HCC | cellular detoxification | 70/7958 | 116/18723 | 7.87e-05 | 7.02e-04 | 70 |
| GO:009723712 | Liver | HCC | cellular response to toxic substance | 74/7958 | 124/18723 | 8.36e-05 | 7.36e-04 | 74 |
| GO:009875412 | Liver | HCC | detoxification | 87/7958 | 152/18723 | 1.70e-04 | 1.35e-03 | 87 |
| GO:015010411 | Liver | HCC | transport across blood-brain barrier | 50/7958 | 87/18723 | 3.42e-03 | 1.55e-02 | 50 |
| GO:001023211 | Liver | HCC | vascular transport | 50/7958 | 88/18723 | 4.69e-03 | 2.02e-02 | 50 |
| Page: 1 2 |
| Pathway ID | Tissue | Disease Stage | Description | Gene Ratio | Bg Ratio | pvalue | p.adjust | qvalue | Count |
| hsa04976 | Colorectum | FAP | Bile secretion | 24/1404 | 89/8465 | 8.76e-03 | 3.21e-02 | 1.96e-02 | 24 |
| hsa049761 | Colorectum | FAP | Bile secretion | 24/1404 | 89/8465 | 8.76e-03 | 3.21e-02 | 1.96e-02 | 24 |
| hsa01523 | Liver | HCC | Antifolate resistance | 21/4020 | 30/8465 | 1.06e-02 | 2.71e-02 | 1.51e-02 | 21 |
| hsa020102 | Liver | HCC | ABC transporters | 29/4020 | 45/8465 | 1.62e-02 | 3.88e-02 | 2.16e-02 | 29 |
| hsa015231 | Liver | HCC | Antifolate resistance | 21/4020 | 30/8465 | 1.06e-02 | 2.71e-02 | 1.51e-02 | 21 |
| hsa020103 | Liver | HCC | ABC transporters | 29/4020 | 45/8465 | 1.62e-02 | 3.88e-02 | 2.16e-02 | 29 |
| Page: 1 |
Top |
Cell-cell communication analysis |
| Identification of potential cell-cell interactions between two cell types and their ligand-receptor pairs for different disease states |
| Ligand | Receptor | LRpair | Pathway | Tissue | Disease Stage |
| Page: 1 |
Top |
Single-cell gene regulatory network inference analysis |
| Find out the significant the regulons (TFs) and the target genes of each regulon across cell types for different disease states |
| TF | Cell Type | Tissue | Disease Stage | Target Gene | RSS | Regulon Activity |
| ∗The dot plots of a searched regulon are shown for all cell subpopulations in each disease state of each tissue based on the regulon specific score inferred using pySCENIC and by calculating the average expression. |
| Page: 1 |
Top |
Somatic mutation of malignant transformation related genes |
| Annotation of somatic variants for genes involved in malignant transformation |
| Hugo Symbol | Variant Class | Variant Classification | dbSNP RS | HGVSc | HGVSp | HGVSp Short | SWISSPROT | BIOTYPE | SIFT | PolyPhen | Tumor Sample Barcode | Tissue | Histology | Sex | Age | Stage | Therapy Types | Drugs | Outcome |
| ABCG2 | SNV | Missense_Mutation | rs529212191 | c.1542N>A | p.Met514Ile | p.M514I | Q9UNQ0 | protein_coding | tolerated(0.38) | benign(0.013) | TCGA-5L-AAT1-01 | Breast | breast invasive carcinoma | Female | <65 | III/IV | Hormone Therapy | letrozol | SD |
| ABCG2 | SNV | Missense_Mutation | c.624N>A | p.Phe208Leu | p.F208L | Q9UNQ0 | protein_coding | deleterious(0) | probably_damaging(1) | TCGA-B6-A0X5-01 | Breast | breast invasive carcinoma | Female | <65 | I/II | Unknown | Unknown | PD | |
| ABCG2 | deletion | Frame_Shift_Del | novel | c.831delN | p.Phe277LeufsTer31 | p.F277Lfs*31 | Q9UNQ0 | protein_coding | TCGA-D8-A27V-01 | Breast | breast invasive carcinoma | Female | <65 | I/II | Hormone Therapy | tamoxiphen | SD | ||
| ABCG2 | SNV | Missense_Mutation | novel | c.661N>A | p.Ala221Thr | p.A221T | Q9UNQ0 | protein_coding | tolerated(0.16) | possibly_damaging(0.751) | TCGA-EA-A3HS-01 | Cervix | cervical & endocervical cancer | Female | <65 | I/II | Unknown | Unknown | SD |
| ABCG2 | SNV | Missense_Mutation | c.1921C>T | p.Leu641Phe | p.L641F | Q9UNQ0 | protein_coding | tolerated(0.13) | benign(0.32) | TCGA-EK-A2RN-01 | Cervix | cervical & endocervical cancer | Female | <65 | I/II | Unknown | Unknown | SD | |
| ABCG2 | SNV | Missense_Mutation | c.412N>C | p.Glu138Gln | p.E138Q | Q9UNQ0 | protein_coding | deleterious(0.03) | probably_damaging(0.941) | TCGA-EK-A3GK-01 | Cervix | cervical & endocervical cancer | Female | <65 | I/II | Unknown | Unknown | SD | |
| ABCG2 | SNV | Missense_Mutation | c.1000G>A | p.Glu334Lys | p.E334K | Q9UNQ0 | protein_coding | tolerated(0.11) | benign(0.015) | TCGA-PN-A8MA-01 | Cervix | cervical & endocervical cancer | Female | <65 | I/II | Chemotherapy | cisplatin | SD | |
| ABCG2 | SNV | Missense_Mutation | c.1382N>T | p.Ser461Ile | p.S461I | Q9UNQ0 | protein_coding | deleterious(0) | probably_damaging(0.976) | TCGA-AA-3977-01 | Colorectum | colon adenocarcinoma | Male | >=65 | I/II | Unknown | Unknown | SD | |
| ABCG2 | SNV | Missense_Mutation | rs747453638 | c.21N>C | p.Glu7Asp | p.E7D | Q9UNQ0 | protein_coding | tolerated(0.28) | benign(0.013) | TCGA-AA-3977-01 | Colorectum | colon adenocarcinoma | Male | >=65 | I/II | Unknown | Unknown | SD |
| ABCG2 | SNV | Missense_Mutation | rs372911459 | c.1957N>G | p.Lys653Glu | p.K653E | Q9UNQ0 | protein_coding | deleterious(0) | probably_damaging(0.999) | TCGA-AA-A010-01 | Colorectum | colon adenocarcinoma | Female | <65 | I/II | Chemotherapy | folinic | CR |
| Page: 1 2 3 4 5 6 7 8 9 10 |
Top |
Related drugs of malignant transformation related genes |
| Identification of chemicals and drugs interact with genes involved in malignant transfromation |
| (DGIdb 4.0) |
| Entrez ID | Symbol | Category | Interaction Types | Drug Claim Name | Drug Name | PMIDs |
| 9429 | ABCG2 | TRANSPORTER, ABC TRANSPORTER, DRUGGABLE GENOME | ITRACONAZOLE | ITRACONAZOLE | 17518356 | |
| 9429 | ABCG2 | TRANSPORTER, ABC TRANSPORTER, DRUGGABLE GENOME | OSI-774 | ERLOTINIB | 18723475 | |
| 9429 | ABCG2 | TRANSPORTER, ABC TRANSPORTER, DRUGGABLE GENOME | rhodamine 123 | 11559526 | ||
| 9429 | ABCG2 | TRANSPORTER, ABC TRANSPORTER, DRUGGABLE GENOME | FOLIC ACID | 15047700 | ||
| 9429 | ABCG2 | TRANSPORTER, ABC TRANSPORTER, DRUGGABLE GENOME | TARIQUIDAR | TARIQUIDAR | 20621487 | |
| 9429 | ABCG2 | TRANSPORTER, ABC TRANSPORTER, DRUGGABLE GENOME | Platinum compounds | 19525887 | ||
| 9429 | ABCG2 | TRANSPORTER, ABC TRANSPORTER, DRUGGABLE GENOME | FLAVOPIRIDOL | ALVOCIDIB | 11205902 | |
| 9429 | ABCG2 | TRANSPORTER, ABC TRANSPORTER, DRUGGABLE GENOME | HUMAN CHORIONIC GONADOTROPIN | 17823853 | ||
| 9429 | ABCG2 | TRANSPORTER, ABC TRANSPORTER, DRUGGABLE GENOME | ETRAVIRINE | ETRAVIRINE | 21189339 | |
| 9429 | ABCG2 | TRANSPORTER, ABC TRANSPORTER, DRUGGABLE GENOME | zidovudine | ZIDOVUDINE | 22960662 |
| Page: 1 2 3 4 5 6 7 8 9 |

Copyright 2023-Present -The University of Texas Health Science Center at Houston |