
|
|||||
|
 | |
| |
| |
| |
| |
| |
|
Gene: ABCG1 |
Gene summary for ABCG1 |
| Gene information | Species | Human | Gene symbol | ABCG1 | Gene ID | 9619 |
| Gene name | ATP binding cassette subfamily G member 1 | |
| Gene Alias | ABC8 | |
| Cytomap | 21q22.3 | |
| Gene Type | protein-coding | GO ID | GO:0001678 | UniProtAcc | P45844 |
Top |
Malignant transformation analysis |
| Identification of the aberrant gene expression in precancerous and cancerous lesions by comparing the gene expression of stem-like cells in diseased tissues with normal stem cells |
| Entrez ID | Symbol | Replicates | Species | Organ | Tissue | Adj P-value | Log2FC | Malignancy |
| 9619 | ABCG1 | LZE20T | Human | Esophagus | ESCC | 1.08e-04 | 1.90e-01 | 0.0662 |
| 9619 | ABCG1 | LZE24T | Human | Esophagus | ESCC | 3.43e-14 | 3.80e-01 | 0.0596 |
| 9619 | ABCG1 | LZE21T | Human | Esophagus | ESCC | 3.96e-05 | 2.71e-01 | 0.0655 |
| 9619 | ABCG1 | P1T-E | Human | Esophagus | ESCC | 1.01e-08 | 5.12e-01 | 0.0875 |
| 9619 | ABCG1 | P2T-E | Human | Esophagus | ESCC | 7.88e-07 | 1.63e-01 | 0.1177 |
| 9619 | ABCG1 | P5T-E | Human | Esophagus | ESCC | 4.86e-19 | 2.82e-01 | 0.1327 |
| 9619 | ABCG1 | P8T-E | Human | Esophagus | ESCC | 8.58e-14 | 2.56e-01 | 0.0889 |
| 9619 | ABCG1 | P9T-E | Human | Esophagus | ESCC | 1.05e-08 | 1.67e-01 | 0.1131 |
| 9619 | ABCG1 | P10T-E | Human | Esophagus | ESCC | 4.03e-15 | 3.61e-01 | 0.116 |
| 9619 | ABCG1 | P11T-E | Human | Esophagus | ESCC | 2.17e-06 | 3.60e-01 | 0.1426 |
| 9619 | ABCG1 | P12T-E | Human | Esophagus | ESCC | 9.15e-23 | 5.08e-01 | 0.1122 |
| 9619 | ABCG1 | P15T-E | Human | Esophagus | ESCC | 1.19e-20 | 4.57e-01 | 0.1149 |
| 9619 | ABCG1 | P16T-E | Human | Esophagus | ESCC | 2.13e-09 | 2.81e-01 | 0.1153 |
| 9619 | ABCG1 | P21T-E | Human | Esophagus | ESCC | 4.52e-21 | 3.86e-01 | 0.1617 |
| 9619 | ABCG1 | P23T-E | Human | Esophagus | ESCC | 2.09e-22 | 4.74e-01 | 0.108 |
| 9619 | ABCG1 | P24T-E | Human | Esophagus | ESCC | 3.71e-02 | 5.64e-02 | 0.1287 |
| 9619 | ABCG1 | P26T-E | Human | Esophagus | ESCC | 4.11e-45 | 9.04e-01 | 0.1276 |
| 9619 | ABCG1 | P27T-E | Human | Esophagus | ESCC | 7.83e-15 | 2.14e-01 | 0.1055 |
| 9619 | ABCG1 | P28T-E | Human | Esophagus | ESCC | 1.96e-18 | 4.39e-01 | 0.1149 |
| 9619 | ABCG1 | P30T-E | Human | Esophagus | ESCC | 7.38e-13 | 6.12e-01 | 0.137 |
| Page: 1 2 3 4 |
| Tissue | Expression Dynamics | Abbreviation |
| Esophagus | 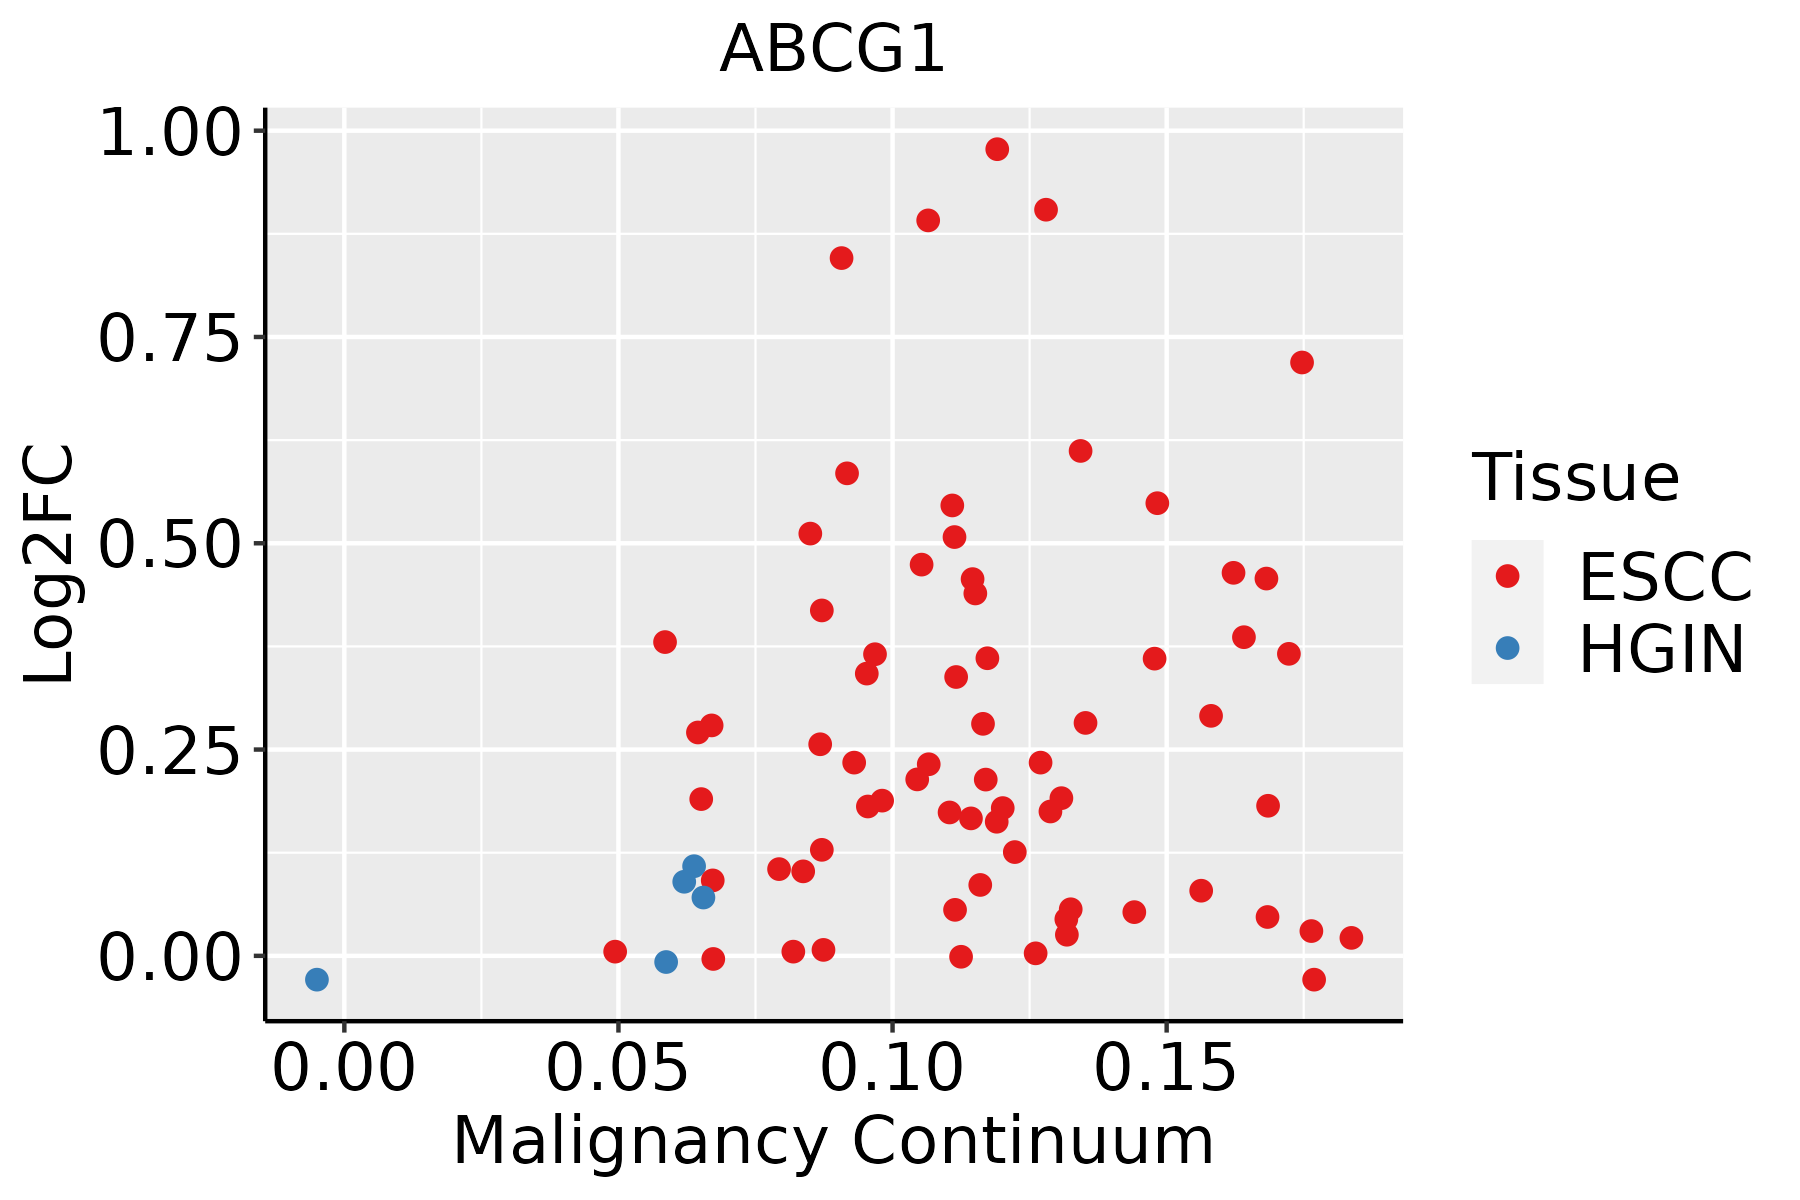 | ESCC: Esophageal squamous cell carcinoma |
| HGIN: High-grade intraepithelial neoplasias | ||
| LGIN: Low-grade intraepithelial neoplasias | ||
| Oral Cavity |  | EOLP: Erosive Oral lichen planus |
| LP: leukoplakia | ||
| NEOLP: Non-erosive oral lichen planus | ||
| OSCC: Oral squamous cell carcinoma | ||
| Thyroid | 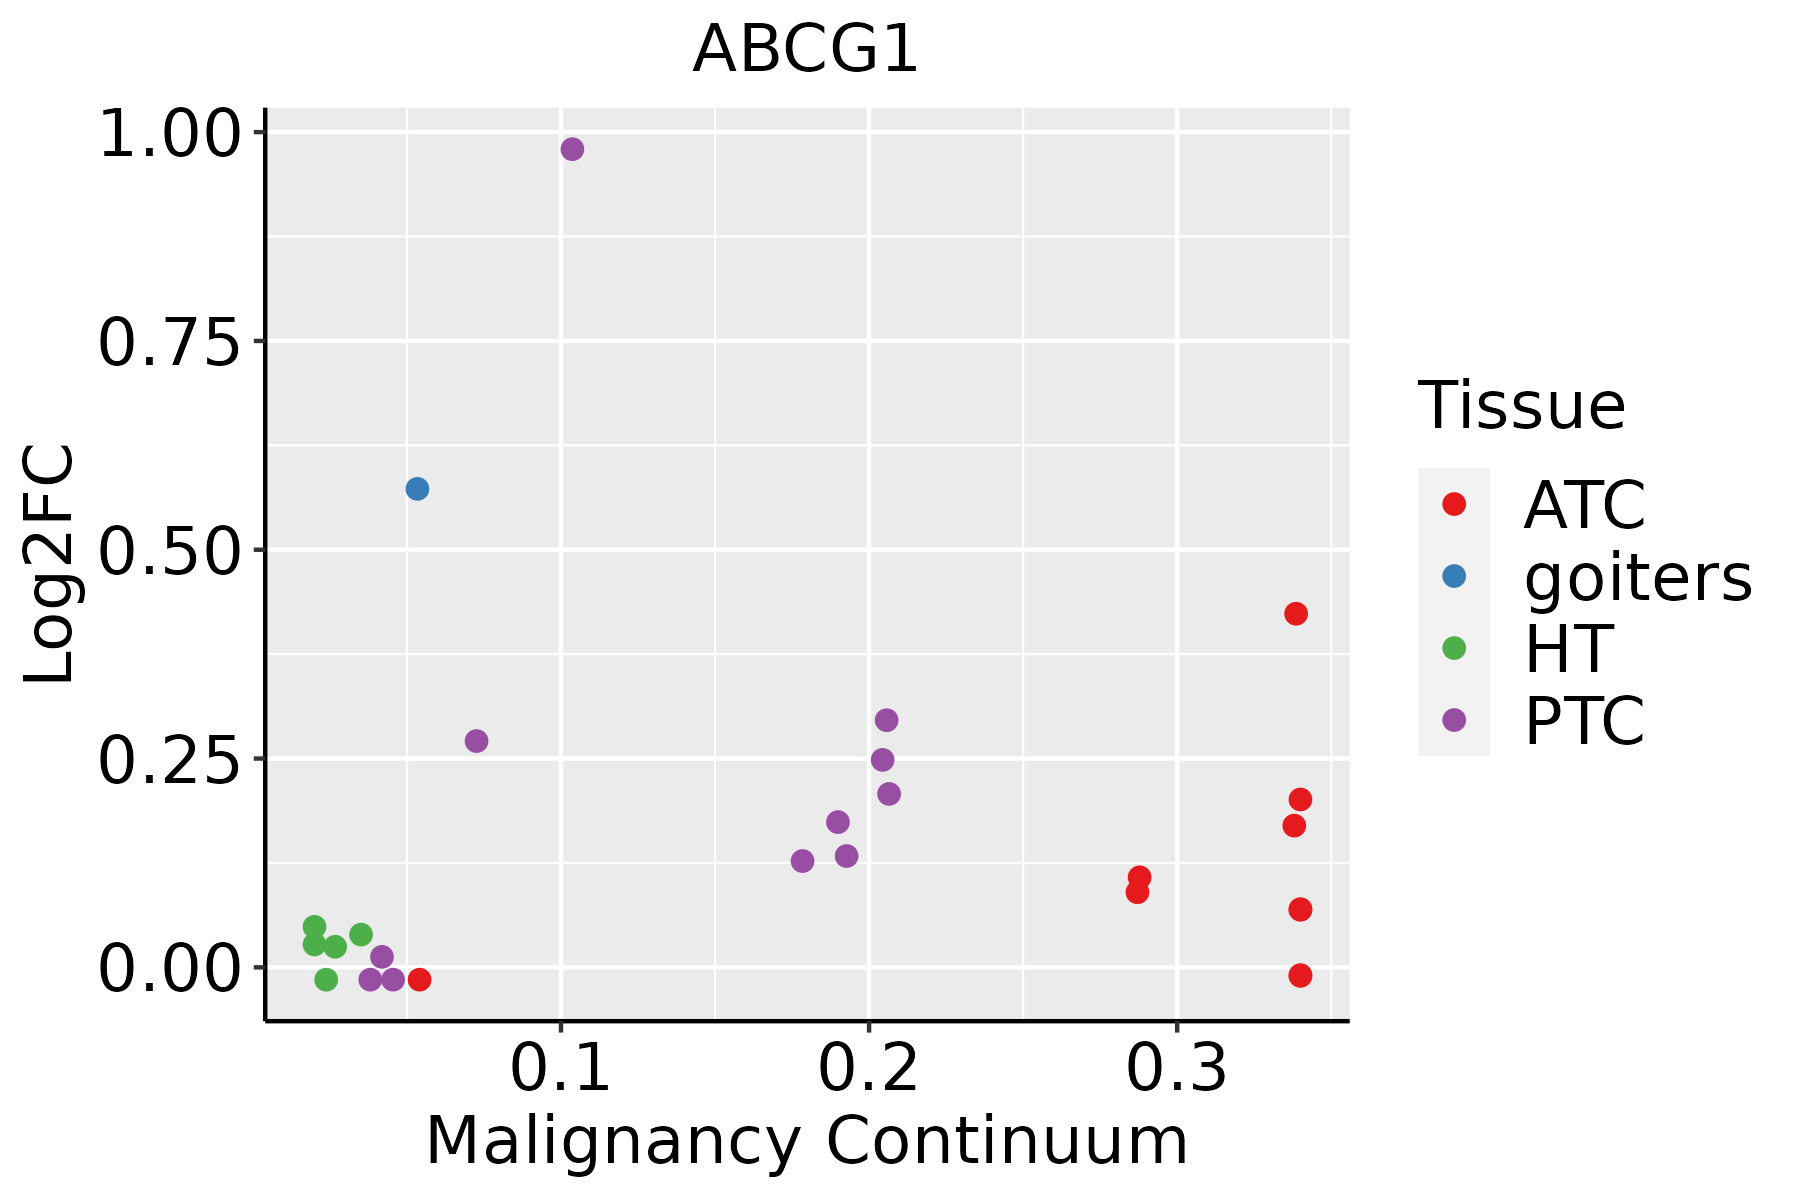 | ATC: Anaplastic thyroid cancer |
| HT: Hashimoto's thyroiditis | ||
| PTC: Papillary thyroid cancer |
| ∗log2FC in expression of this searched gene in stem-like cells from each diseased tissue sample relative to stem-like cells in normal samples in each tissue plotted against the malignancy continuum. Samples are colored based on if they are from different disease stage. |
Top |
Malignant transformation related pathway analysis |
| Find out the enriched GO biological processes and KEGG pathways involved in transition from healthy to precancer to cancer |
| Tissue | Disease Stage | Enriched GO biological Processes |
| Colorectum | AD |  |
| Colorectum | SER |  |
| Colorectum | MSS |  |
| Colorectum | MSI-H |  |
| Colorectum | FAP |  |
| ∗Top 15 enriched GO BP terms are showed in the bar plot of each disease state in each tissue. Each row represents a significant GO biological process which is colored according to the -log10(p.adjust). |
| Page: 1 2 3 4 5 6 7 8 9 |
| GO ID | Tissue | Disease Stage | Description | Gene Ratio | Bg Ratio | pvalue | p.adjust | Count |
| GO:001605014 | Esophagus | ESCC | vesicle organization | 211/8552 | 300/18723 | 2.85e-18 | 2.87e-16 | 211 |
| GO:1904951111 | Esophagus | ESCC | positive regulation of establishment of protein localization | 216/8552 | 319/18723 | 1.01e-15 | 6.86e-14 | 216 |
| GO:0034250111 | Esophagus | ESCC | positive regulation of cellular amide metabolic process | 123/8552 | 162/18723 | 3.32e-15 | 1.93e-13 | 123 |
| GO:0051222111 | Esophagus | ESCC | positive regulation of protein transport | 204/8552 | 303/18723 | 1.56e-14 | 8.38e-13 | 204 |
| GO:0051235110 | Esophagus | ESCC | maintenance of location | 200/8552 | 327/18723 | 1.01e-08 | 2.02e-07 | 200 |
| GO:00060668 | Esophagus | ESCC | alcohol metabolic process | 202/8552 | 353/18723 | 7.32e-06 | 7.26e-05 | 202 |
| GO:00161263 | Esophagus | ESCC | sterol biosynthetic process | 46/8552 | 64/18723 | 1.91e-05 | 1.67e-04 | 46 |
| GO:00066953 | Esophagus | ESCC | cholesterol biosynthetic process | 41/8552 | 57/18723 | 5.25e-05 | 4.06e-04 | 41 |
| GO:19026533 | Esophagus | ESCC | secondary alcohol biosynthetic process | 41/8552 | 57/18723 | 5.25e-05 | 4.06e-04 | 41 |
| GO:00199155 | Esophagus | ESCC | lipid storage | 58/8552 | 87/18723 | 6.15e-05 | 4.72e-04 | 58 |
| GO:00620129 | Esophagus | ESCC | regulation of small molecule metabolic process | 184/8552 | 334/18723 | 3.11e-04 | 1.85e-03 | 184 |
| GO:19026524 | Esophagus | ESCC | secondary alcohol metabolic process | 87/8552 | 147/18723 | 6.58e-04 | 3.50e-03 | 87 |
| GO:00461653 | Esophagus | ESCC | alcohol biosynthetic process | 83/8552 | 140/18723 | 8.04e-04 | 4.16e-03 | 83 |
| GO:00108884 | Esophagus | ESCC | negative regulation of lipid storage | 18/8552 | 23/18723 | 1.50e-03 | 7.06e-03 | 18 |
| GO:19019987 | Esophagus | ESCC | toxin transport | 28/8552 | 40/18723 | 1.61e-03 | 7.50e-03 | 28 |
| GO:00066946 | Esophagus | ESCC | steroid biosynthetic process | 98/8552 | 173/18723 | 2.34e-03 | 1.03e-02 | 98 |
| GO:00082034 | Esophagus | ESCC | cholesterol metabolic process | 79/8552 | 137/18723 | 3.11e-03 | 1.29e-02 | 79 |
| GO:000930617 | Esophagus | ESCC | protein secretion | 190/8552 | 359/18723 | 3.22e-03 | 1.34e-02 | 190 |
| GO:003559217 | Esophagus | ESCC | establishment of protein localization to extracellular region | 190/8552 | 360/18723 | 3.77e-03 | 1.53e-02 | 190 |
| GO:00161254 | Esophagus | ESCC | sterol metabolic process | 86/8552 | 152/18723 | 4.37e-03 | 1.73e-02 | 86 |
| Page: 1 2 3 4 5 6 7 8 9 |
| Pathway ID | Tissue | Disease Stage | Description | Gene Ratio | Bg Ratio | pvalue | p.adjust | qvalue | Count |
| hsa05417211 | Esophagus | ESCC | Lipid and atherosclerosis | 143/4205 | 215/8465 | 3.30e-07 | 2.45e-06 | 1.26e-06 | 143 |
| hsa05417310 | Esophagus | ESCC | Lipid and atherosclerosis | 143/4205 | 215/8465 | 3.30e-07 | 2.45e-06 | 1.26e-06 | 143 |
| Page: 1 |
Top |
Cell-cell communication analysis |
| Identification of potential cell-cell interactions between two cell types and their ligand-receptor pairs for different disease states |
| Ligand | Receptor | LRpair | Pathway | Tissue | Disease Stage |
| Page: 1 |
Top |
Single-cell gene regulatory network inference analysis |
| Find out the significant the regulons (TFs) and the target genes of each regulon across cell types for different disease states |
| TF | Cell Type | Tissue | Disease Stage | Target Gene | RSS | Regulon Activity |
| ∗The dot plots of a searched regulon are shown for all cell subpopulations in each disease state of each tissue based on the regulon specific score inferred using pySCENIC and by calculating the average expression. |
| Page: 1 |
Top |
Somatic mutation of malignant transformation related genes |
| Annotation of somatic variants for genes involved in malignant transformation |
| Hugo Symbol | Variant Class | Variant Classification | dbSNP RS | HGVSc | HGVSp | HGVSp Short | SWISSPROT | BIOTYPE | SIFT | PolyPhen | Tumor Sample Barcode | Tissue | Histology | Sex | Age | Stage | Therapy Types | Drugs | Outcome |
| ABCG1 | SNV | Missense_Mutation | rs766235564 | c.137C>T | p.Thr46Met | p.T46M | P45844 | protein_coding | tolerated(0.06) | benign(0.201) | TCGA-A2-A0EU-01 | Breast | breast invasive carcinoma | Female | >=65 | I/II | Unknown | Unknown | SD |
| ABCG1 | SNV | Missense_Mutation | c.536T>A | p.Met179Lys | p.M179K | P45844 | protein_coding | tolerated(0.1) | benign(0.168) | TCGA-BH-A0H6-01 | Breast | breast invasive carcinoma | Female | >=65 | I/II | Unknown | Unknown | SD | |
| ABCG1 | SNV | Missense_Mutation | novel | c.392N>A | p.Leu131Gln | p.L131Q | P45844 | protein_coding | deleterious(0) | probably_damaging(1) | TCGA-E2-A576-01 | Breast | breast invasive carcinoma | Female | >=65 | I/II | Chemotherapy | taxotere | SD |
| ABCG1 | SNV | Missense_Mutation | c.1785N>C | p.Trp595Cys | p.W595C | P45844 | protein_coding | deleterious(0) | probably_damaging(1) | TCGA-GM-A2DH-01 | Breast | breast invasive carcinoma | Female | <65 | I/II | Chemotherapy | taxol | CR | |
| ABCG1 | deletion | Frame_Shift_Del | novel | c.188delN | p.Gln64SerfsTer12 | p.Q64Sfs*12 | P45844 | protein_coding | TCGA-EW-A2FV-01 | Breast | breast invasive carcinoma | Female | <65 | III/IV | Chemotherapy | docetaxel | SD | ||
| ABCG1 | SNV | Missense_Mutation | c.83N>T | p.Ser28Leu | p.S28L | P45844 | protein_coding | tolerated_low_confidence(0.1) | benign(0.086) | TCGA-2W-A8YY-01 | Cervix | cervical & endocervical cancer | Female | <65 | I/II | Chemotherapy | cisplatin | CR | |
| ABCG1 | SNV | Missense_Mutation | novel | c.608N>A | p.Ala203Glu | p.A203E | P45844 | protein_coding | tolerated(0.07) | possibly_damaging(0.877) | TCGA-C5-A1MF-01 | Cervix | cervical & endocervical cancer | Female | <65 | I/II | Unknown | Unknown | SD |
| ABCG1 | SNV | Missense_Mutation | c.688G>C | p.Glu230Gln | p.E230Q | P45844 | protein_coding | deleterious(0) | probably_damaging(0.962) | TCGA-IR-A3LK-01 | Cervix | cervical & endocervical cancer | Female | >=65 | I/II | Chemotherapy | cisplatin | PD | |
| ABCG1 | SNV | Missense_Mutation | rs781438237 | c.1084N>A | p.Glu362Lys | p.E362K | P45844 | protein_coding | tolerated(0.51) | benign(0) | TCGA-VS-A9V3-01 | Cervix | cervical & endocervical cancer | Female | <65 | I/II | Chemotherapy | cisplatin | PD |
| ABCG1 | SNV | Missense_Mutation | c.979G>A | p.Glu327Lys | p.E327K | P45844 | protein_coding | deleterious(0) | possibly_damaging(0.858) | TCGA-A6-2671-01 | Colorectum | colon adenocarcinoma | Male | >=65 | III/IV | Other, specify in notesProtocol AMG 20060464 | study | PD |
| Page: 1 2 3 4 5 6 7 8 |
Top |
Related drugs of malignant transformation related genes |
| Identification of chemicals and drugs interact with genes involved in malignant transfromation |
| (DGIdb 4.0) |
| Entrez ID | Symbol | Category | Interaction Types | Drug Claim Name | Drug Name | PMIDs |
| 9619 | ABCG1 | TRANSPORTER, EXTERNAL SIDE OF PLASMA MEMBRANE, DRUGGABLE GENOME | leucovorin | LEUCOVORIN | 26352872 | |
| 9619 | ABCG1 | TRANSPORTER, EXTERNAL SIDE OF PLASMA MEMBRANE, DRUGGABLE GENOME | irinotecan | IRINOTECAN | 26352872 | |
| 9619 | ABCG1 | TRANSPORTER, EXTERNAL SIDE OF PLASMA MEMBRANE, DRUGGABLE GENOME | fluorouracil | FLUOROURACIL | 26352872 |
| Page: 1 |

Copyright 2023-Present -The University of Texas Health Science Center at Houston |