
|
|||||
|
 | |
| |
| |
| |
| |
| |
|
Gene: ABCF2 |
Gene summary for ABCF2 |
| Gene information | Species | Human | Gene symbol | ABCF2 | Gene ID | 10061 |
| Gene name | ATP binding cassette subfamily F member 2 | |
| Gene Alias | ABC28 | |
| Cytomap | 7q36.1 | |
| Gene Type | protein-coding | GO ID | GO:0005575 | UniProtAcc | A0A090N7X1 |
Top |
Malignant transformation analysis |
| Identification of the aberrant gene expression in precancerous and cancerous lesions by comparing the gene expression of stem-like cells in diseased tissues with normal stem cells |
| Entrez ID | Symbol | Replicates | Species | Organ | Tissue | Adj P-value | Log2FC | Malignancy |
| 10061 | ABCF2 | LZE4T | Human | Esophagus | ESCC | 2.07e-06 | 1.51e-01 | 0.0811 |
| 10061 | ABCF2 | LZE7T | Human | Esophagus | ESCC | 5.78e-08 | 2.60e-01 | 0.0667 |
| 10061 | ABCF2 | LZE8T | Human | Esophagus | ESCC | 3.46e-12 | 2.47e-01 | 0.067 |
| 10061 | ABCF2 | LZE20T | Human | Esophagus | ESCC | 3.36e-05 | 1.28e-01 | 0.0662 |
| 10061 | ABCF2 | LZE22T | Human | Esophagus | ESCC | 6.59e-03 | 3.75e-01 | 0.068 |
| 10061 | ABCF2 | LZE24T | Human | Esophagus | ESCC | 2.58e-12 | 2.95e-01 | 0.0596 |
| 10061 | ABCF2 | LZE21T | Human | Esophagus | ESCC | 6.95e-03 | 2.31e-01 | 0.0655 |
| 10061 | ABCF2 | LZE6T | Human | Esophagus | ESCC | 8.28e-07 | 2.92e-01 | 0.0845 |
| 10061 | ABCF2 | P1T-E | Human | Esophagus | ESCC | 4.32e-06 | 1.69e-01 | 0.0875 |
| 10061 | ABCF2 | P2T-E | Human | Esophagus | ESCC | 7.49e-24 | 2.03e-01 | 0.1177 |
| 10061 | ABCF2 | P4T-E | Human | Esophagus | ESCC | 4.32e-15 | 3.69e-01 | 0.1323 |
| 10061 | ABCF2 | P5T-E | Human | Esophagus | ESCC | 2.09e-22 | 5.03e-01 | 0.1327 |
| 10061 | ABCF2 | P8T-E | Human | Esophagus | ESCC | 1.55e-07 | 1.66e-01 | 0.0889 |
| 10061 | ABCF2 | P9T-E | Human | Esophagus | ESCC | 6.50e-12 | 2.71e-01 | 0.1131 |
| 10061 | ABCF2 | P10T-E | Human | Esophagus | ESCC | 7.62e-23 | 3.61e-01 | 0.116 |
| 10061 | ABCF2 | P11T-E | Human | Esophagus | ESCC | 7.27e-10 | 3.25e-01 | 0.1426 |
| 10061 | ABCF2 | P12T-E | Human | Esophagus | ESCC | 2.85e-31 | 6.35e-01 | 0.1122 |
| 10061 | ABCF2 | P15T-E | Human | Esophagus | ESCC | 2.21e-39 | 7.58e-01 | 0.1149 |
| 10061 | ABCF2 | P16T-E | Human | Esophagus | ESCC | 3.41e-16 | 3.93e-01 | 0.1153 |
| 10061 | ABCF2 | P17T-E | Human | Esophagus | ESCC | 3.51e-08 | 3.92e-01 | 0.1278 |
| Page: 1 2 3 4 5 |
| Tissue | Expression Dynamics | Abbreviation |
| Esophagus |  | ESCC: Esophageal squamous cell carcinoma |
| HGIN: High-grade intraepithelial neoplasias | ||
| LGIN: Low-grade intraepithelial neoplasias | ||
| Liver | 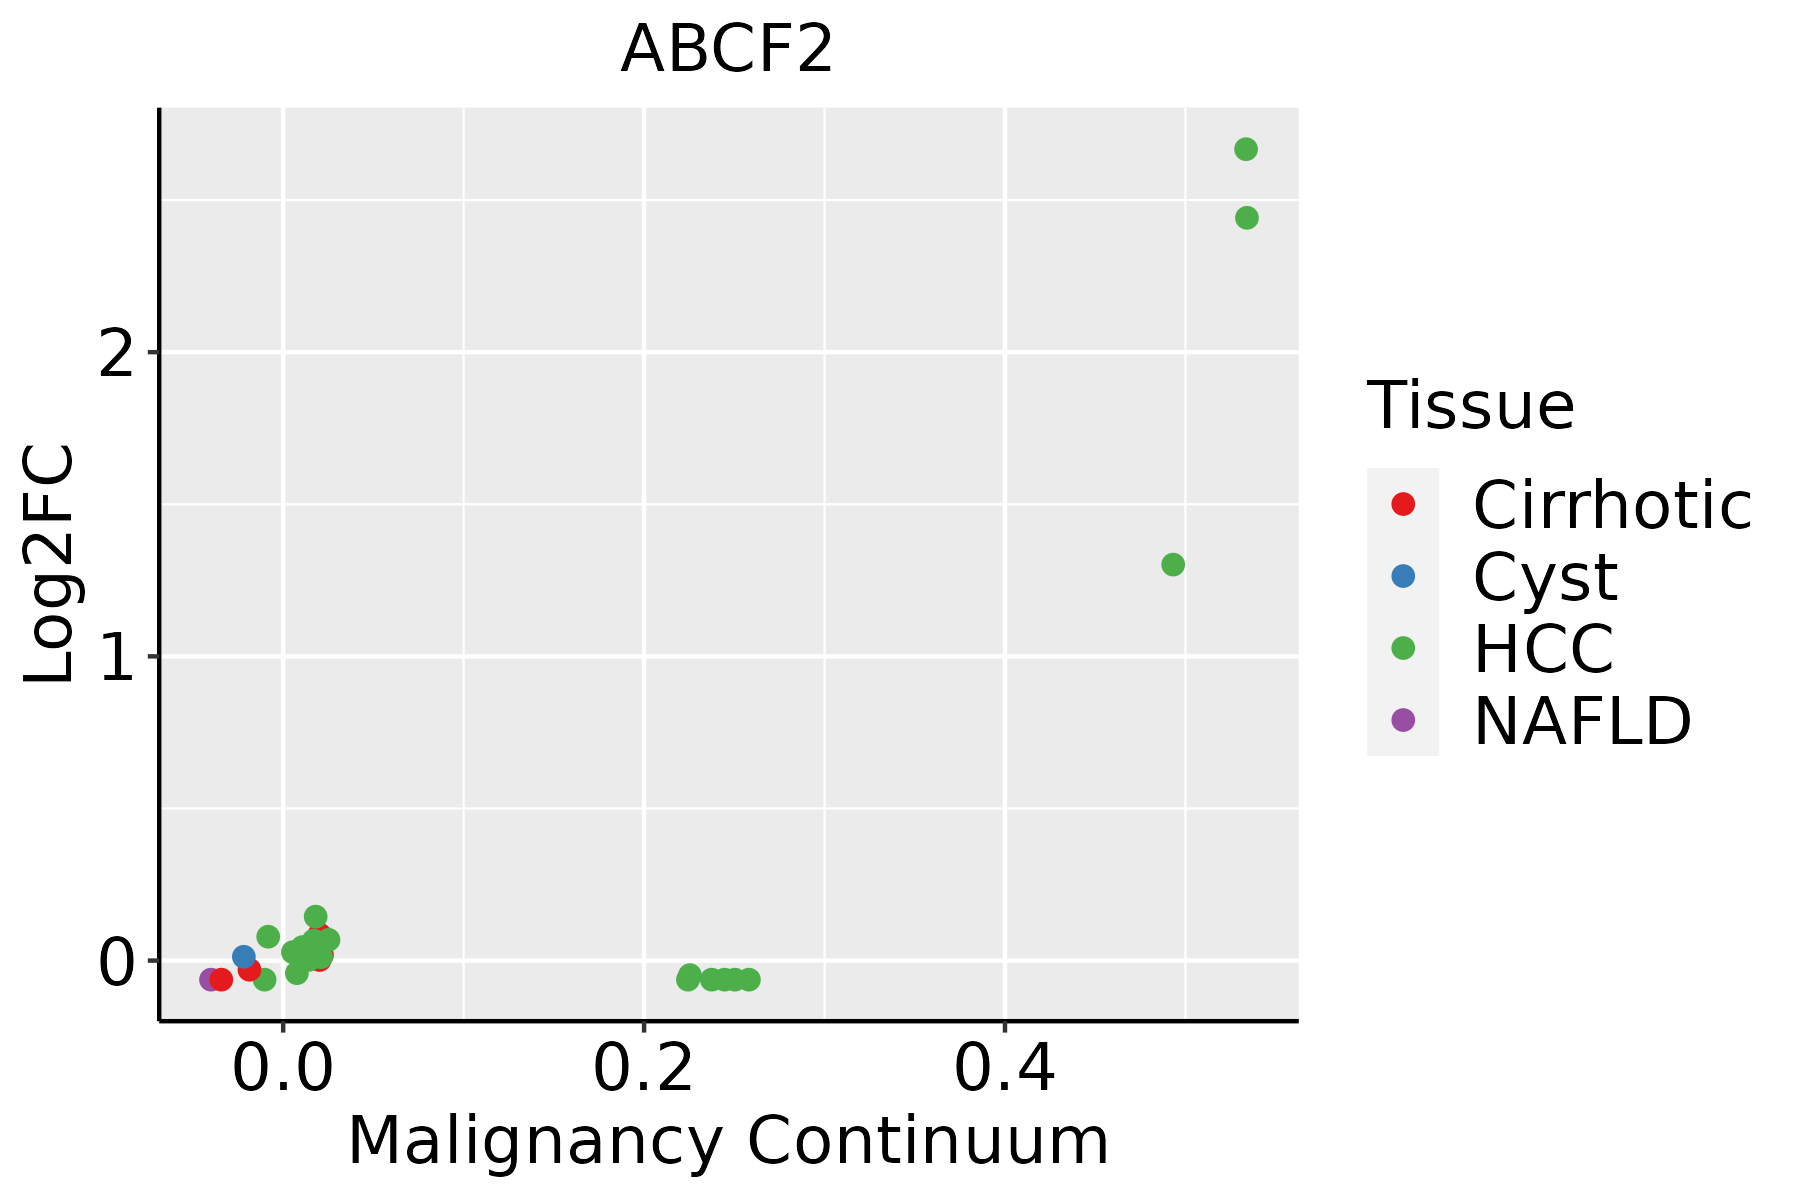 | HCC: Hepatocellular carcinoma |
| NAFLD: Non-alcoholic fatty liver disease | ||
| Oral Cavity |  | EOLP: Erosive Oral lichen planus |
| LP: leukoplakia | ||
| NEOLP: Non-erosive oral lichen planus | ||
| OSCC: Oral squamous cell carcinoma | ||
| Skin | 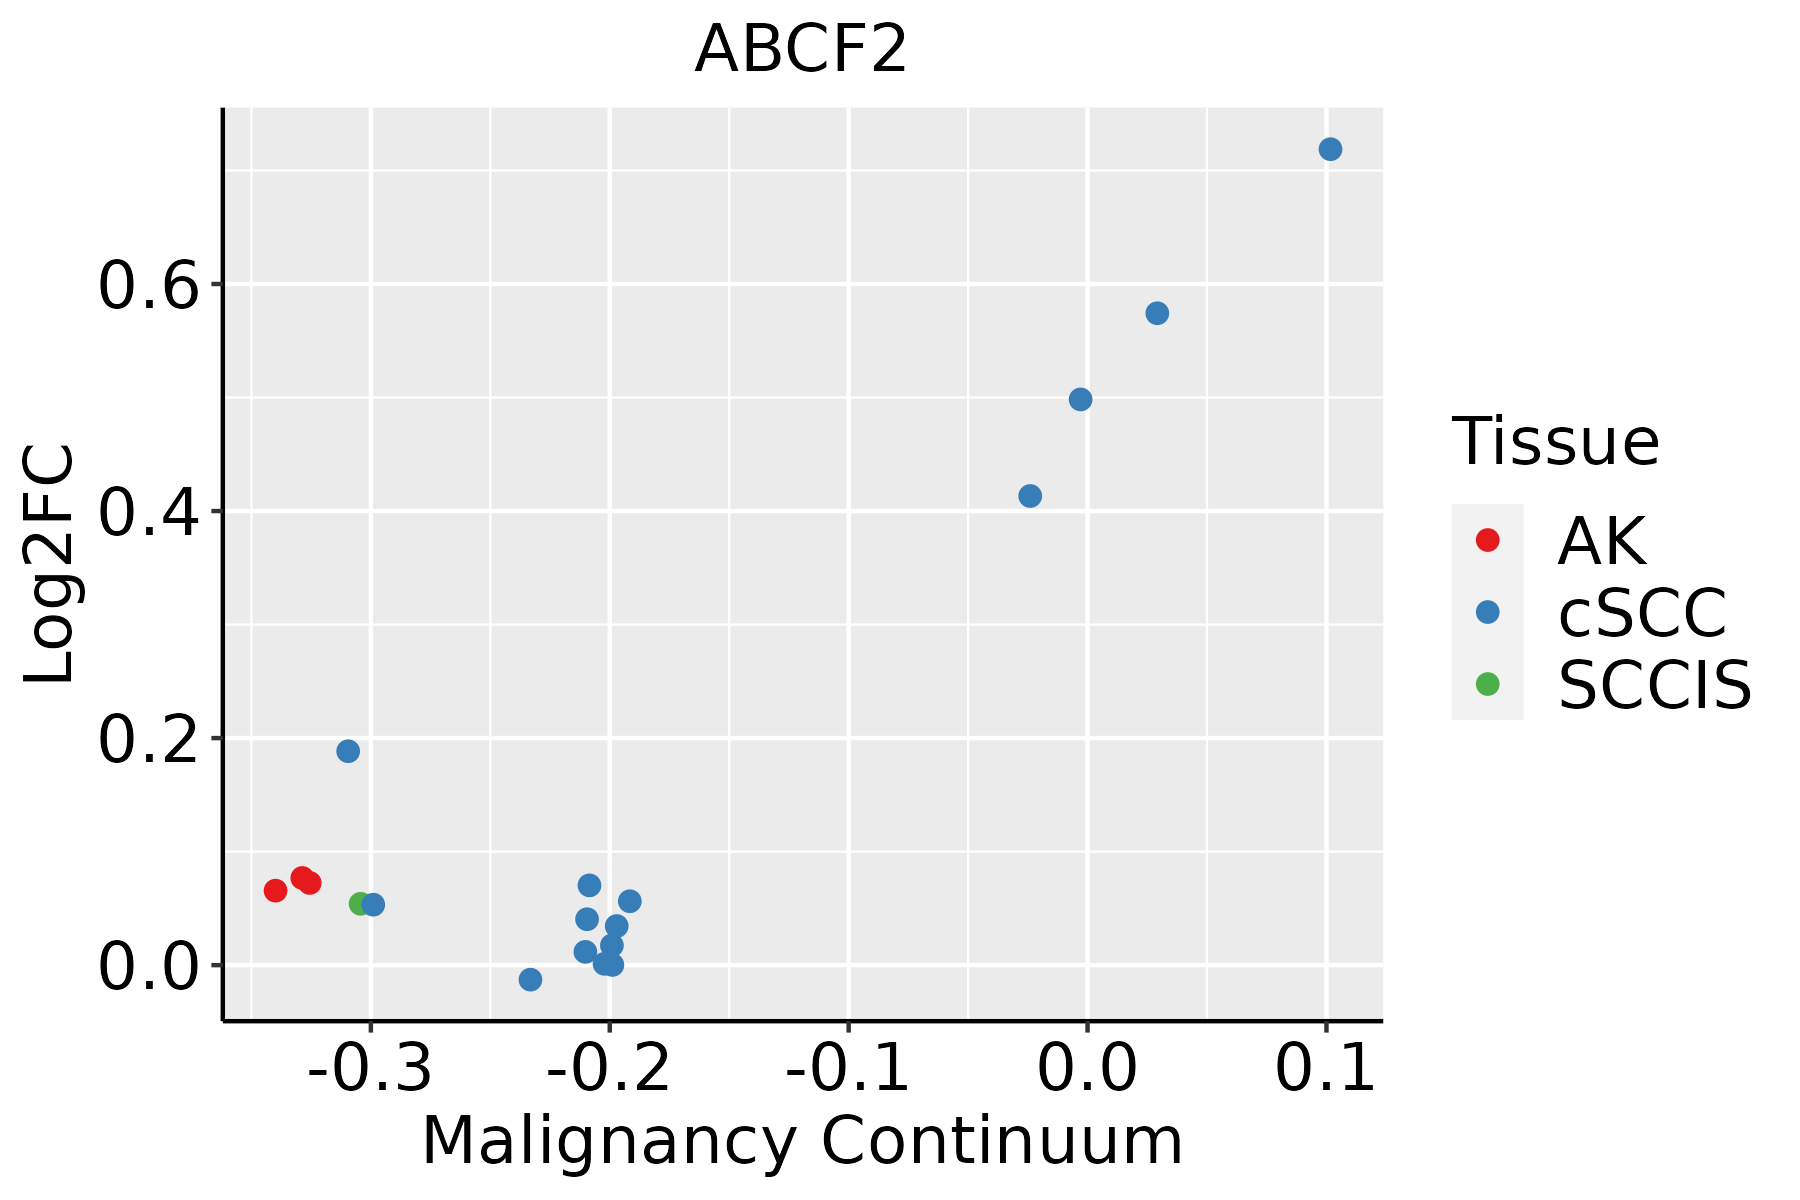 | AK: Actinic keratosis |
| cSCC: Cutaneous squamous cell carcinoma | ||
| SCCIS:squamous cell carcinoma in situ |
| ∗log2FC in expression of this searched gene in stem-like cells from each diseased tissue sample relative to stem-like cells in normal samples in each tissue plotted against the malignancy continuum. Samples are colored based on if they are from different disease stage. |
Top |
Malignant transformation related pathway analysis |
| Find out the enriched GO biological processes and KEGG pathways involved in transition from healthy to precancer to cancer |
| Tissue | Disease Stage | Enriched GO biological Processes |
| Colorectum | AD |  |
| Colorectum | SER |  |
| Colorectum | MSS |  |
| Colorectum | MSI-H |  |
| Colorectum | FAP |  |
| ∗Top 15 enriched GO BP terms are showed in the bar plot of each disease state in each tissue. Each row represents a significant GO biological process which is colored according to the -log10(p.adjust). |
| Page: 1 2 3 4 5 6 7 8 9 |
| GO ID | Tissue | Disease Stage | Description | Gene Ratio | Bg Ratio | pvalue | p.adjust | Count |
| Page: 1 |
| Pathway ID | Tissue | Disease Stage | Description | Gene Ratio | Bg Ratio | pvalue | p.adjust | qvalue | Count |
| hsa05130211 | Esophagus | ESCC | Pathogenic Escherichia coli infection | 142/4205 | 197/8465 | 8.21e-11 | 1.06e-09 | 5.42e-10 | 142 |
| hsa05130310 | Esophagus | ESCC | Pathogenic Escherichia coli infection | 142/4205 | 197/8465 | 8.21e-11 | 1.06e-09 | 5.42e-10 | 142 |
| hsa0513042 | Liver | HCC | Pathogenic Escherichia coli infection | 129/4020 | 197/8465 | 2.02e-07 | 2.50e-06 | 1.39e-06 | 129 |
| hsa0513052 | Liver | HCC | Pathogenic Escherichia coli infection | 129/4020 | 197/8465 | 2.02e-07 | 2.50e-06 | 1.39e-06 | 129 |
| Page: 1 |
Top |
Cell-cell communication analysis |
| Identification of potential cell-cell interactions between two cell types and their ligand-receptor pairs for different disease states |
| Ligand | Receptor | LRpair | Pathway | Tissue | Disease Stage |
| Page: 1 |
Top |
Single-cell gene regulatory network inference analysis |
| Find out the significant the regulons (TFs) and the target genes of each regulon across cell types for different disease states |
| TF | Cell Type | Tissue | Disease Stage | Target Gene | RSS | Regulon Activity |
| ∗The dot plots of a searched regulon are shown for all cell subpopulations in each disease state of each tissue based on the regulon specific score inferred using pySCENIC and by calculating the average expression. |
| Page: 1 |
Top |
Somatic mutation of malignant transformation related genes |
| Annotation of somatic variants for genes involved in malignant transformation |
| Hugo Symbol | Variant Class | Variant Classification | dbSNP RS | HGVSc | HGVSp | HGVSp Short | SWISSPROT | BIOTYPE | SIFT | PolyPhen | Tumor Sample Barcode | Tissue | Histology | Sex | Age | Stage | Therapy Types | Drugs | Outcome |
| ABCF2 | SNV | Missense_Mutation | c.997N>C | p.Asp333His | p.D333H | Q9UG63 | protein_coding | deleterious(0) | possibly_damaging(0.759) | TCGA-A7-A26H-01 | Breast | breast invasive carcinoma | Female | >=65 | I/II | Hormone Therapy | anastrozole | PD | |
| ABCF2 | SNV | Missense_Mutation | c.1346N>A | p.Pro449His | p.P449H | Q9UG63 | protein_coding | deleterious(0.01) | probably_damaging(1) | TCGA-B6-A0RE-01 | Breast | breast invasive carcinoma | Female | <65 | I/II | Unknown | Unknown | SD | |
| ABCF2 | SNV | Missense_Mutation | rs145078285 | c.667C>T | p.Arg223Cys | p.R223C | Q9UG63 | protein_coding | tolerated(0.16) | benign(0.007) | TCGA-BH-A1F6-01 | Breast | breast invasive carcinoma | Female | <65 | III/IV | Unknown | Unknown | SD |
| ABCF2 | SNV | Missense_Mutation | c.198N>C | p.Lys66Asn | p.K66N | Q9UG63 | protein_coding | tolerated(0.31) | benign(0.21) | TCGA-C8-A1HM-01 | Breast | breast invasive carcinoma | Female | >=65 | I/II | Chemotherapy | doxorubicin | CR | |
| ABCF2 | SNV | Missense_Mutation | rs535093235 | c.1052A>G | p.Lys351Arg | p.K351R | Q9UG63 | protein_coding | tolerated(0.05) | benign(0.317) | TCGA-EW-A1IZ-01 | Breast | breast invasive carcinoma | Female | <65 | III/IV | Chemotherapy | taxotere | SD |
| ABCF2 | insertion | Frame_Shift_Ins | novel | c.948_949insG | p.Arg317AlafsTer63 | p.R317Afs*63 | Q9UG63 | protein_coding | TCGA-A2-A0YJ-01 | Breast | breast invasive carcinoma | Female | <65 | III/IV | Chemotherapy | cytoxan | PD | ||
| ABCF2 | insertion | Frame_Shift_Ins | novel | c.1797_1798insAG | p.Ala600ArgfsTer28 | p.A600Rfs*28 | Q9UG63 | protein_coding | TCGA-A8-A06Q-01 | Breast | breast invasive carcinoma | Female | <65 | III/IV | Unknown | Unknown | SD | ||
| ABCF2 | insertion | Frame_Shift_Ins | novel | c.1795_1796insCAGCGCTTTGGGAGGC | p.Leu599ProfsTer19 | p.L599Pfs*19 | Q9UG63 | protein_coding | TCGA-A8-A06Q-01 | Breast | breast invasive carcinoma | Female | <65 | III/IV | Unknown | Unknown | SD | ||
| ABCF2 | insertion | Frame_Shift_Ins | novel | c.658_659insGATACATTCGTGGGTGTATTTGTGTA | p.Ala220GlyfsTer16 | p.A220Gfs*16 | Q9UG63 | protein_coding | TCGA-BH-A0AY-01 | Breast | breast invasive carcinoma | Female | <65 | I/II | Chemotherapy | SD | |||
| ABCF2 | insertion | Frame_Shift_Ins | novel | c.1638_1639insTTTT | p.Leu547PhefsTer16 | p.L547Ffs*16 | Q9UG63 | protein_coding | TCGA-BH-A0B1-01 | Breast | breast invasive carcinoma | Female | >=65 | I/II | Chemotherapy | adriamycin | SD |
| Page: 1 2 3 4 5 6 |
Top |
Related drugs of malignant transformation related genes |
| Identification of chemicals and drugs interact with genes involved in malignant transfromation |
| (DGIdb 4.0) |
| Entrez ID | Symbol | Category | Interaction Types | Drug Claim Name | Drug Name | PMIDs |
| Page: 1 |

Copyright 2023-Present -The University of Texas Health Science Center at Houston |