
|
|||||
|
 | |
| |
| |
| |
| |
| |
|
Gene: ABCF1 |
Gene summary for ABCF1 |
| Gene information | Species | Human | Gene symbol | ABCF1 | Gene ID | 23 |
| Gene name | ATP binding cassette subfamily F member 1 | |
| Gene Alias | ABC27 | |
| Cytomap | 6p21.33 | |
| Gene Type | protein-coding | GO ID | GO:0006412 | UniProtAcc | A0A1U9X609 |
Top |
Malignant transformation analysis |
| Identification of the aberrant gene expression in precancerous and cancerous lesions by comparing the gene expression of stem-like cells in diseased tissues with normal stem cells |
| Entrez ID | Symbol | Replicates | Species | Organ | Tissue | Adj P-value | Log2FC | Malignancy |
| 23 | ABCF1 | LZE4T | Human | Esophagus | ESCC | 2.15e-16 | 4.35e-01 | 0.0811 |
| 23 | ABCF1 | LZE5T | Human | Esophagus | ESCC | 2.63e-09 | 4.42e-01 | 0.0514 |
| 23 | ABCF1 | LZE7T | Human | Esophagus | ESCC | 2.48e-09 | 7.88e-01 | 0.0667 |
| 23 | ABCF1 | LZE8T | Human | Esophagus | ESCC | 3.26e-06 | 1.62e-01 | 0.067 |
| 23 | ABCF1 | LZE20T | Human | Esophagus | ESCC | 1.14e-05 | 3.48e-01 | 0.0662 |
| 23 | ABCF1 | LZE21D1 | Human | Esophagus | HGIN | 1.29e-02 | 2.02e-01 | 0.0632 |
| 23 | ABCF1 | LZE22D1 | Human | Esophagus | HGIN | 1.21e-03 | 3.80e-02 | 0.0595 |
| 23 | ABCF1 | LZE22T | Human | Esophagus | ESCC | 1.39e-09 | 5.04e-01 | 0.068 |
| 23 | ABCF1 | LZE24T | Human | Esophagus | ESCC | 3.22e-16 | 3.50e-01 | 0.0596 |
| 23 | ABCF1 | LZE21T | Human | Esophagus | ESCC | 3.16e-04 | 5.85e-01 | 0.0655 |
| 23 | ABCF1 | LZE6T | Human | Esophagus | ESCC | 9.72e-04 | 3.73e-01 | 0.0845 |
| 23 | ABCF1 | P1T-E | Human | Esophagus | ESCC | 2.62e-13 | 7.90e-01 | 0.0875 |
| 23 | ABCF1 | P2T-E | Human | Esophagus | ESCC | 1.34e-41 | 8.48e-01 | 0.1177 |
| 23 | ABCF1 | P4T-E | Human | Esophagus | ESCC | 1.11e-29 | 7.76e-01 | 0.1323 |
| 23 | ABCF1 | P5T-E | Human | Esophagus | ESCC | 2.60e-22 | 4.52e-01 | 0.1327 |
| 23 | ABCF1 | P8T-E | Human | Esophagus | ESCC | 1.74e-21 | 4.96e-01 | 0.0889 |
| 23 | ABCF1 | P9T-E | Human | Esophagus | ESCC | 9.38e-18 | 5.33e-01 | 0.1131 |
| 23 | ABCF1 | P10T-E | Human | Esophagus | ESCC | 4.14e-22 | 4.56e-01 | 0.116 |
| 23 | ABCF1 | P11T-E | Human | Esophagus | ESCC | 3.76e-09 | 6.76e-01 | 0.1426 |
| 23 | ABCF1 | P12T-E | Human | Esophagus | ESCC | 2.97e-20 | 5.29e-01 | 0.1122 |
| Page: 1 2 3 4 5 6 7 |
| Tissue | Expression Dynamics | Abbreviation |
| Esophagus | 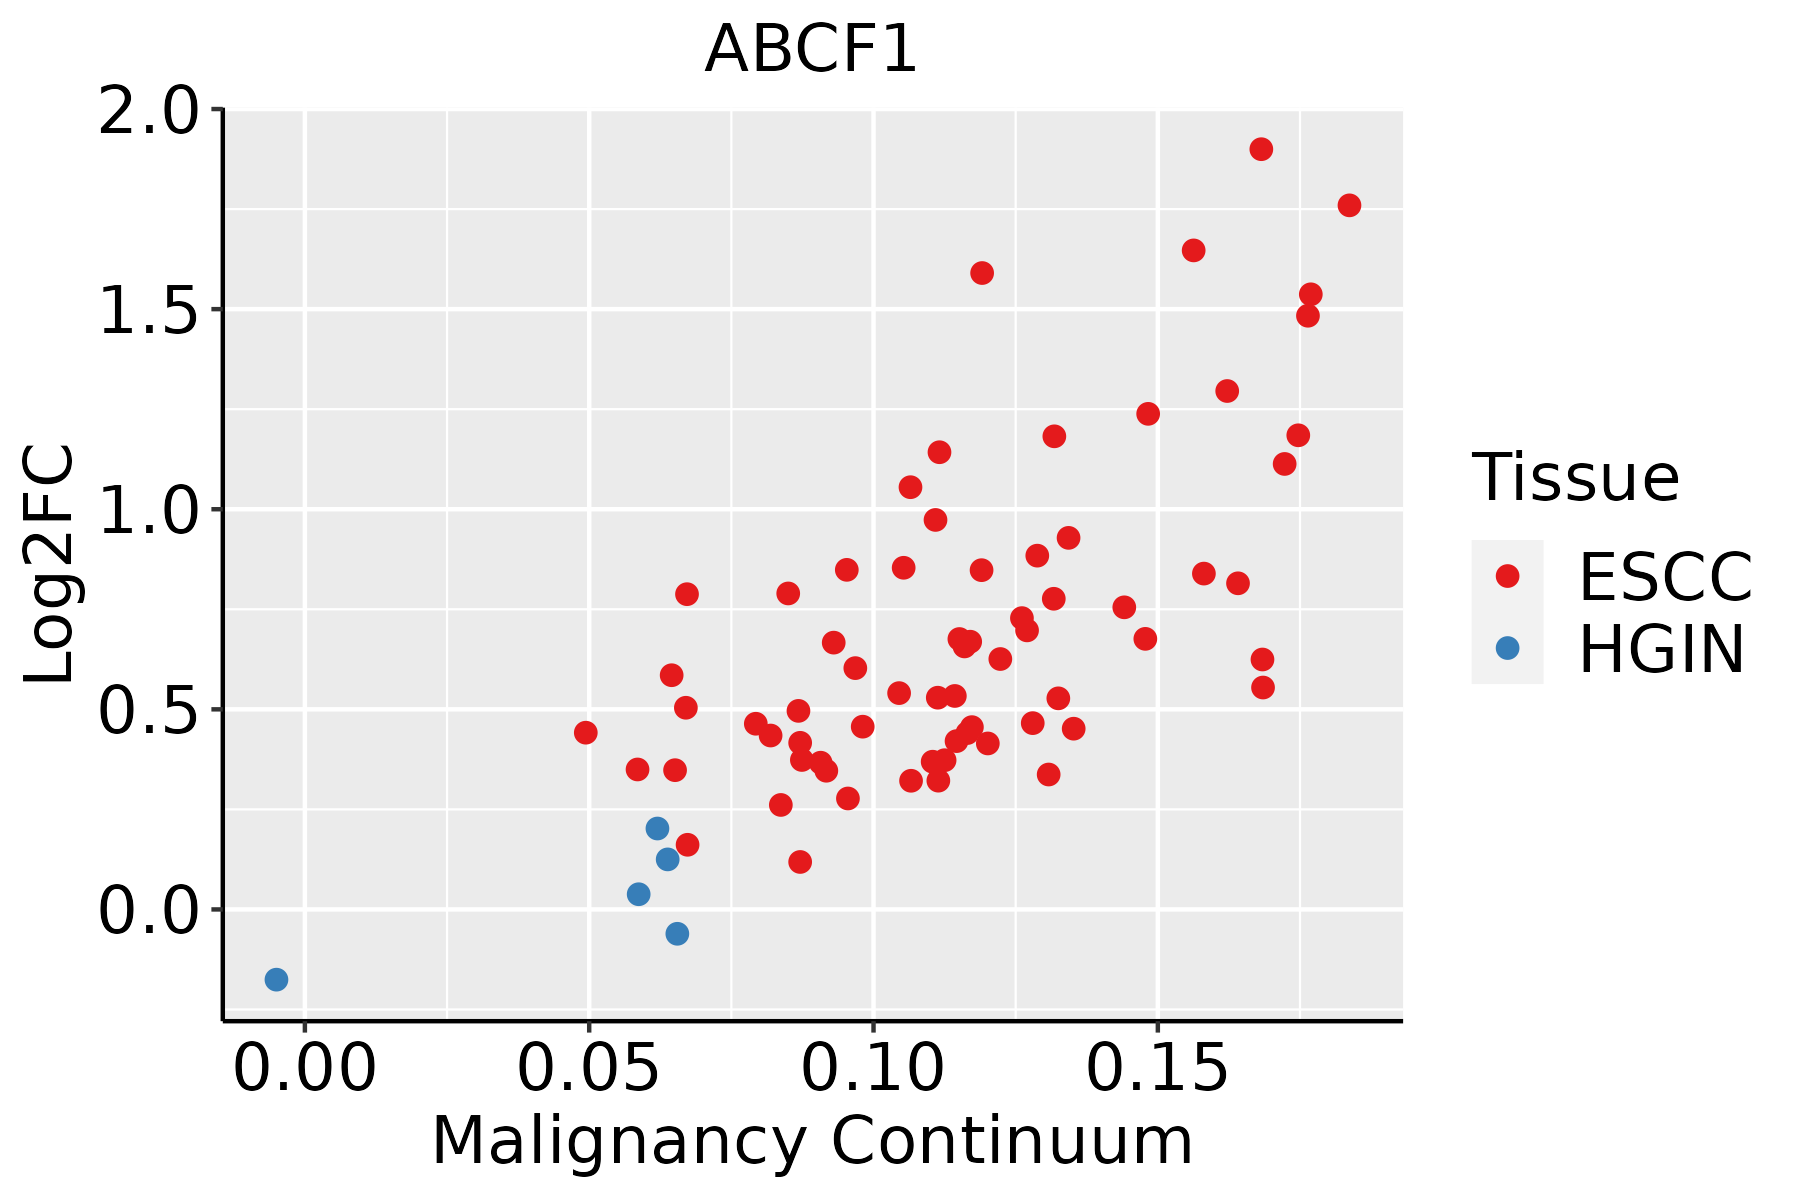 | ESCC: Esophageal squamous cell carcinoma |
| HGIN: High-grade intraepithelial neoplasias | ||
| LGIN: Low-grade intraepithelial neoplasias | ||
| Liver | 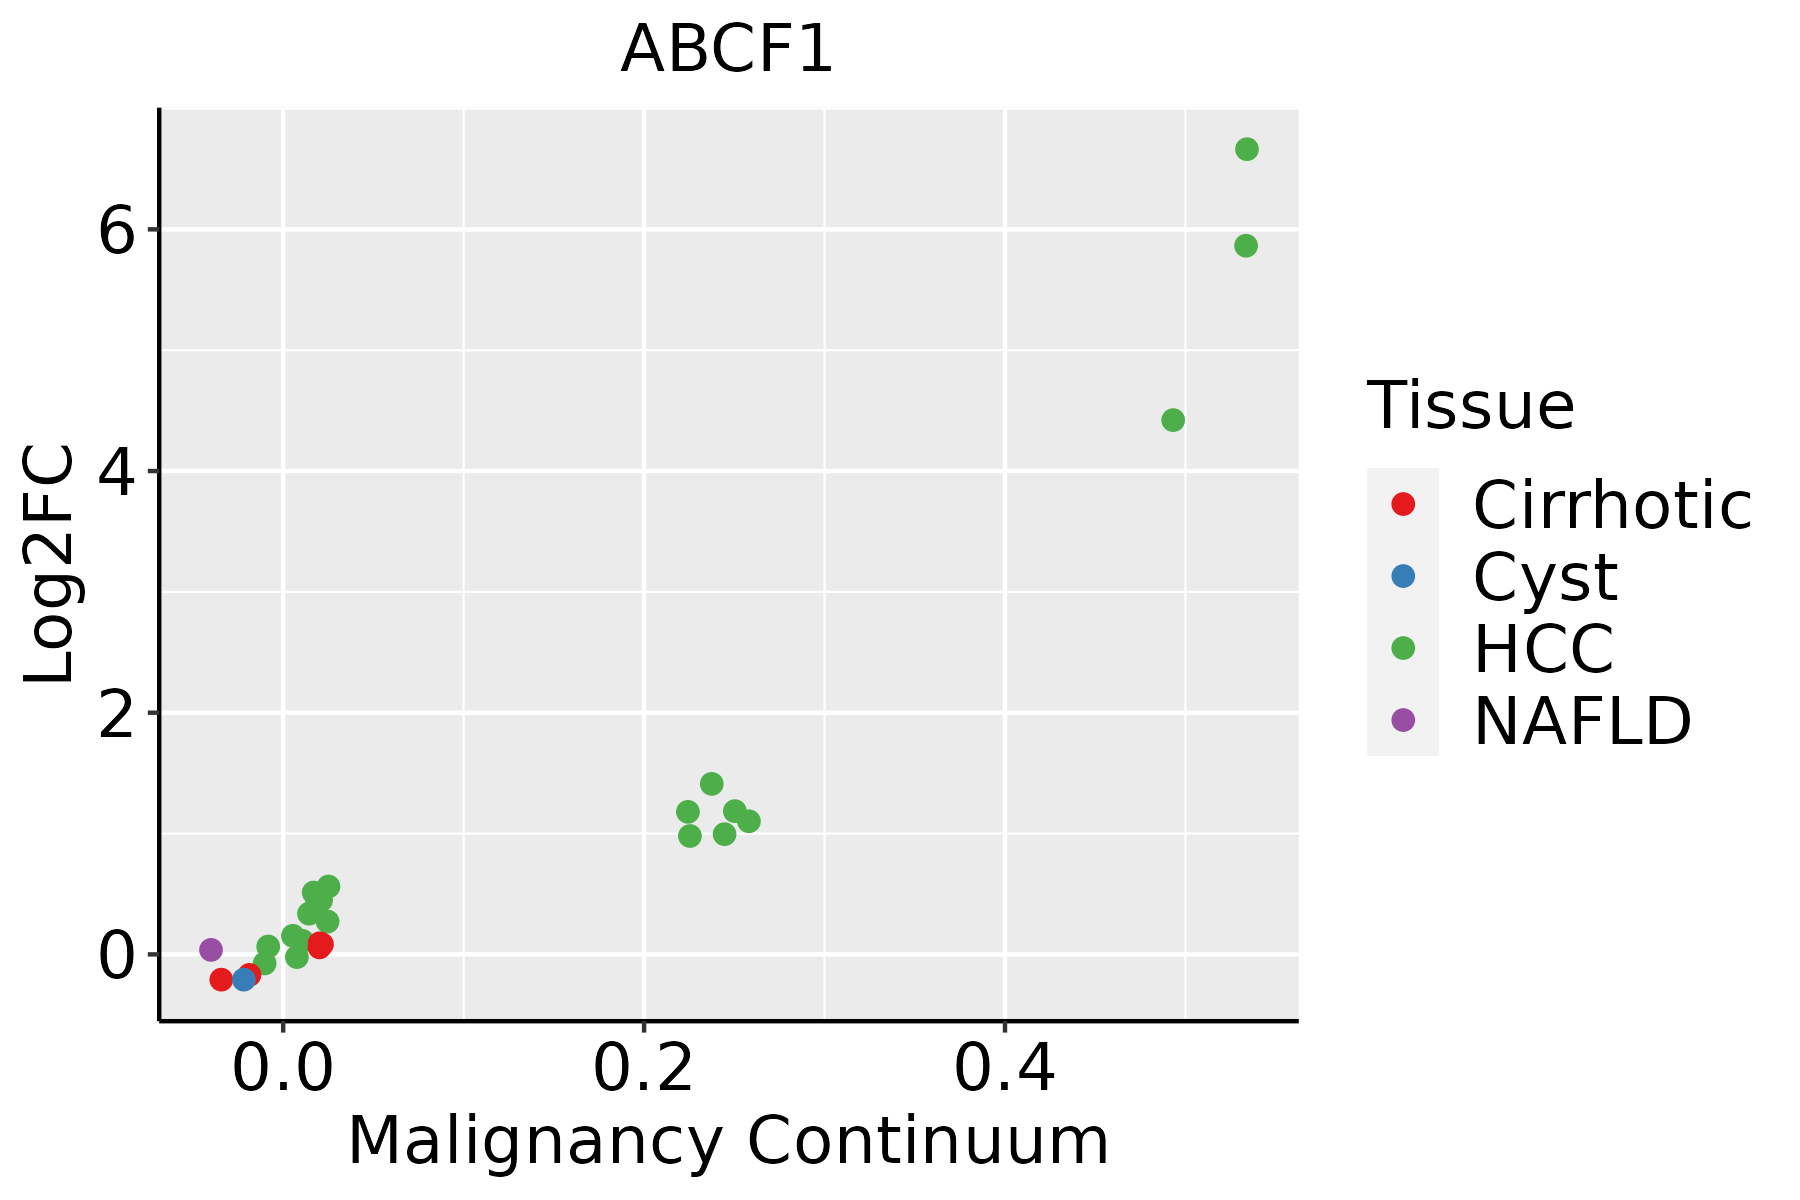 | HCC: Hepatocellular carcinoma |
| NAFLD: Non-alcoholic fatty liver disease | ||
| Lung |  | AAH: Atypical adenomatous hyperplasia |
| AIS: Adenocarcinoma in situ | ||
| IAC: Invasive lung adenocarcinoma | ||
| MIA: Minimally invasive adenocarcinoma | ||
| Oral Cavity | 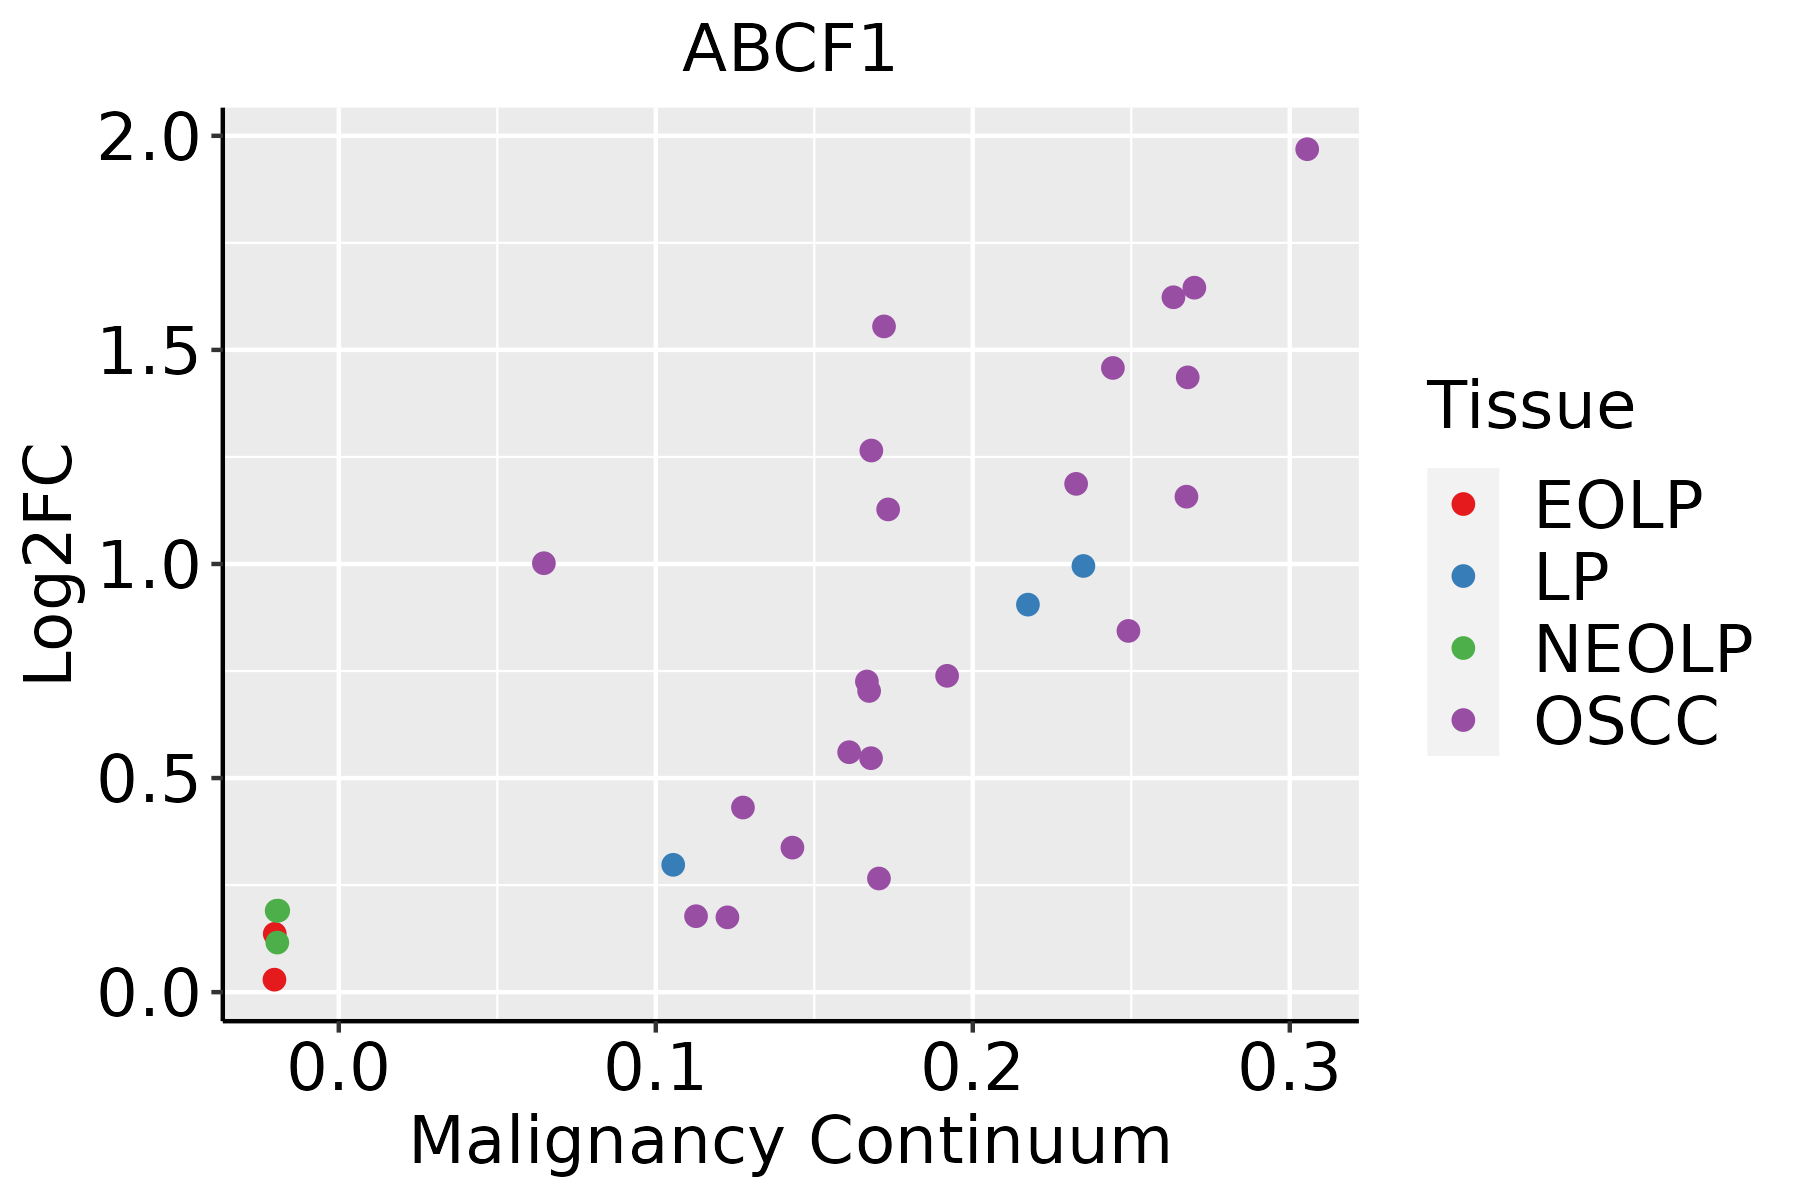 | EOLP: Erosive Oral lichen planus |
| LP: leukoplakia | ||
| NEOLP: Non-erosive oral lichen planus | ||
| OSCC: Oral squamous cell carcinoma | ||
| Prostate | 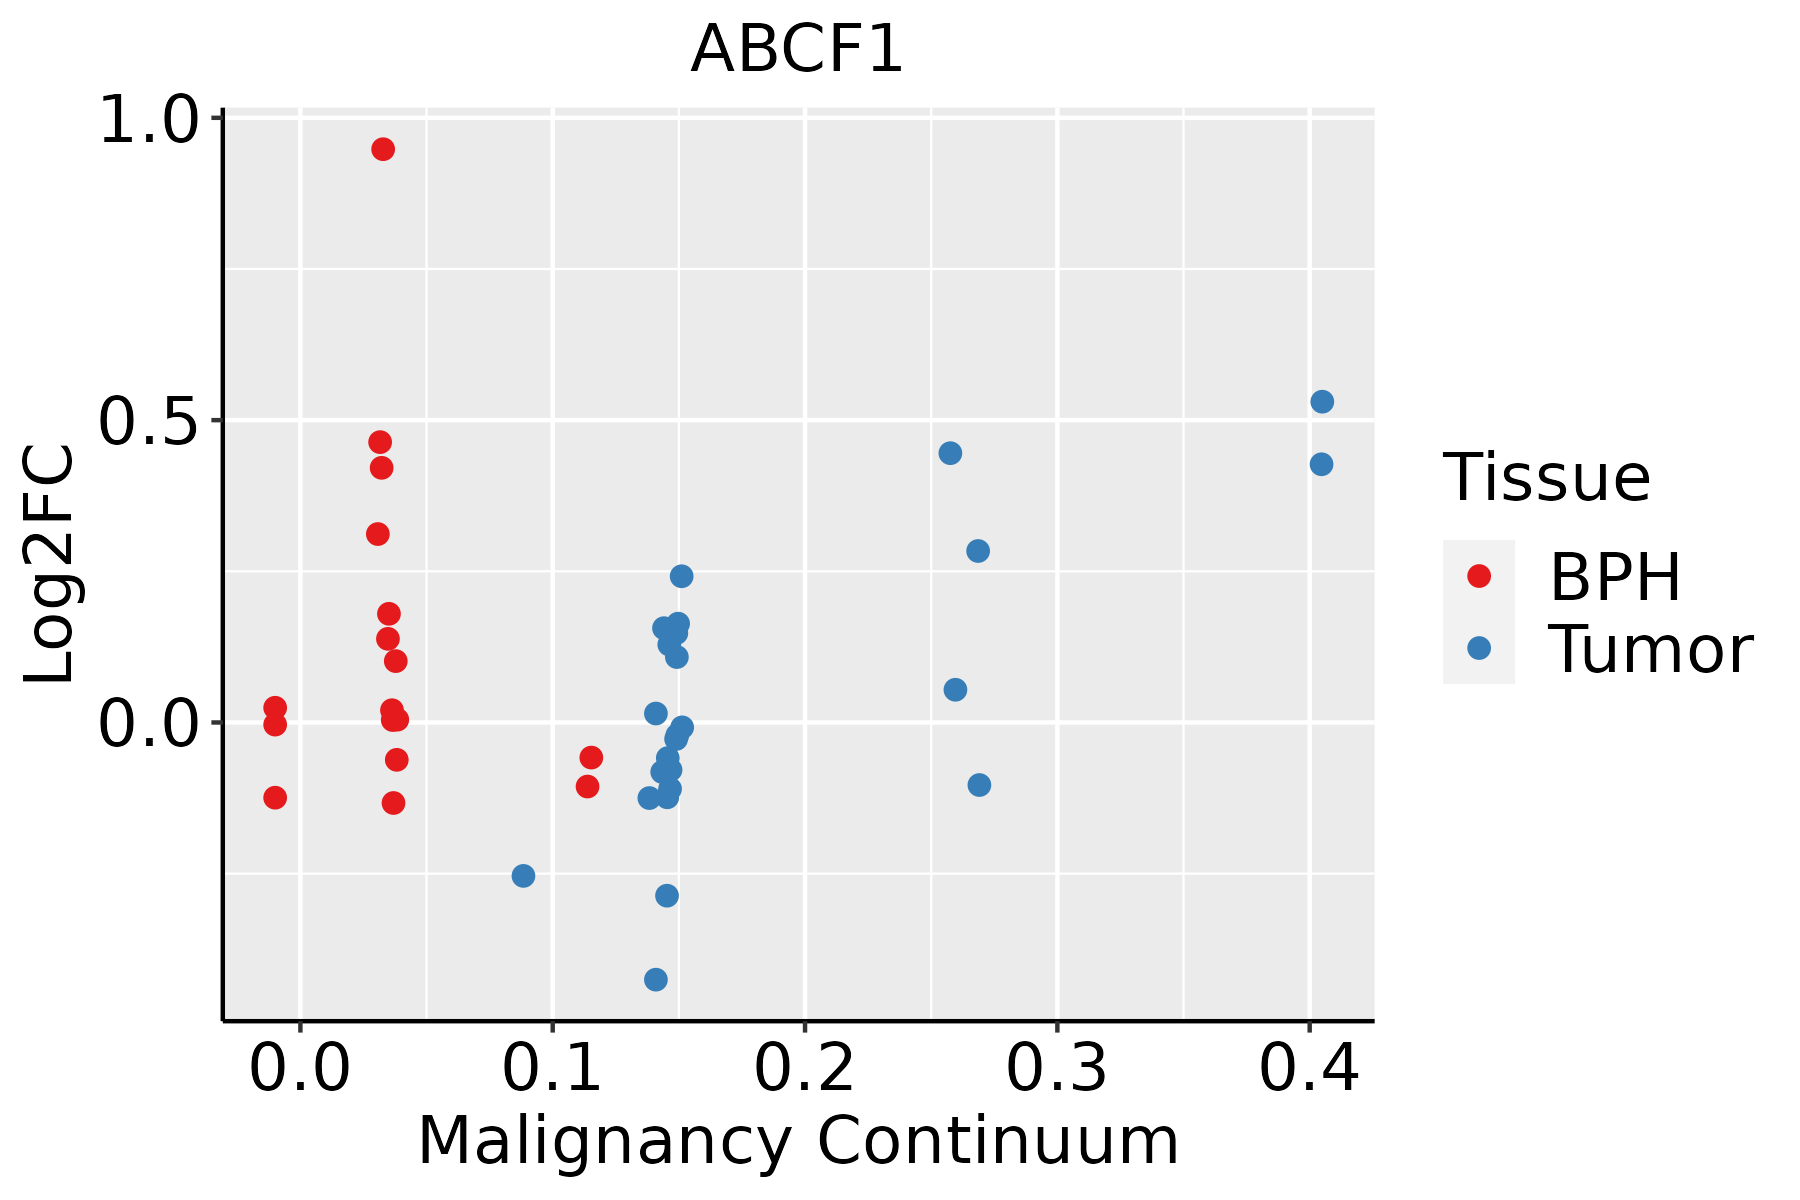 | BPH: Benign Prostatic Hyperplasia |
| Skin | 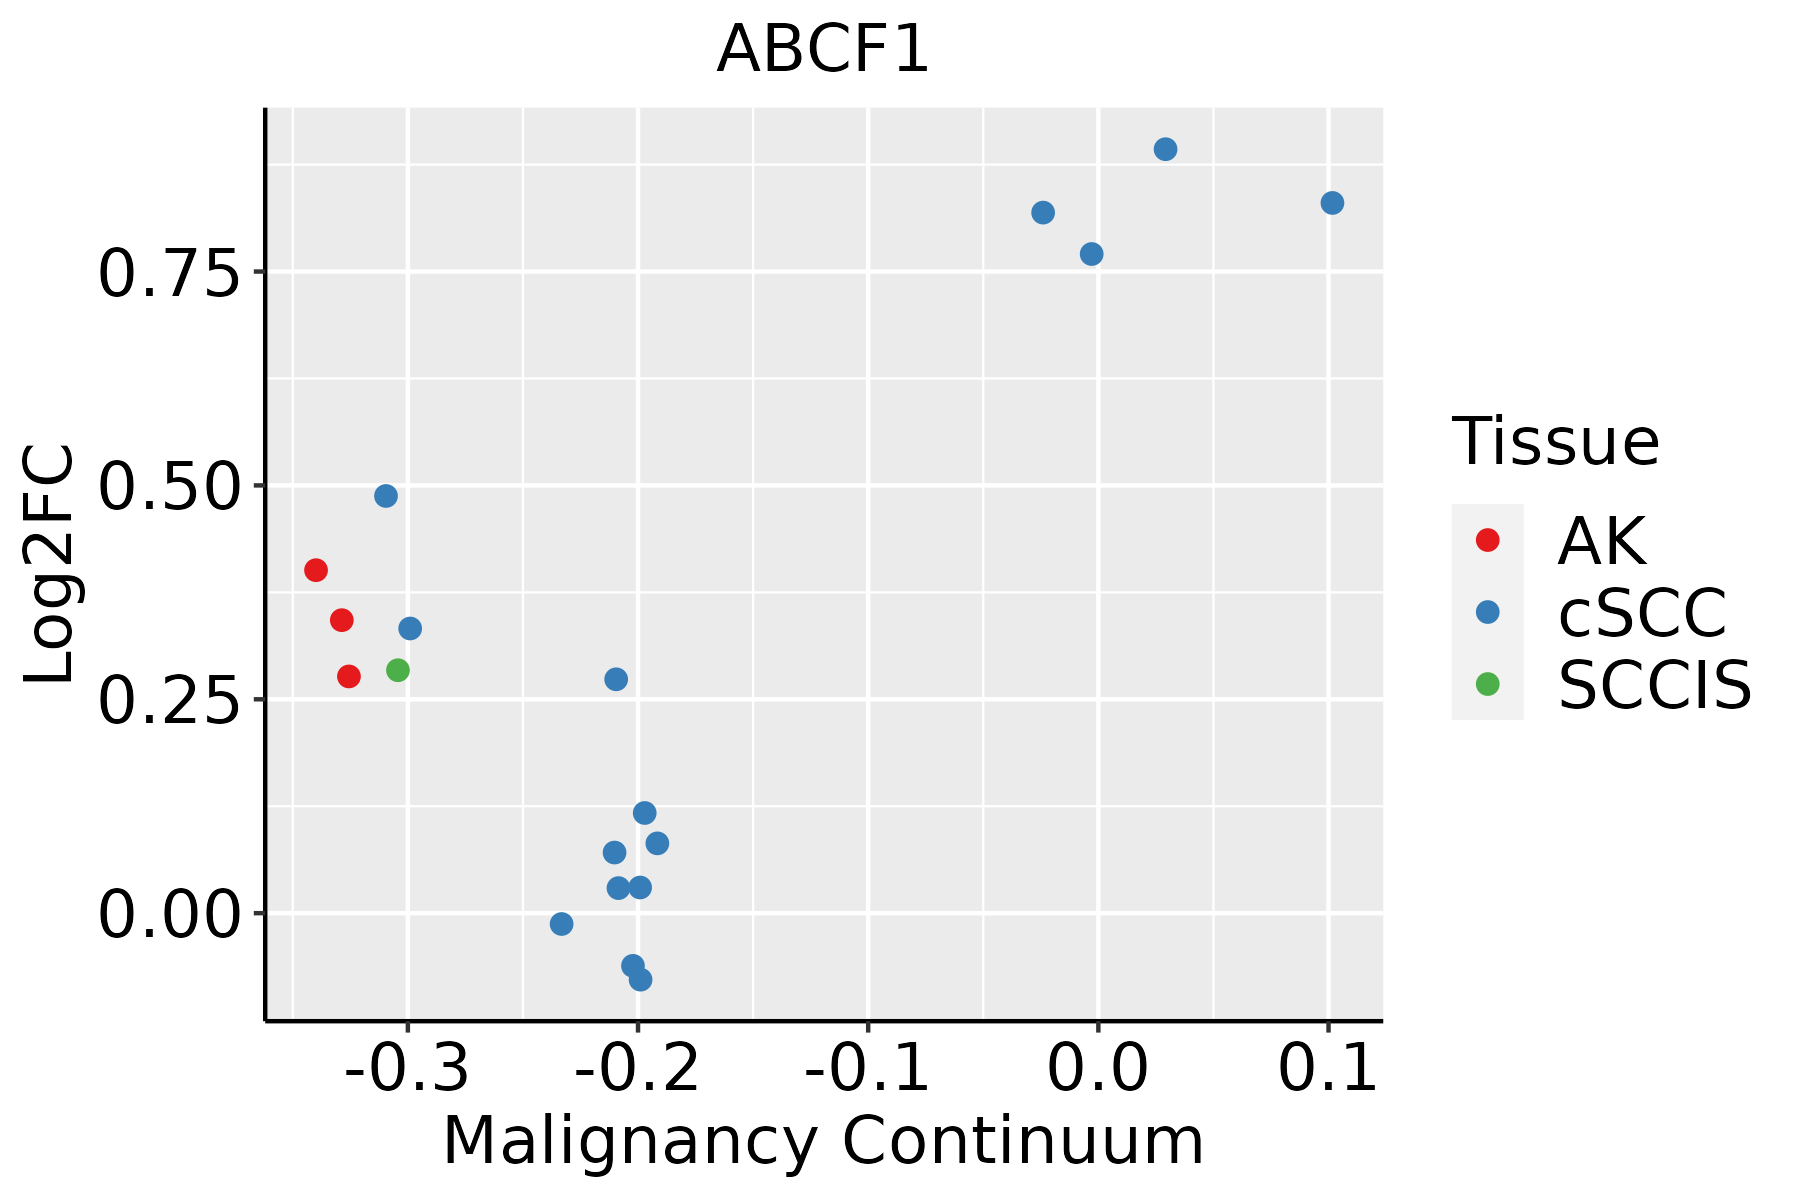 | AK: Actinic keratosis |
| cSCC: Cutaneous squamous cell carcinoma | ||
| SCCIS:squamous cell carcinoma in situ | ||
| Thyroid | 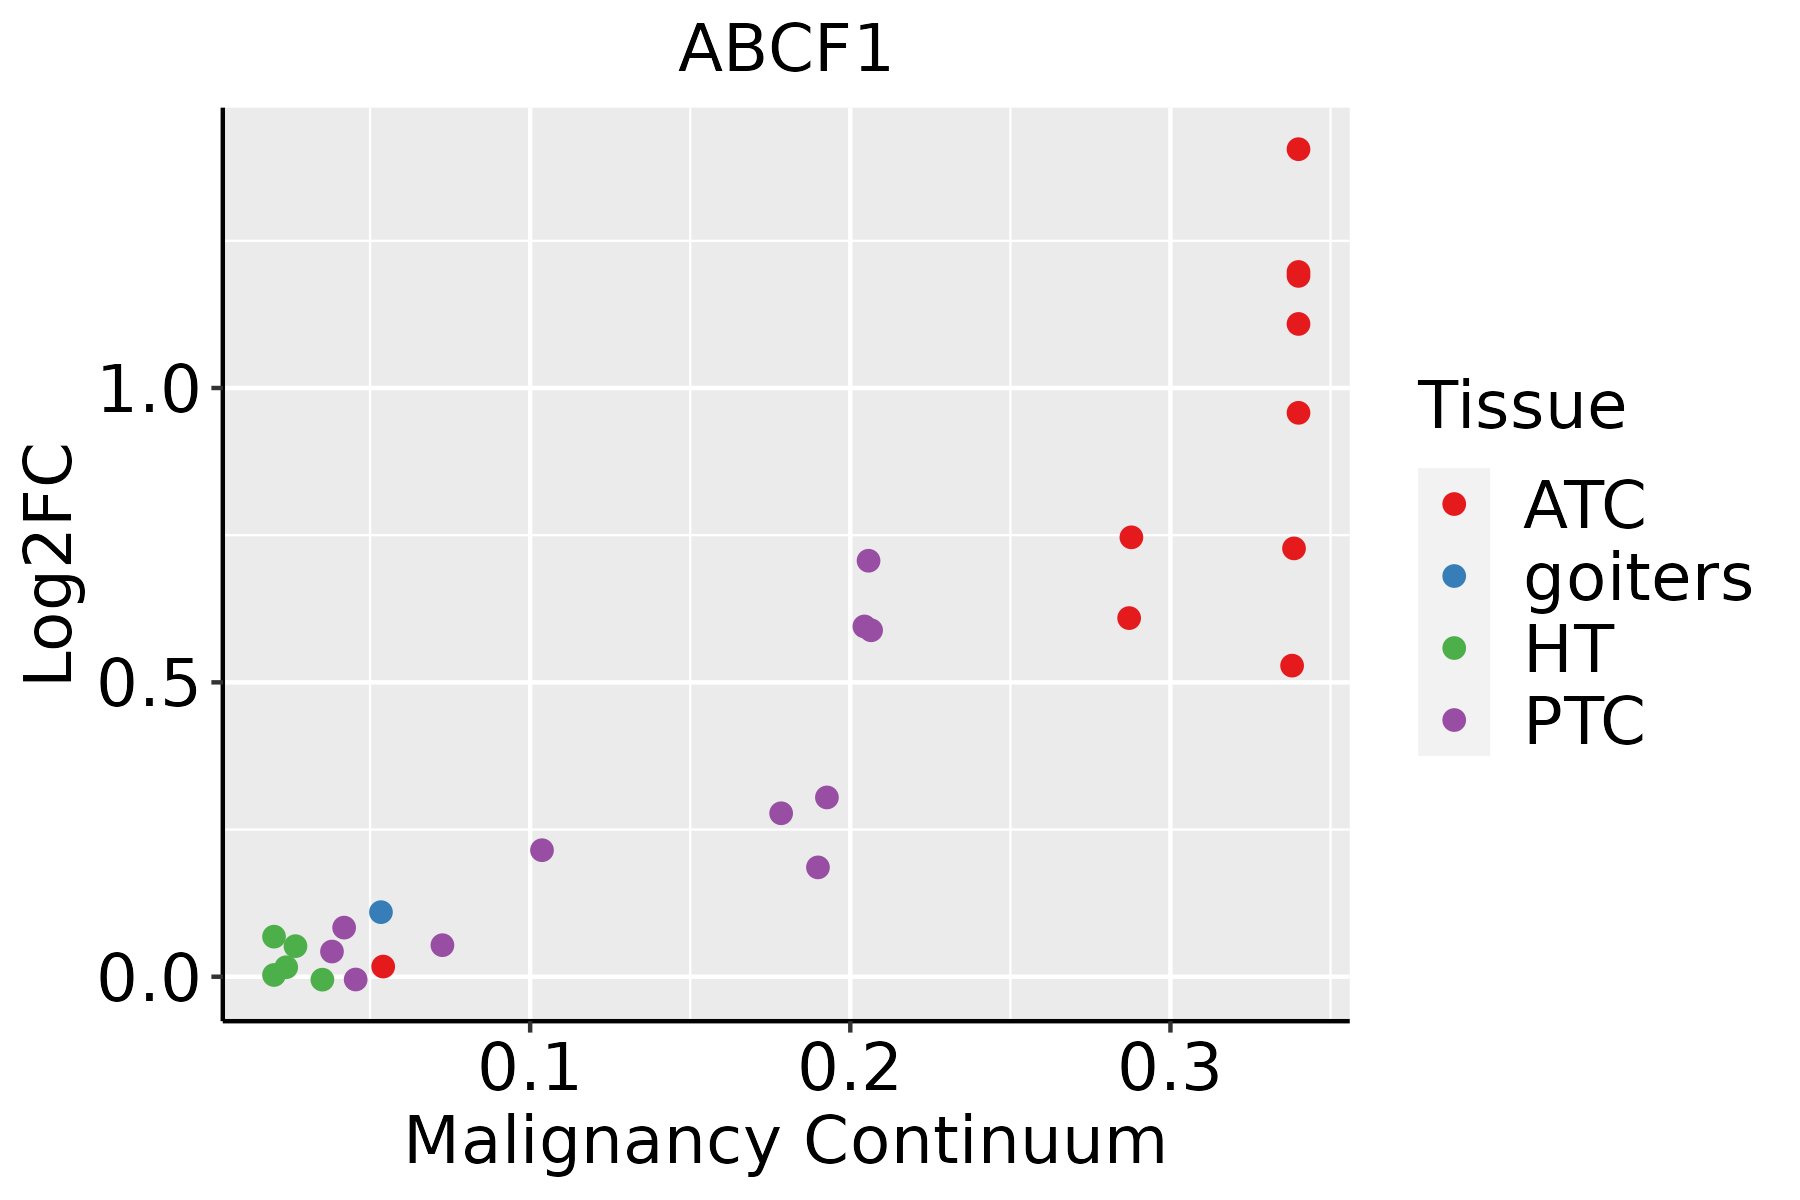 | ATC: Anaplastic thyroid cancer |
| HT: Hashimoto's thyroiditis | ||
| PTC: Papillary thyroid cancer |
| ∗log2FC in expression of this searched gene in stem-like cells from each diseased tissue sample relative to stem-like cells in normal samples in each tissue plotted against the malignancy continuum. Samples are colored based on if they are from different disease stage. |
Top |
Malignant transformation related pathway analysis |
| Find out the enriched GO biological processes and KEGG pathways involved in transition from healthy to precancer to cancer |
| Tissue | Disease Stage | Enriched GO biological Processes |
| Colorectum | AD |  |
| Colorectum | SER |  |
| Colorectum | MSS |  |
| Colorectum | MSI-H |  |
| Colorectum | FAP |  |
| ∗Top 15 enriched GO BP terms are showed in the bar plot of each disease state in each tissue. Each row represents a significant GO biological process which is colored according to the -log10(p.adjust). |
| Page: 1 2 3 4 5 6 7 8 9 |
| GO ID | Tissue | Disease Stage | Description | Gene Ratio | Bg Ratio | pvalue | p.adjust | Count |
| Page: 1 |
| Pathway ID | Tissue | Disease Stage | Description | Gene Ratio | Bg Ratio | pvalue | p.adjust | qvalue | Count |
| Page: 1 |
Top |
Cell-cell communication analysis |
| Identification of potential cell-cell interactions between two cell types and their ligand-receptor pairs for different disease states |
| Ligand | Receptor | LRpair | Pathway | Tissue | Disease Stage |
| Page: 1 |
Top |
Single-cell gene regulatory network inference analysis |
| Find out the significant the regulons (TFs) and the target genes of each regulon across cell types for different disease states |
| TF | Cell Type | Tissue | Disease Stage | Target Gene | RSS | Regulon Activity |
| ∗The dot plots of a searched regulon are shown for all cell subpopulations in each disease state of each tissue based on the regulon specific score inferred using pySCENIC and by calculating the average expression. |
| Page: 1 |
Top |
Somatic mutation of malignant transformation related genes |
| Annotation of somatic variants for genes involved in malignant transformation |
| Hugo Symbol | Variant Class | Variant Classification | dbSNP RS | HGVSc | HGVSp | HGVSp Short | SWISSPROT | BIOTYPE | SIFT | PolyPhen | Tumor Sample Barcode | Tissue | Histology | Sex | Age | Stage | Therapy Types | Drugs | Outcome |
| ABCF1 | SNV | Missense_Mutation | novel | c.2241N>C | p.Gln747His | p.Q747H | Q8NE71 | protein_coding | deleterious(0) | probably_damaging(1) | TCGA-5L-AAT1-01 | Breast | breast invasive carcinoma | Female | <65 | III/IV | Hormone Therapy | letrozol | SD |
| ABCF1 | SNV | Missense_Mutation | c.2445G>C | p.Gln815His | p.Q815H | Q8NE71 | protein_coding | tolerated(0.14) | possibly_damaging(0.737) | TCGA-A2-A0CT-01 | Breast | breast invasive carcinoma | Female | >=65 | I/II | Chemotherapy | cytoxan | SD | |
| ABCF1 | SNV | Missense_Mutation | rs370684998 | c.1724N>T | p.Thr575Met | p.T575M | Q8NE71 | protein_coding | tolerated(0.06) | benign(0.174) | TCGA-AC-A3EH-01 | Breast | breast invasive carcinoma | Female | >=65 | III/IV | Unknown | Unknown | SD |
| ABCF1 | SNV | Missense_Mutation | c.2330N>T | p.Ser777Phe | p.S777F | Q8NE71 | protein_coding | deleterious(0) | probably_damaging(0.982) | TCGA-AN-A0AJ-01 | Breast | breast invasive carcinoma | Female | >=65 | I/II | Unknown | Unknown | SD | |
| ABCF1 | SNV | Missense_Mutation | c.503N>G | p.Glu168Gly | p.E168G | Q8NE71 | protein_coding | deleterious_low_confidence(0.02) | benign(0.166) | TCGA-AN-A0AK-01 | Breast | breast invasive carcinoma | Female | >=65 | I/II | Unknown | Unknown | SD | |
| ABCF1 | SNV | Missense_Mutation | c.1763N>T | p.Arg588Leu | p.R588L | Q8NE71 | protein_coding | deleterious(0.04) | benign(0.039) | TCGA-AN-A0AK-01 | Breast | breast invasive carcinoma | Female | >=65 | I/II | Unknown | Unknown | SD | |
| ABCF1 | SNV | Missense_Mutation | c.2143N>G | p.Phe715Val | p.F715V | Q8NE71 | protein_coding | deleterious(0.01) | probably_damaging(0.969) | TCGA-C8-A137-01 | Breast | breast invasive carcinoma | Female | <65 | I/II | Unknown | Unknown | PD | |
| ABCF1 | SNV | Missense_Mutation | c.2170N>G | p.Lys724Glu | p.K724E | Q8NE71 | protein_coding | deleterious(0.02) | possibly_damaging(0.771) | TCGA-D8-A1XQ-01 | Breast | breast invasive carcinoma | Female | >=65 | I/II | Unknown | Unknown | SD | |
| ABCF1 | SNV | Missense_Mutation | novel | c.2231C>G | p.Ser744Cys | p.S744C | Q8NE71 | protein_coding | deleterious(0) | probably_damaging(1) | TCGA-OL-A5RW-01 | Breast | breast invasive carcinoma | Female | <65 | I/II | Chemotherapy | adriamycin | CR |
| ABCF1 | deletion | Frame_Shift_Del | novel | c.1805delN | p.Leu602ArgfsTer29 | p.L602Rfs*29 | Q8NE71 | protein_coding | TCGA-D8-A27V-01 | Breast | breast invasive carcinoma | Female | <65 | I/II | Hormone Therapy | tamoxiphen | SD |
| Page: 1 2 3 4 5 6 7 8 9 |
Top |
Related drugs of malignant transformation related genes |
| Identification of chemicals and drugs interact with genes involved in malignant transfromation |
| (DGIdb 4.0) |
| Entrez ID | Symbol | Category | Interaction Types | Drug Claim Name | Drug Name | PMIDs |
| Page: 1 |

Copyright 2023-Present -The University of Texas Health Science Center at Houston |