
|
|||||
|
 | |
| |
| |
| |
| |
| |
|
Gene: ABCE1 |
Gene summary for ABCE1 |
| Gene information | Species | Human | Gene symbol | ABCE1 | Gene ID | 6059 |
| Gene name | ATP binding cassette subfamily E member 1 | |
| Gene Alias | ABC38 | |
| Cytomap | 4q31.21 | |
| Gene Type | protein-coding | GO ID | GO:0000054 | UniProtAcc | P61221 |
Top |
Malignant transformation analysis |
| Identification of the aberrant gene expression in precancerous and cancerous lesions by comparing the gene expression of stem-like cells in diseased tissues with normal stem cells |
| Entrez ID | Symbol | Replicates | Species | Organ | Tissue | Adj P-value | Log2FC | Malignancy |
| 6059 | ABCE1 | LZE2T | Human | Esophagus | ESCC | 6.48e-05 | 4.87e-01 | 0.082 |
| 6059 | ABCE1 | LZE4T | Human | Esophagus | ESCC | 2.34e-18 | 5.01e-01 | 0.0811 |
| 6059 | ABCE1 | LZE5T | Human | Esophagus | ESCC | 6.27e-03 | 5.92e-01 | 0.0514 |
| 6059 | ABCE1 | LZE7T | Human | Esophagus | ESCC | 4.34e-02 | 1.69e-01 | 0.0667 |
| 6059 | ABCE1 | LZE8T | Human | Esophagus | ESCC | 4.73e-10 | 2.01e-01 | 0.067 |
| 6059 | ABCE1 | LZE20T | Human | Esophagus | ESCC | 2.37e-04 | 3.19e-02 | 0.0662 |
| 6059 | ABCE1 | LZE22D1 | Human | Esophagus | HGIN | 1.08e-02 | 1.64e-02 | 0.0595 |
| 6059 | ABCE1 | LZE22T | Human | Esophagus | ESCC | 4.45e-02 | 1.43e-01 | 0.068 |
| 6059 | ABCE1 | LZE24T | Human | Esophagus | ESCC | 2.60e-11 | 1.52e-01 | 0.0596 |
| 6059 | ABCE1 | LZE21T | Human | Esophagus | ESCC | 4.72e-04 | 1.11e-01 | 0.0655 |
| 6059 | ABCE1 | LZE6T | Human | Esophagus | ESCC | 2.38e-06 | 3.51e-01 | 0.0845 |
| 6059 | ABCE1 | P1T-E | Human | Esophagus | ESCC | 2.32e-05 | 3.14e-01 | 0.0875 |
| 6059 | ABCE1 | P2T-E | Human | Esophagus | ESCC | 3.97e-43 | 8.92e-01 | 0.1177 |
| 6059 | ABCE1 | P4T-E | Human | Esophagus | ESCC | 4.70e-34 | 7.57e-01 | 0.1323 |
| 6059 | ABCE1 | P5T-E | Human | Esophagus | ESCC | 4.11e-11 | 3.40e-01 | 0.1327 |
| 6059 | ABCE1 | P8T-E | Human | Esophagus | ESCC | 1.40e-18 | 3.15e-01 | 0.0889 |
| 6059 | ABCE1 | P9T-E | Human | Esophagus | ESCC | 2.78e-17 | 3.40e-01 | 0.1131 |
| 6059 | ABCE1 | P10T-E | Human | Esophagus | ESCC | 3.46e-29 | 5.44e-01 | 0.116 |
| 6059 | ABCE1 | P11T-E | Human | Esophagus | ESCC | 3.39e-20 | 7.18e-01 | 0.1426 |
| 6059 | ABCE1 | P12T-E | Human | Esophagus | ESCC | 2.53e-45 | 1.06e+00 | 0.1122 |
| Page: 1 2 3 4 5 6 |
| Tissue | Expression Dynamics | Abbreviation |
| Esophagus |  | ESCC: Esophageal squamous cell carcinoma |
| HGIN: High-grade intraepithelial neoplasias | ||
| LGIN: Low-grade intraepithelial neoplasias | ||
| Liver | 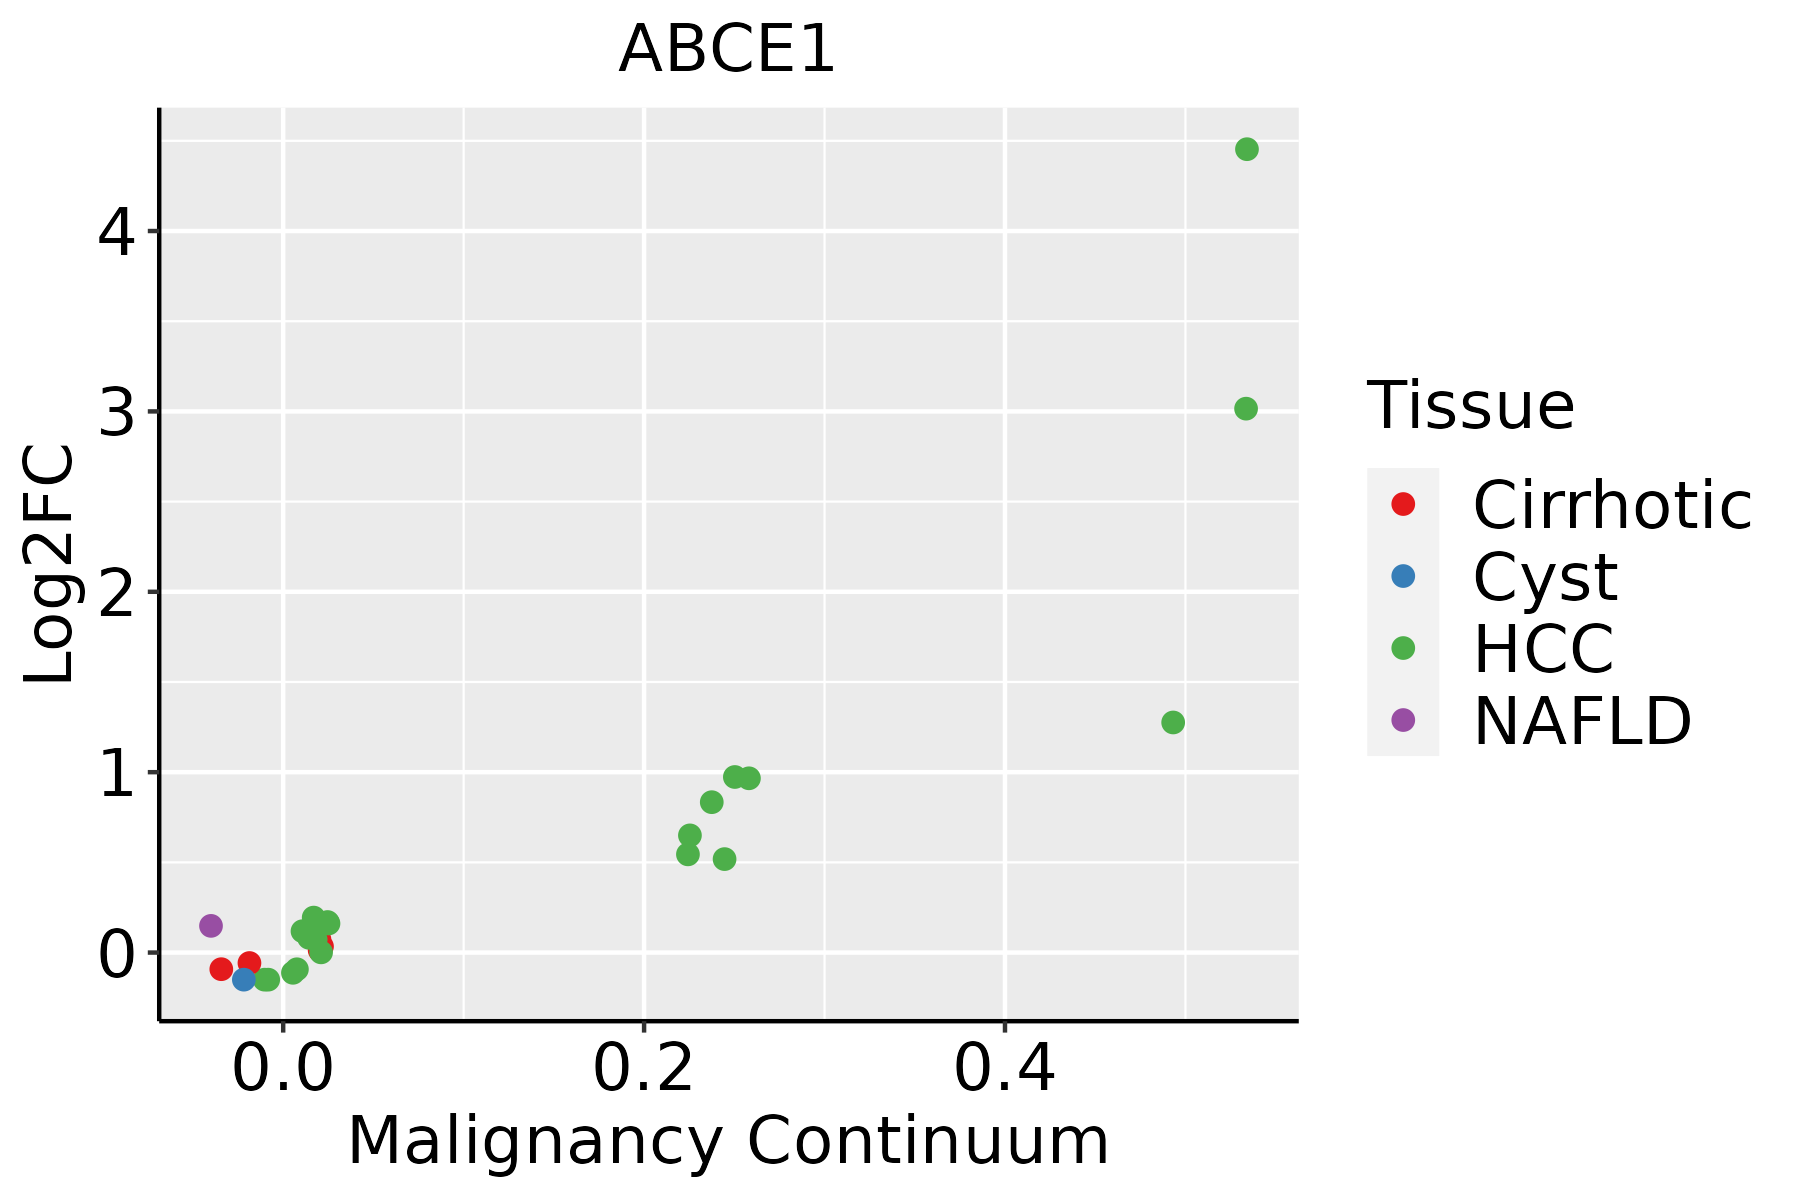 | HCC: Hepatocellular carcinoma |
| NAFLD: Non-alcoholic fatty liver disease | ||
| Oral Cavity | 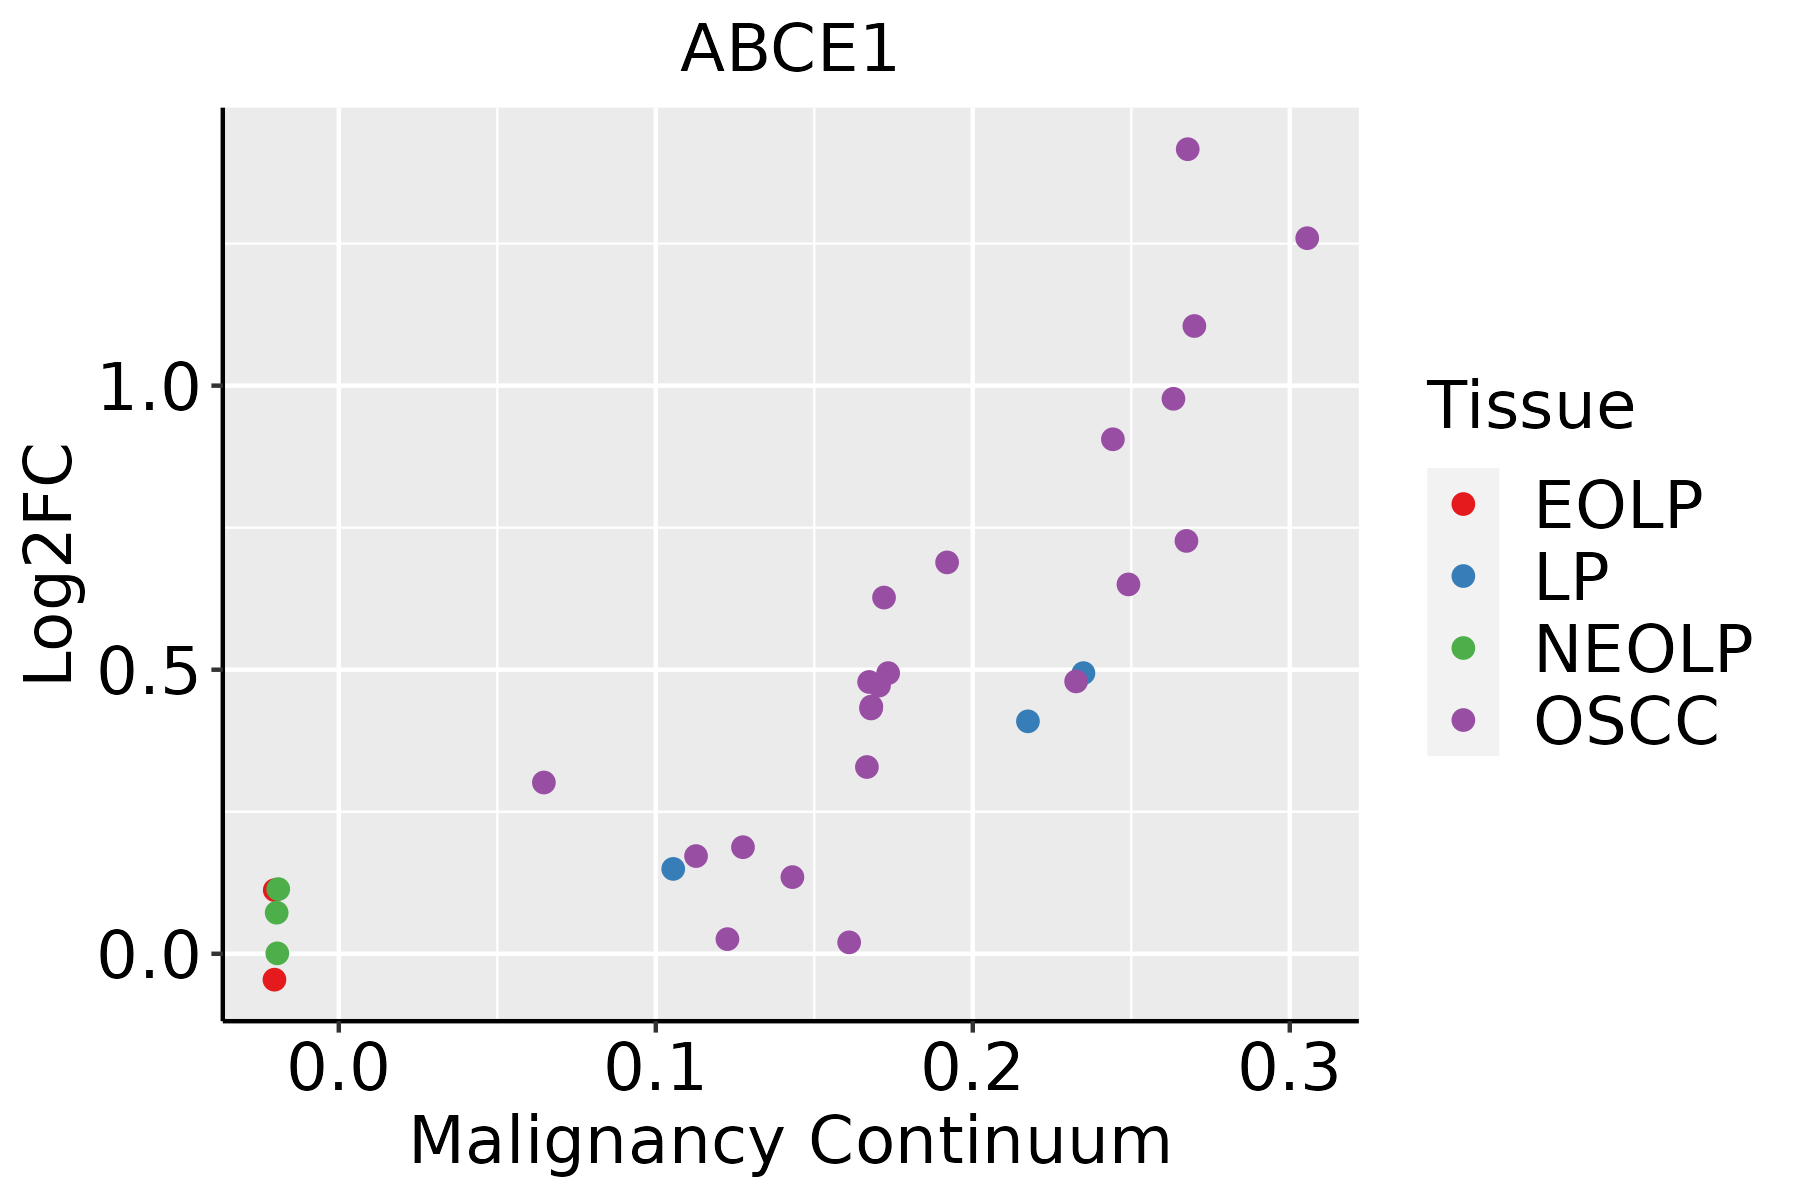 | EOLP: Erosive Oral lichen planus |
| LP: leukoplakia | ||
| NEOLP: Non-erosive oral lichen planus | ||
| OSCC: Oral squamous cell carcinoma | ||
| Skin | 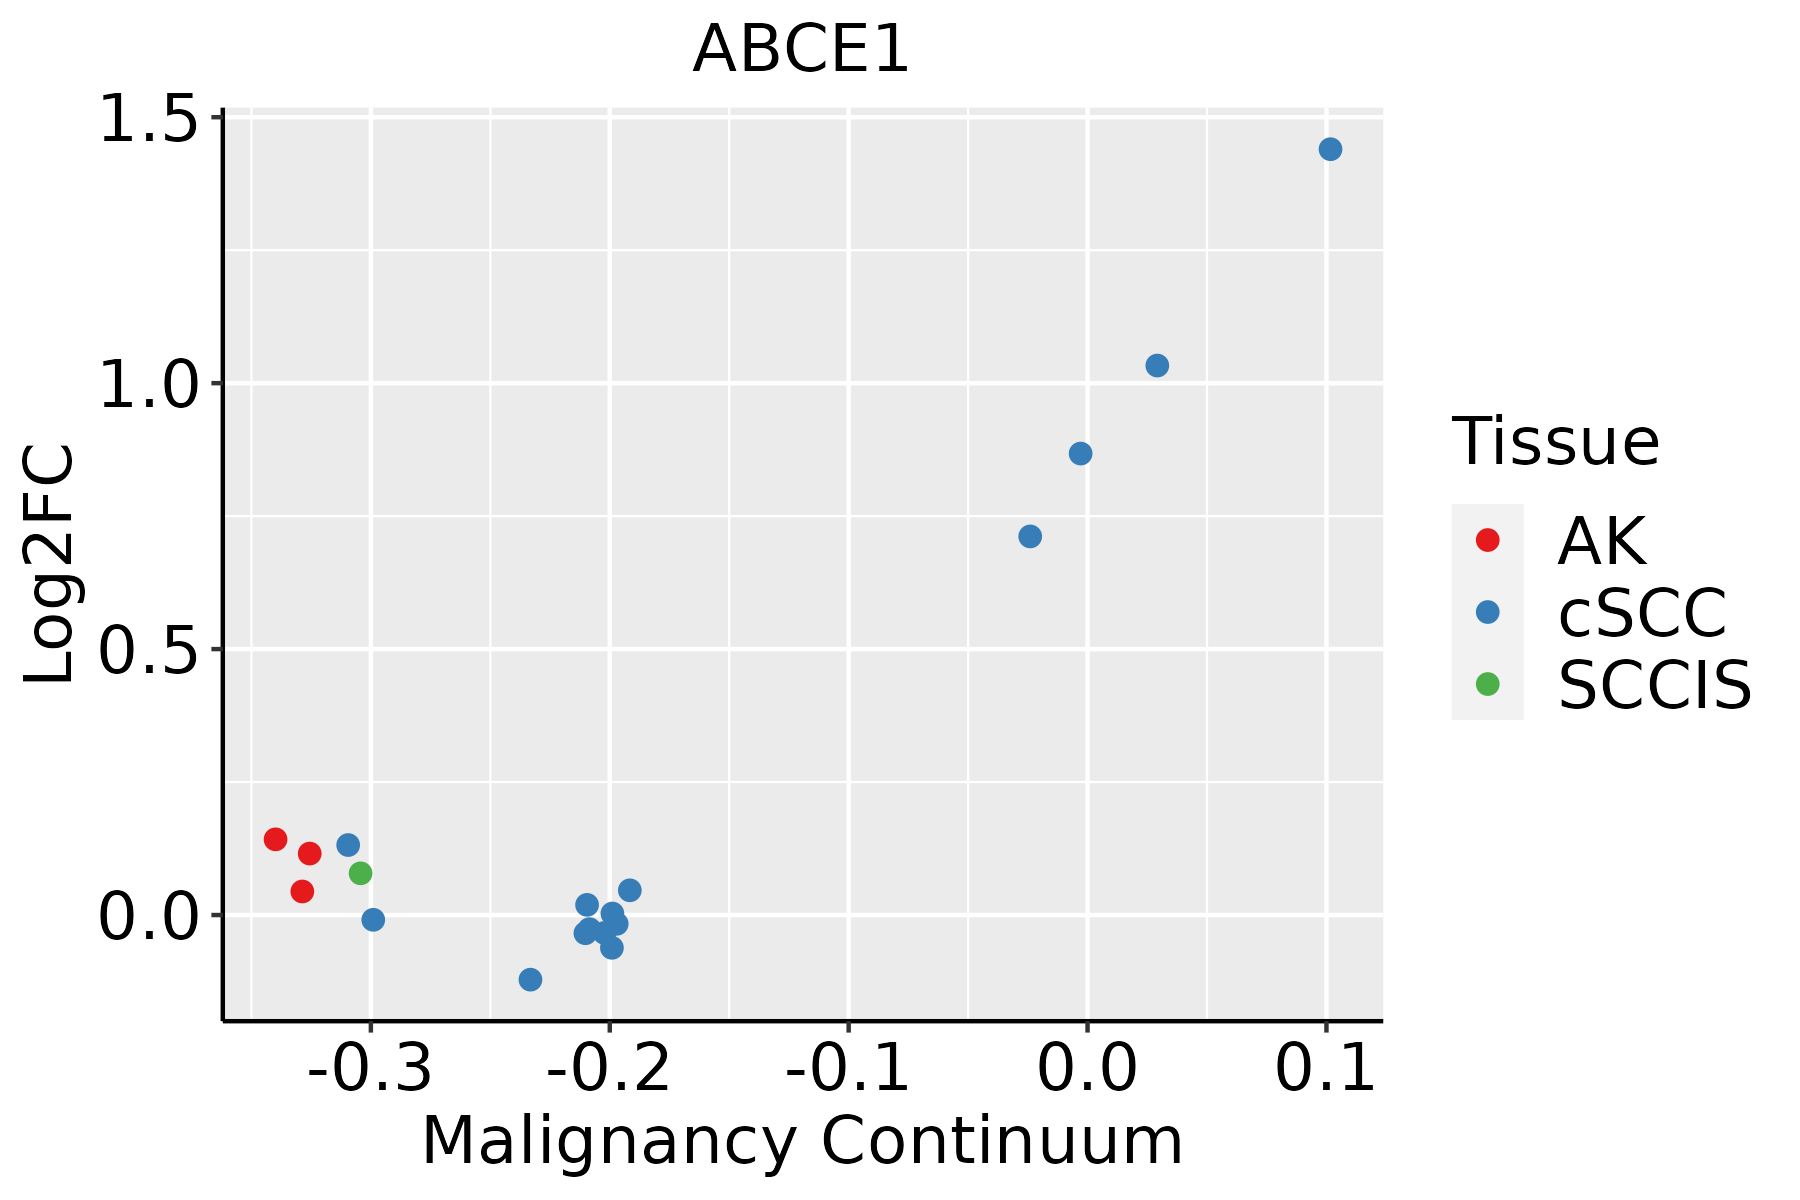 | AK: Actinic keratosis |
| cSCC: Cutaneous squamous cell carcinoma | ||
| SCCIS:squamous cell carcinoma in situ | ||
| Thyroid | 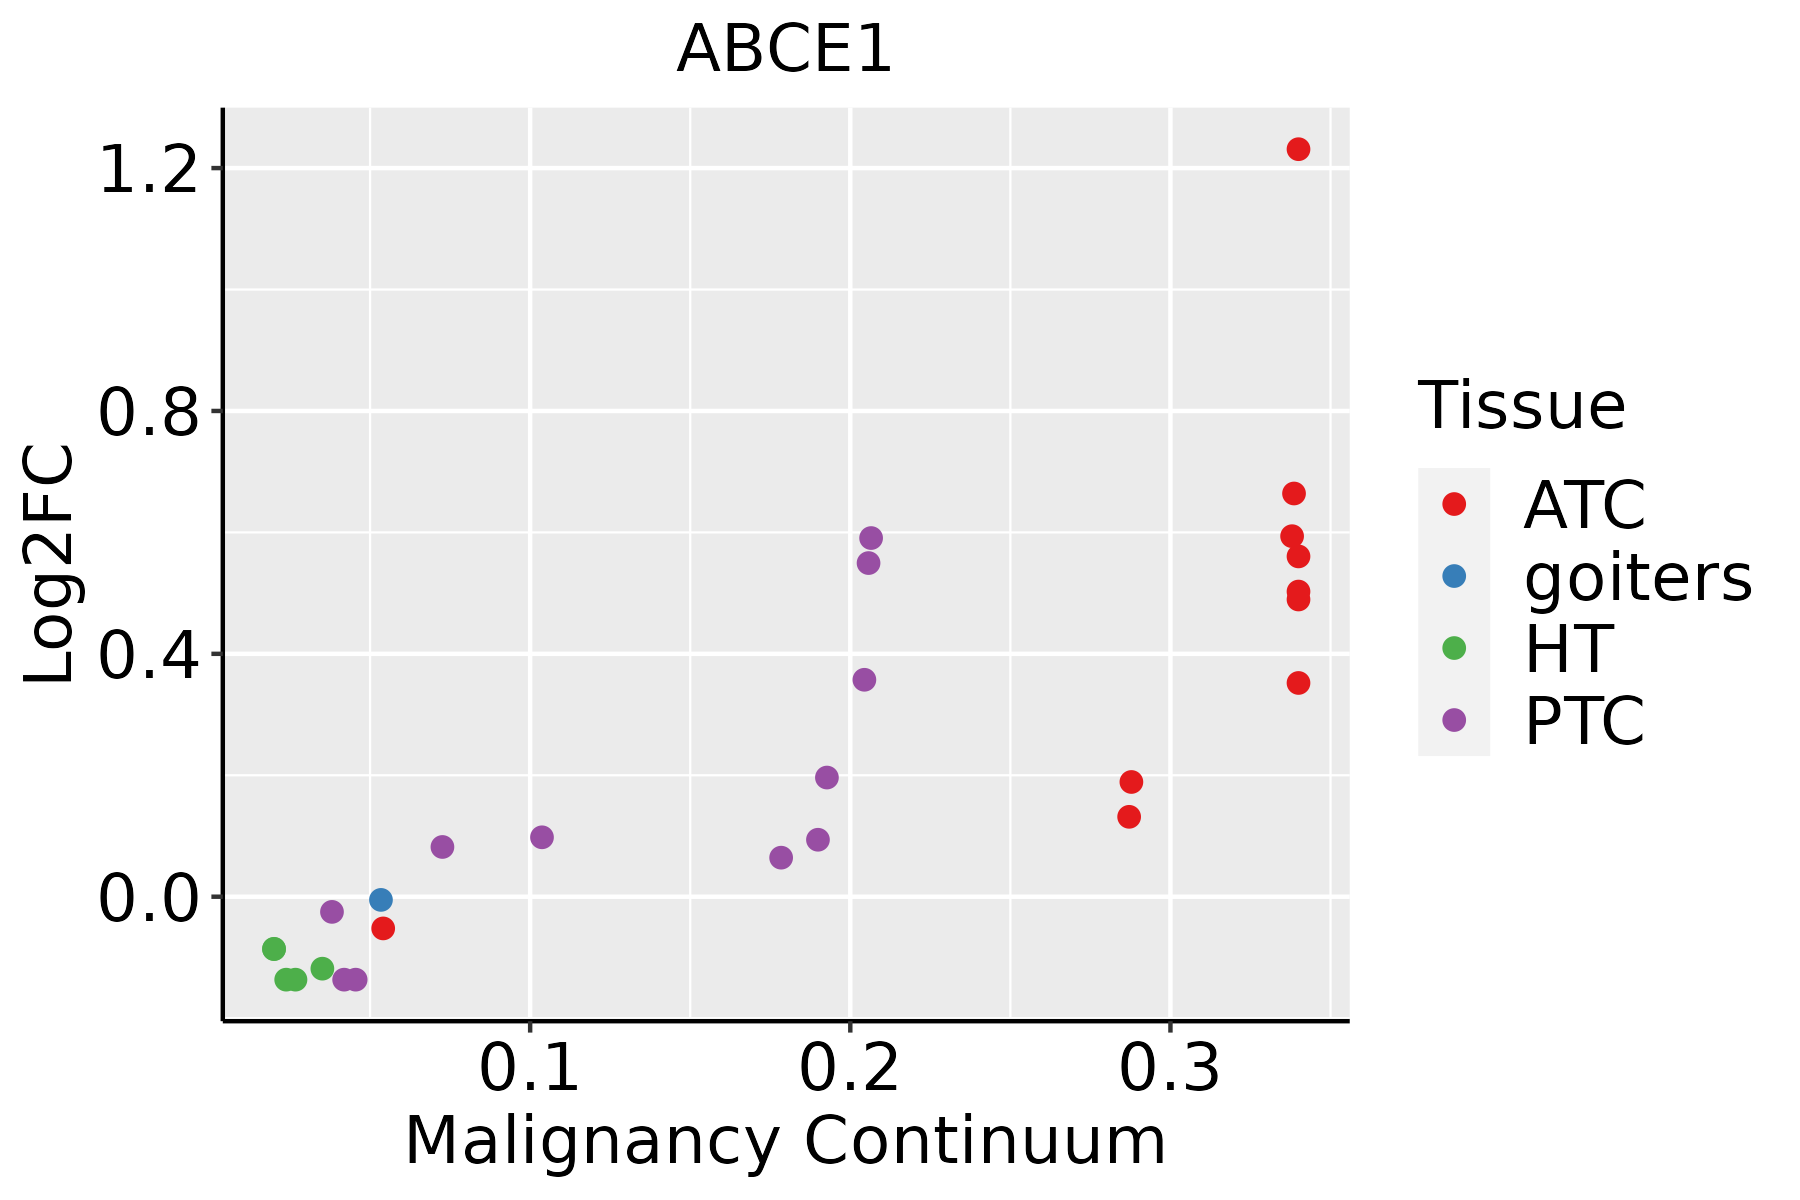 | ATC: Anaplastic thyroid cancer |
| HT: Hashimoto's thyroiditis | ||
| PTC: Papillary thyroid cancer |
| ∗log2FC in expression of this searched gene in stem-like cells from each diseased tissue sample relative to stem-like cells in normal samples in each tissue plotted against the malignancy continuum. Samples are colored based on if they are from different disease stage. |
Top |
Malignant transformation related pathway analysis |
| Find out the enriched GO biological processes and KEGG pathways involved in transition from healthy to precancer to cancer |
| Tissue | Disease Stage | Enriched GO biological Processes |
| Colorectum | AD |  |
| Colorectum | SER |  |
| Colorectum | MSS |  |
| Colorectum | MSI-H |  |
| Colorectum | FAP |  |
| ∗Top 15 enriched GO BP terms are showed in the bar plot of each disease state in each tissue. Each row represents a significant GO biological process which is colored according to the -log10(p.adjust). |
| Page: 1 2 3 4 5 6 7 8 9 |
| GO ID | Tissue | Disease Stage | Description | Gene Ratio | Bg Ratio | pvalue | p.adjust | Count |
| GO:002261327 | Esophagus | HGIN | ribonucleoprotein complex biogenesis | 158/2587 | 463/18723 | 2.61e-29 | 5.23e-26 | 158 |
| GO:000641727 | Esophagus | HGIN | regulation of translation | 139/2587 | 468/18723 | 1.46e-19 | 7.98e-17 | 139 |
| GO:004225426 | Esophagus | HGIN | ribosome biogenesis | 101/2587 | 299/18723 | 8.74e-19 | 4.03e-16 | 101 |
| GO:000641320 | Esophagus | HGIN | translational initiation | 55/2587 | 118/18723 | 7.33e-18 | 2.31e-15 | 55 |
| GO:000691319 | Esophagus | HGIN | nucleocytoplasmic transport | 83/2587 | 301/18723 | 2.14e-10 | 1.97e-08 | 83 |
| GO:005116919 | Esophagus | HGIN | nuclear transport | 83/2587 | 301/18723 | 2.14e-10 | 1.97e-08 | 83 |
| GO:005116819 | Esophagus | HGIN | nuclear export | 48/2587 | 154/18723 | 2.21e-08 | 1.34e-06 | 48 |
| GO:002241120 | Esophagus | HGIN | cellular component disassembly | 102/2587 | 443/18723 | 8.31e-08 | 4.33e-06 | 102 |
| GO:005165616 | Esophagus | HGIN | establishment of organelle localization | 90/2587 | 390/18723 | 4.27e-07 | 1.94e-05 | 90 |
| GO:00711665 | Esophagus | HGIN | ribonucleoprotein complex localization | 23/2587 | 77/18723 | 2.00e-04 | 3.72e-03 | 23 |
| GO:00315035 | Esophagus | HGIN | protein-containing complex localization | 50/2587 | 220/18723 | 2.18e-04 | 3.98e-03 | 50 |
| GO:003298415 | Esophagus | HGIN | protein-containing complex disassembly | 50/2587 | 224/18723 | 3.43e-04 | 5.56e-03 | 50 |
| GO:00714265 | Esophagus | HGIN | ribonucleoprotein complex export from nucleus | 22/2587 | 76/18723 | 4.44e-04 | 6.62e-03 | 22 |
| GO:00000547 | Esophagus | HGIN | ribosomal subunit export from nucleus | 7/2587 | 14/18723 | 1.34e-03 | 1.57e-02 | 7 |
| GO:00337507 | Esophagus | HGIN | ribosome localization | 7/2587 | 14/18723 | 1.34e-03 | 1.57e-02 | 7 |
| GO:00714284 | Esophagus | HGIN | rRNA-containing ribonucleoprotein complex export from nucleus | 7/2587 | 15/18723 | 2.22e-03 | 2.28e-02 | 7 |
| GO:005134620 | Esophagus | HGIN | negative regulation of hydrolase activity | 72/2587 | 379/18723 | 2.81e-03 | 2.75e-02 | 72 |
| GO:0022613111 | Esophagus | ESCC | ribonucleoprotein complex biogenesis | 365/8552 | 463/18723 | 1.74e-49 | 1.11e-45 | 365 |
| GO:0042254111 | Esophagus | ESCC | ribosome biogenesis | 252/8552 | 299/18723 | 3.27e-44 | 1.04e-40 | 252 |
| GO:0006913110 | Esophagus | ESCC | nucleocytoplasmic transport | 230/8552 | 301/18723 | 6.04e-28 | 2.02e-25 | 230 |
| Page: 1 2 3 4 5 6 7 |
| Pathway ID | Tissue | Disease Stage | Description | Gene Ratio | Bg Ratio | pvalue | p.adjust | qvalue | Count |
| Page: 1 |
Top |
Cell-cell communication analysis |
| Identification of potential cell-cell interactions between two cell types and their ligand-receptor pairs for different disease states |
| Ligand | Receptor | LRpair | Pathway | Tissue | Disease Stage |
| Page: 1 |
Top |
Single-cell gene regulatory network inference analysis |
| Find out the significant the regulons (TFs) and the target genes of each regulon across cell types for different disease states |
| TF | Cell Type | Tissue | Disease Stage | Target Gene | RSS | Regulon Activity |
| ∗The dot plots of a searched regulon are shown for all cell subpopulations in each disease state of each tissue based on the regulon specific score inferred using pySCENIC and by calculating the average expression. |
| Page: 1 |
Top |
Somatic mutation of malignant transformation related genes |
| Annotation of somatic variants for genes involved in malignant transformation |
| Hugo Symbol | Variant Class | Variant Classification | dbSNP RS | HGVSc | HGVSp | HGVSp Short | SWISSPROT | BIOTYPE | SIFT | PolyPhen | Tumor Sample Barcode | Tissue | Histology | Sex | Age | Stage | Therapy Types | Drugs | Outcome |
| ABCE1 | SNV | Missense_Mutation | c.1795N>T | p.Asp599Tyr | p.D599Y | P61221 | protein_coding | deleterious(0) | possibly_damaging(0.841) | TCGA-AC-A23H-01 | Breast | breast invasive carcinoma | Female | >=65 | I/II | Unknown | Unknown | PD | |
| ABCE1 | SNV | Missense_Mutation | novel | c.1586N>T | p.Ala529Val | p.A529V | P61221 | protein_coding | deleterious(0) | probably_damaging(0.932) | TCGA-B6-A402-01 | Breast | breast invasive carcinoma | Female | <65 | I/II | Chemotherapy | cyclophosphamide | PD |
| ABCE1 | SNV | Missense_Mutation | novel | c.81N>C | p.Lys27Asn | p.K27N | P61221 | protein_coding | tolerated(0.15) | benign(0.151) | TCGA-BH-A0B6-01 | Breast | breast invasive carcinoma | Female | <65 | I/II | Unknown | Unknown | SD |
| ABCE1 | SNV | Missense_Mutation | c.1462C>G | p.Pro488Ala | p.P488A | P61221 | protein_coding | deleterious(0) | probably_damaging(1) | TCGA-BH-A1EN-01 | Breast | breast invasive carcinoma | Female | >=65 | I/II | Unknown | Unknown | SD | |
| ABCE1 | SNV | Missense_Mutation | c.869N>G | p.Tyr290Cys | p.Y290C | P61221 | protein_coding | deleterious(0) | probably_damaging(0.991) | TCGA-EW-A1J3-01 | Breast | breast invasive carcinoma | Female | <65 | I/II | Chemotherapy | carboplatin | SD | |
| ABCE1 | SNV | Missense_Mutation | novel | c.451G>A | p.Glu151Lys | p.E151K | P61221 | protein_coding | deleterious(0) | probably_damaging(0.96) | TCGA-PE-A5DE-01 | Breast | breast invasive carcinoma | Female | <65 | I/II | Chemotherapy | taxotere | CR |
| ABCE1 | SNV | Missense_Mutation | c.1524A>G | p.Ile508Met | p.I508M | P61221 | protein_coding | deleterious(0.05) | possibly_damaging(0.903) | TCGA-A6-5665-01 | Colorectum | colon adenocarcinoma | Female | >=65 | I/II | Unknown | Unknown | PD | |
| ABCE1 | SNV | Missense_Mutation | rs550948053 | c.1273C>T | p.Arg425Cys | p.R425C | P61221 | protein_coding | deleterious(0) | probably_damaging(0.988) | TCGA-AA-3510-01 | Colorectum | colon adenocarcinoma | Male | >=65 | I/II | Unknown | Unknown | SD |
| ABCE1 | SNV | Missense_Mutation | c.347A>T | p.Lys116Met | p.K116M | P61221 | protein_coding | deleterious(0) | probably_damaging(0.994) | TCGA-AA-3663-01 | Colorectum | colon adenocarcinoma | Male | <65 | I/II | Unknown | Unknown | SD | |
| ABCE1 | SNV | Missense_Mutation | c.533A>G | p.Lys178Arg | p.K178R | P61221 | protein_coding | tolerated(0.35) | benign(0.03) | TCGA-AA-3663-01 | Colorectum | colon adenocarcinoma | Male | <65 | I/II | Unknown | Unknown | SD |
| Page: 1 2 3 4 5 6 |
Top |
Related drugs of malignant transformation related genes |
| Identification of chemicals and drugs interact with genes involved in malignant transfromation |
| (DGIdb 4.0) |
| Entrez ID | Symbol | Category | Interaction Types | Drug Claim Name | Drug Name | PMIDs |
| Page: 1 |

Copyright 2023-Present -The University of Texas Health Science Center at Houston |