
|
|||||
|
 | |
| |
| |
| |
| |
| |
|
Gene: ABCD3 |
Gene summary for ABCD3 |
| Gene information | Species | Human | Gene symbol | ABCD3 | Gene ID | 5825 |
| Gene name | ATP binding cassette subfamily D member 3 | |
| Gene Alias | ABC43 | |
| Cytomap | 1p21.3 | |
| Gene Type | protein-coding | GO ID | GO:0000038 | UniProtAcc | P28288 |
Top |
Malignant transformation analysis |
| Identification of the aberrant gene expression in precancerous and cancerous lesions by comparing the gene expression of stem-like cells in diseased tissues with normal stem cells |
| Entrez ID | Symbol | Replicates | Species | Organ | Tissue | Adj P-value | Log2FC | Malignancy |
| 5825 | ABCD3 | HTA11_3410_2000001011 | Human | Colorectum | AD | 2.81e-19 | -6.16e-01 | 0.0155 |
| 5825 | ABCD3 | HTA11_696_2000001011 | Human | Colorectum | AD | 3.38e-07 | -2.76e-01 | -0.1464 |
| 5825 | ABCD3 | HTA11_866_2000001011 | Human | Colorectum | AD | 5.70e-04 | -3.01e-01 | -0.1001 |
| 5825 | ABCD3 | HTA11_866_3004761011 | Human | Colorectum | AD | 1.60e-06 | -4.53e-01 | 0.096 |
| 5825 | ABCD3 | HTA11_10711_2000001011 | Human | Colorectum | AD | 2.48e-05 | -5.17e-01 | 0.0338 |
| 5825 | ABCD3 | HTA11_7696_3000711011 | Human | Colorectum | AD | 8.79e-12 | -3.76e-01 | 0.0674 |
| 5825 | ABCD3 | HTA11_6818_2000001021 | Human | Colorectum | AD | 1.22e-02 | -4.04e-01 | 0.0588 |
| 5825 | ABCD3 | HTA11_99999970781_79442 | Human | Colorectum | MSS | 7.65e-03 | -3.33e-01 | 0.294 |
| 5825 | ABCD3 | HTA11_99999973899_84307 | Human | Colorectum | MSS | 2.62e-03 | -5.26e-01 | 0.2585 |
| 5825 | ABCD3 | HTA11_99999974143_84620 | Human | Colorectum | MSS | 4.20e-19 | -5.36e-01 | 0.3005 |
| 5825 | ABCD3 | A001-C-207 | Human | Colorectum | FAP | 2.56e-02 | -2.28e-01 | 0.1278 |
| 5825 | ABCD3 | A015-C-203 | Human | Colorectum | FAP | 1.45e-22 | -4.26e-01 | -0.1294 |
| 5825 | ABCD3 | A015-C-204 | Human | Colorectum | FAP | 4.98e-07 | -3.69e-01 | -0.0228 |
| 5825 | ABCD3 | A014-C-040 | Human | Colorectum | FAP | 3.20e-03 | -3.10e-01 | -0.1184 |
| 5825 | ABCD3 | A002-C-201 | Human | Colorectum | FAP | 6.24e-13 | -3.33e-01 | 0.0324 |
| 5825 | ABCD3 | A002-C-203 | Human | Colorectum | FAP | 2.37e-05 | -2.69e-01 | 0.2786 |
| 5825 | ABCD3 | A001-C-119 | Human | Colorectum | FAP | 5.02e-10 | -5.20e-01 | -0.1557 |
| 5825 | ABCD3 | A001-C-108 | Human | Colorectum | FAP | 7.74e-17 | -4.41e-01 | -0.0272 |
| 5825 | ABCD3 | A002-C-205 | Human | Colorectum | FAP | 8.82e-21 | -4.45e-01 | -0.1236 |
| 5825 | ABCD3 | A001-C-104 | Human | Colorectum | FAP | 6.49e-06 | -3.19e-01 | 0.0184 |
| Page: 1 2 3 4 5 6 7 8 |
| Tissue | Expression Dynamics | Abbreviation |
| Colorectum (GSE201348) |  | FAP: Familial adenomatous polyposis |
| CRC: Colorectal cancer | ||
| Colorectum (HTA11) |  | AD: Adenomas |
| SER: Sessile serrated lesions | ||
| MSI-H: Microsatellite-high colorectal cancer | ||
| MSS: Microsatellite stable colorectal cancer | ||
| Esophagus | 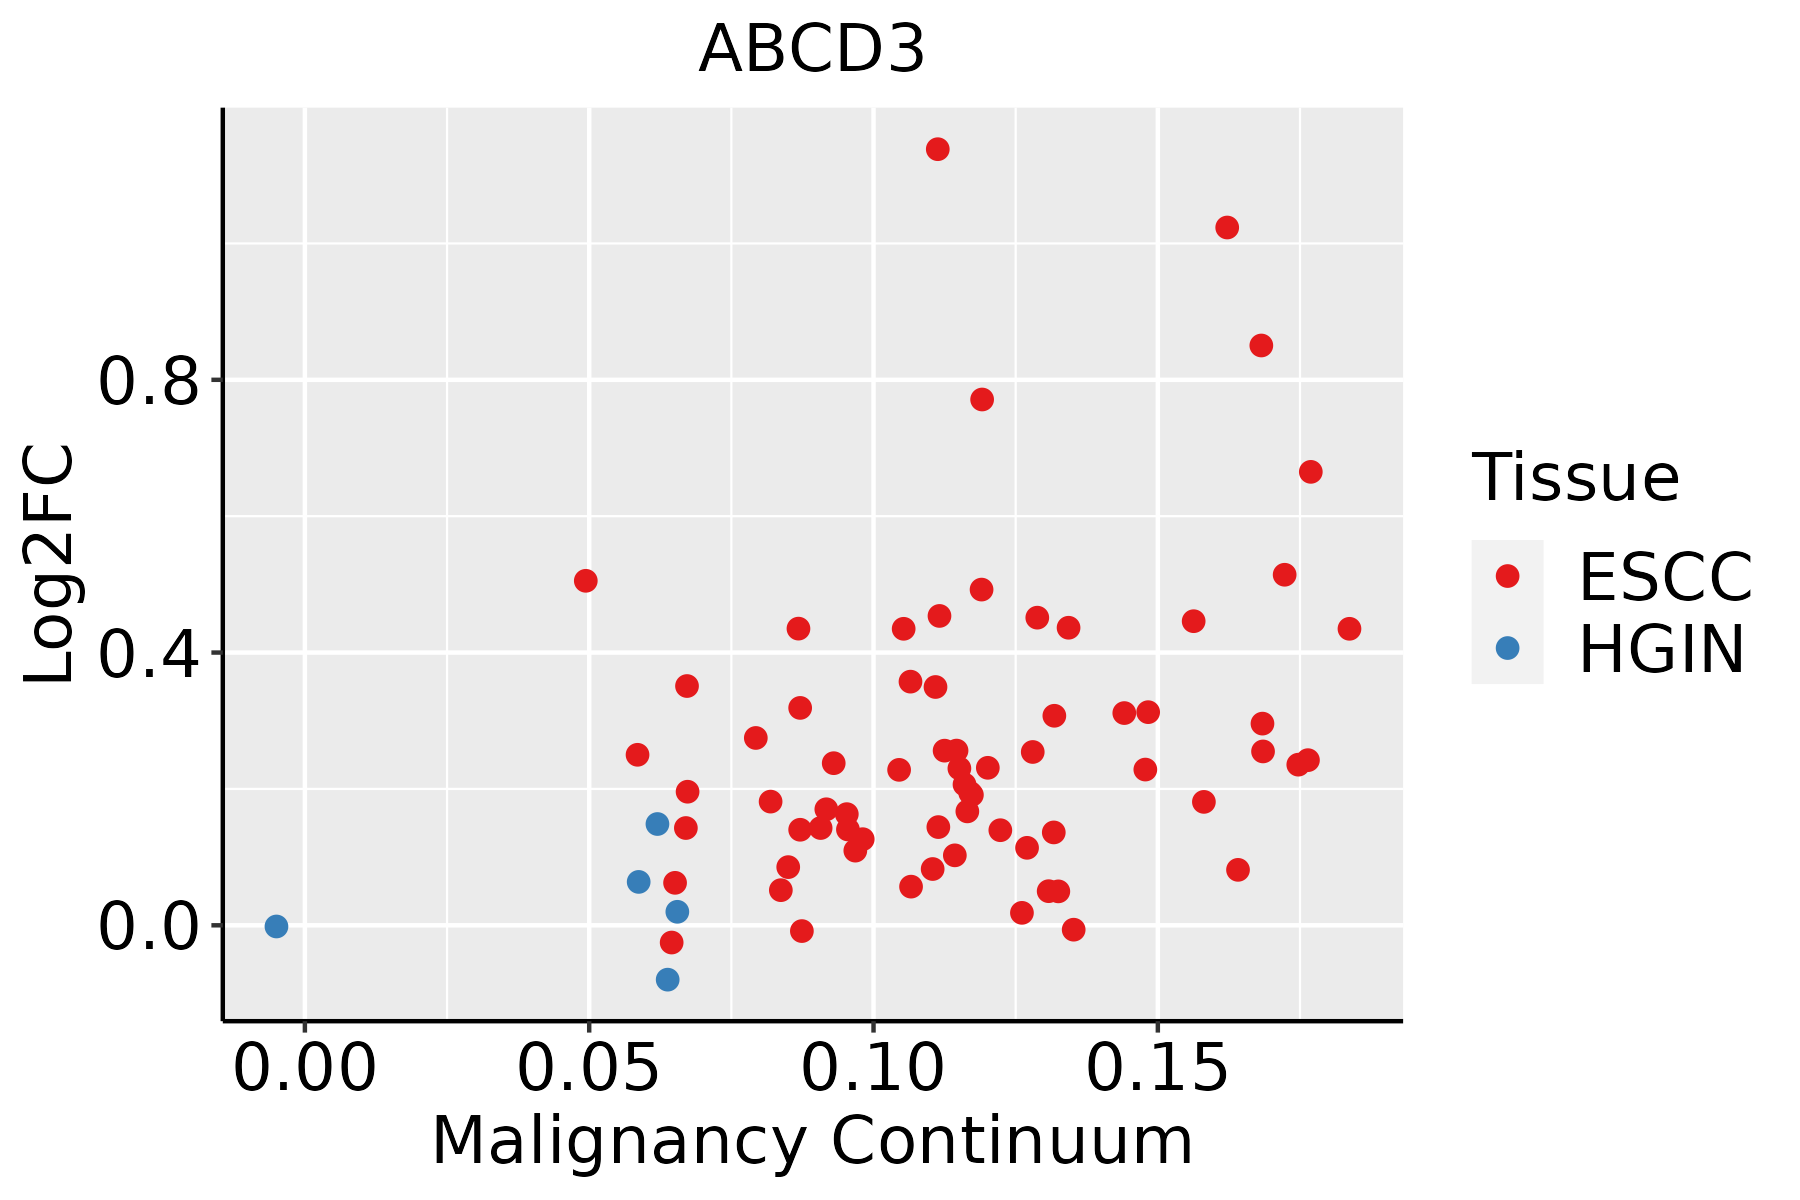 | ESCC: Esophageal squamous cell carcinoma |
| HGIN: High-grade intraepithelial neoplasias | ||
| LGIN: Low-grade intraepithelial neoplasias | ||
| Liver | 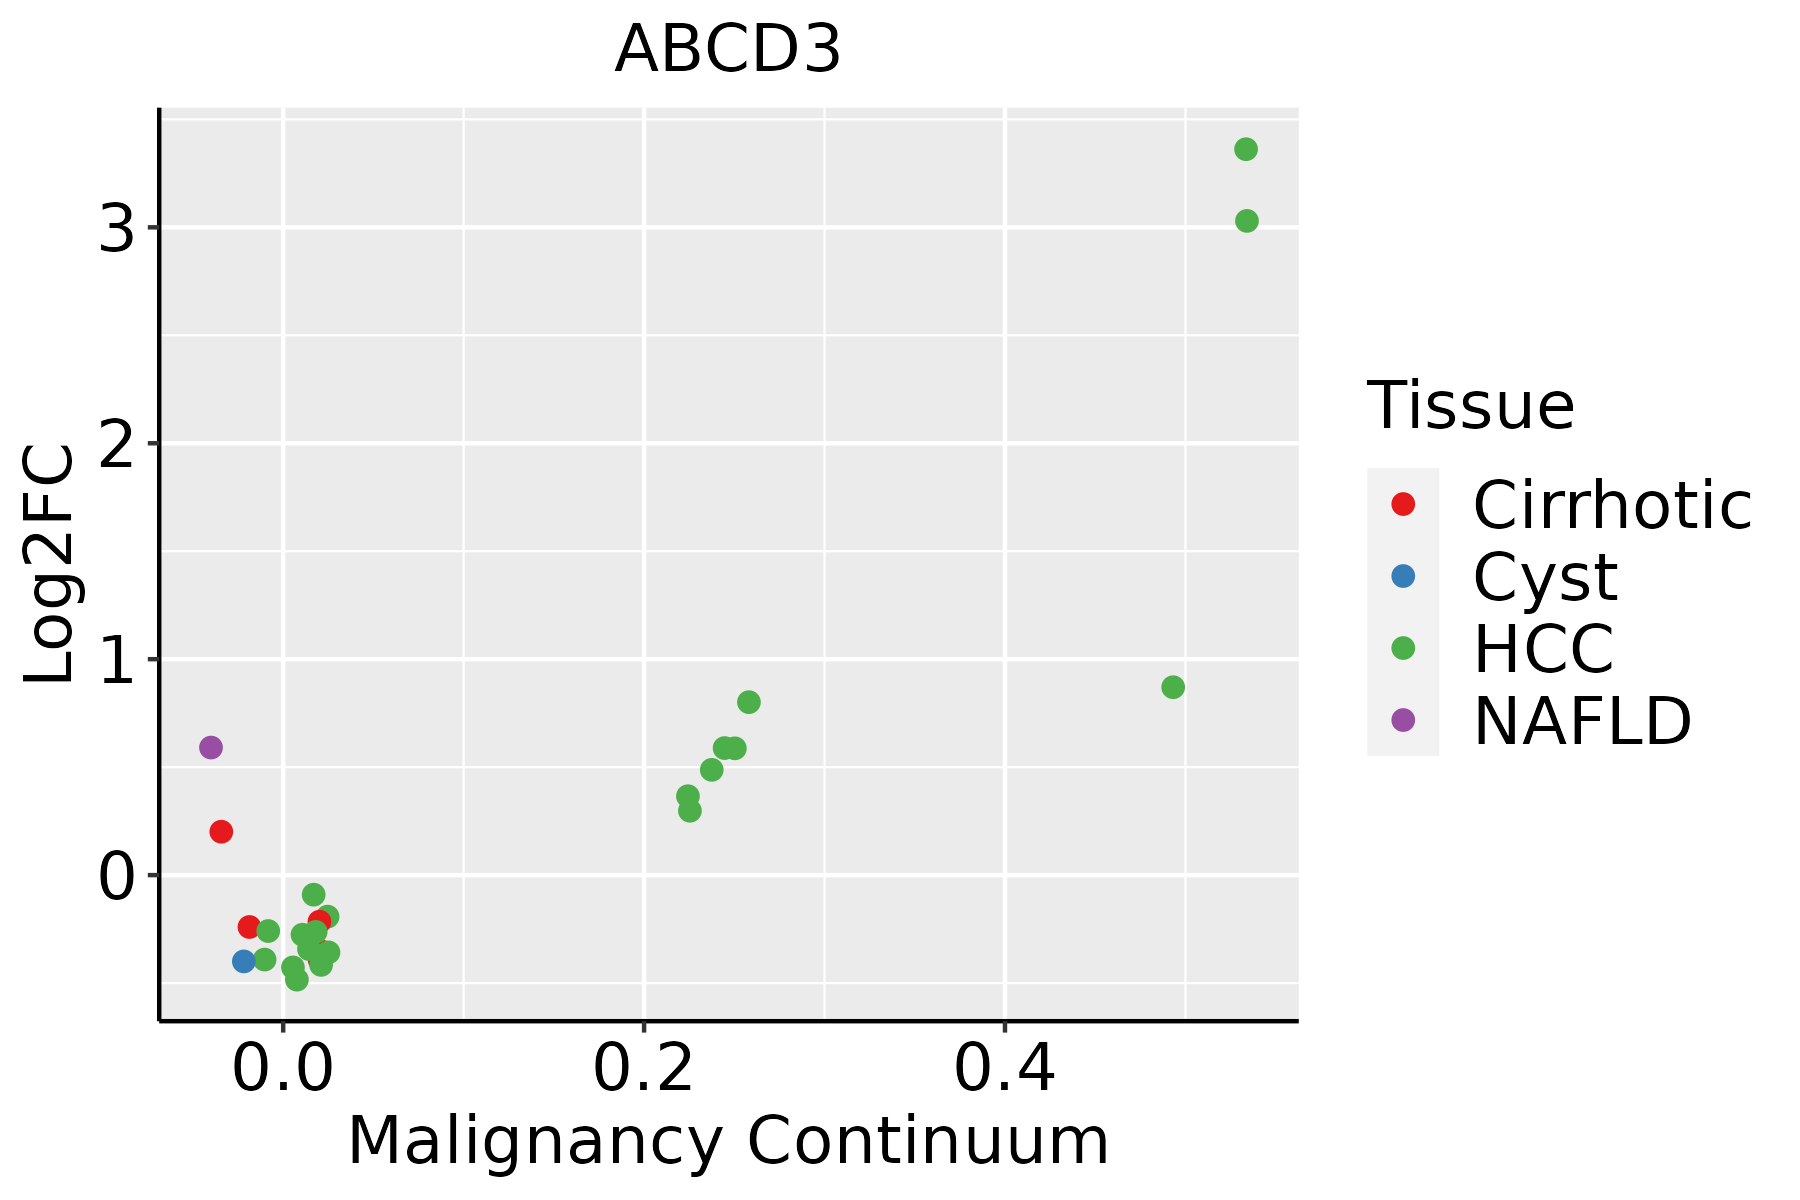 | HCC: Hepatocellular carcinoma |
| NAFLD: Non-alcoholic fatty liver disease | ||
| Lung | 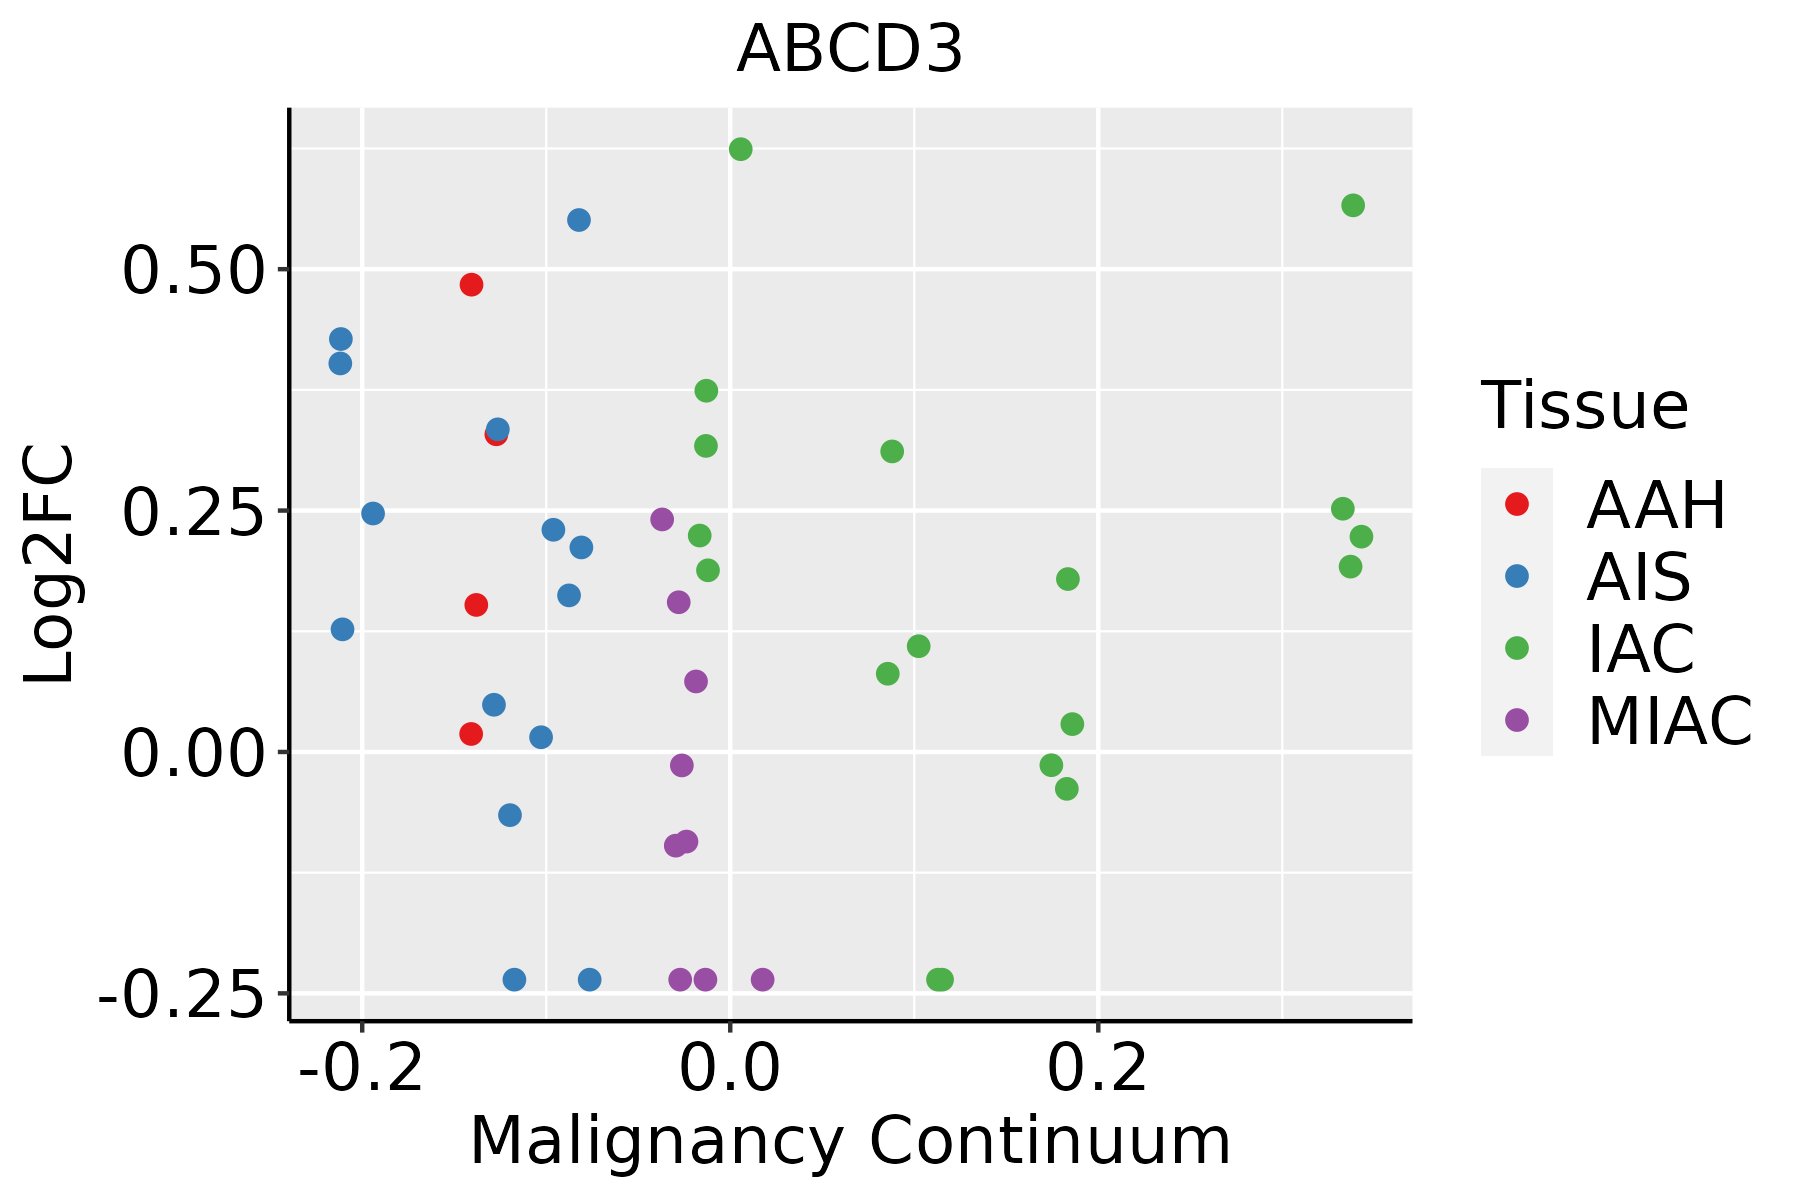 | AAH: Atypical adenomatous hyperplasia |
| AIS: Adenocarcinoma in situ | ||
| IAC: Invasive lung adenocarcinoma | ||
| MIA: Minimally invasive adenocarcinoma | ||
| Oral Cavity | 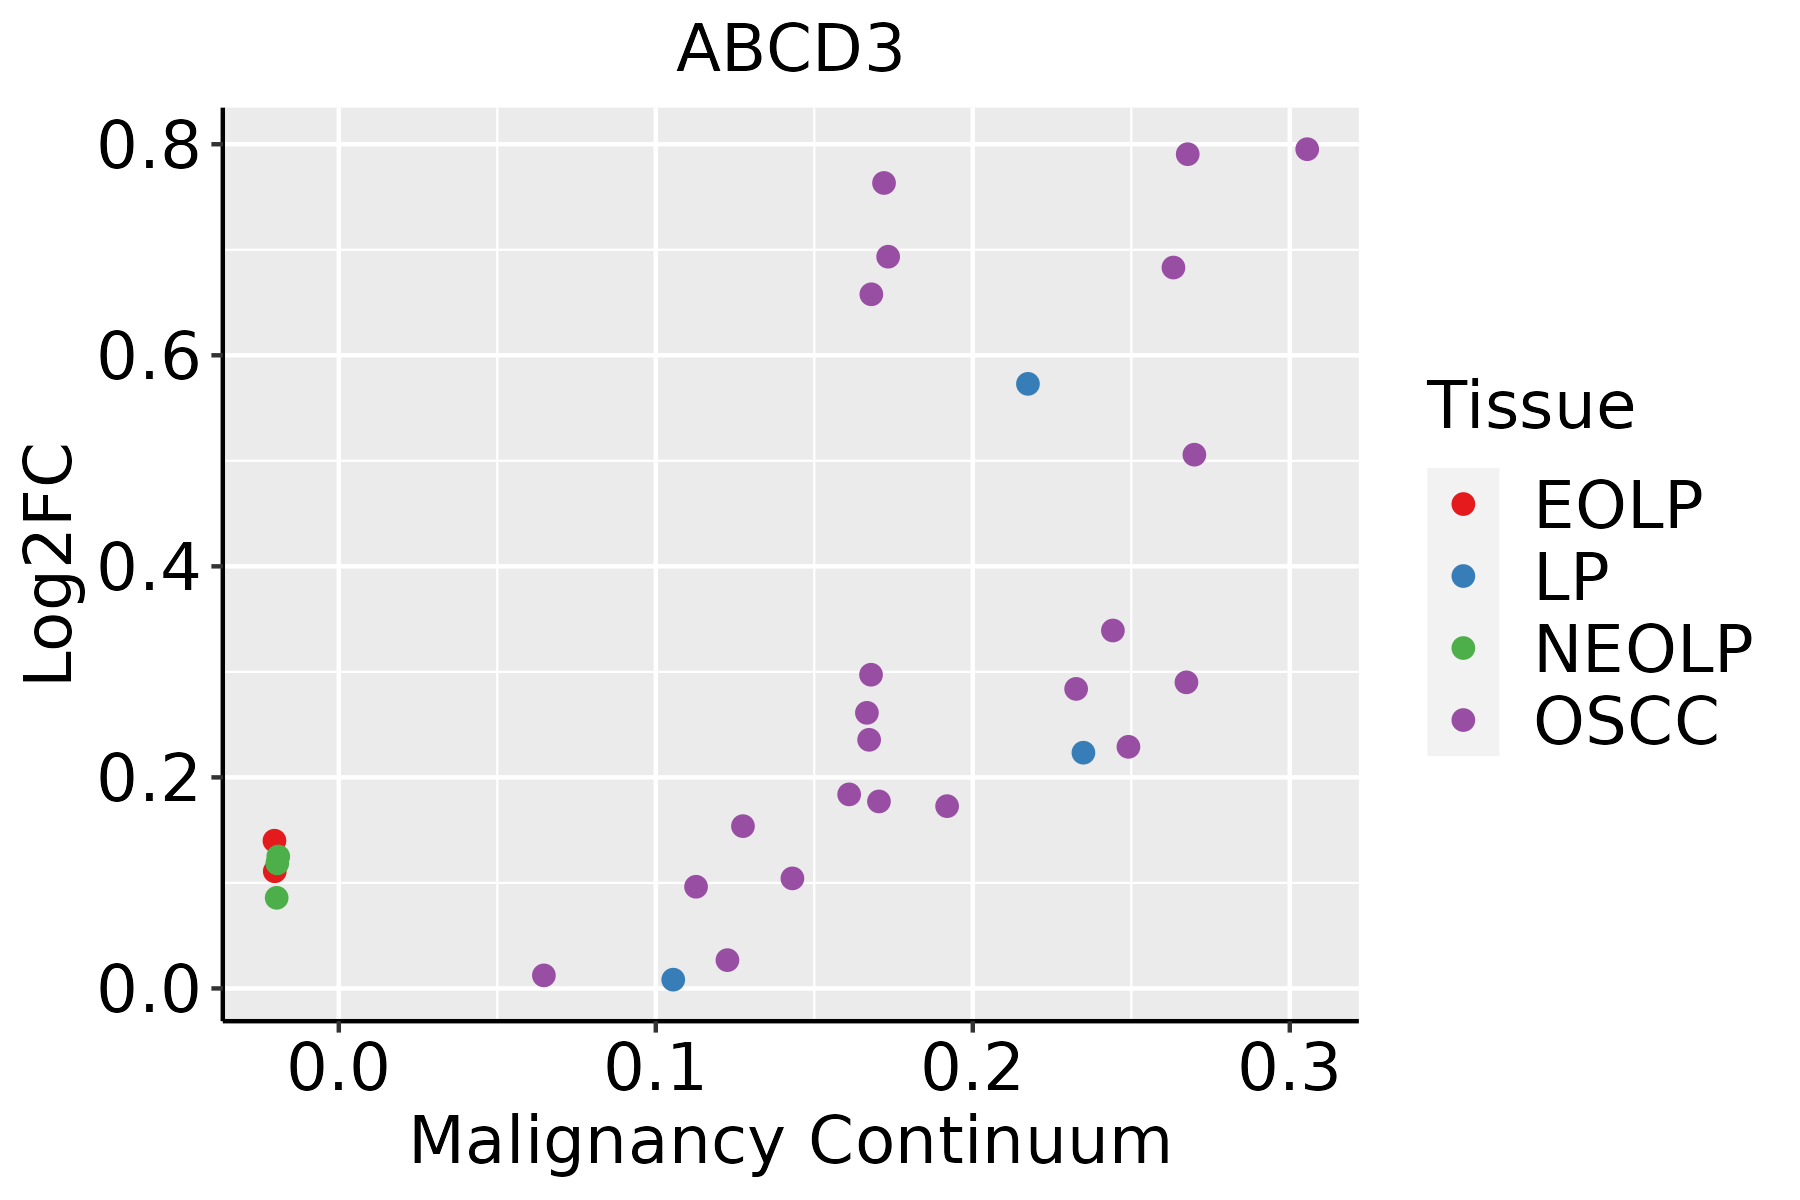 | EOLP: Erosive Oral lichen planus |
| LP: leukoplakia | ||
| NEOLP: Non-erosive oral lichen planus | ||
| OSCC: Oral squamous cell carcinoma | ||
| Skin | 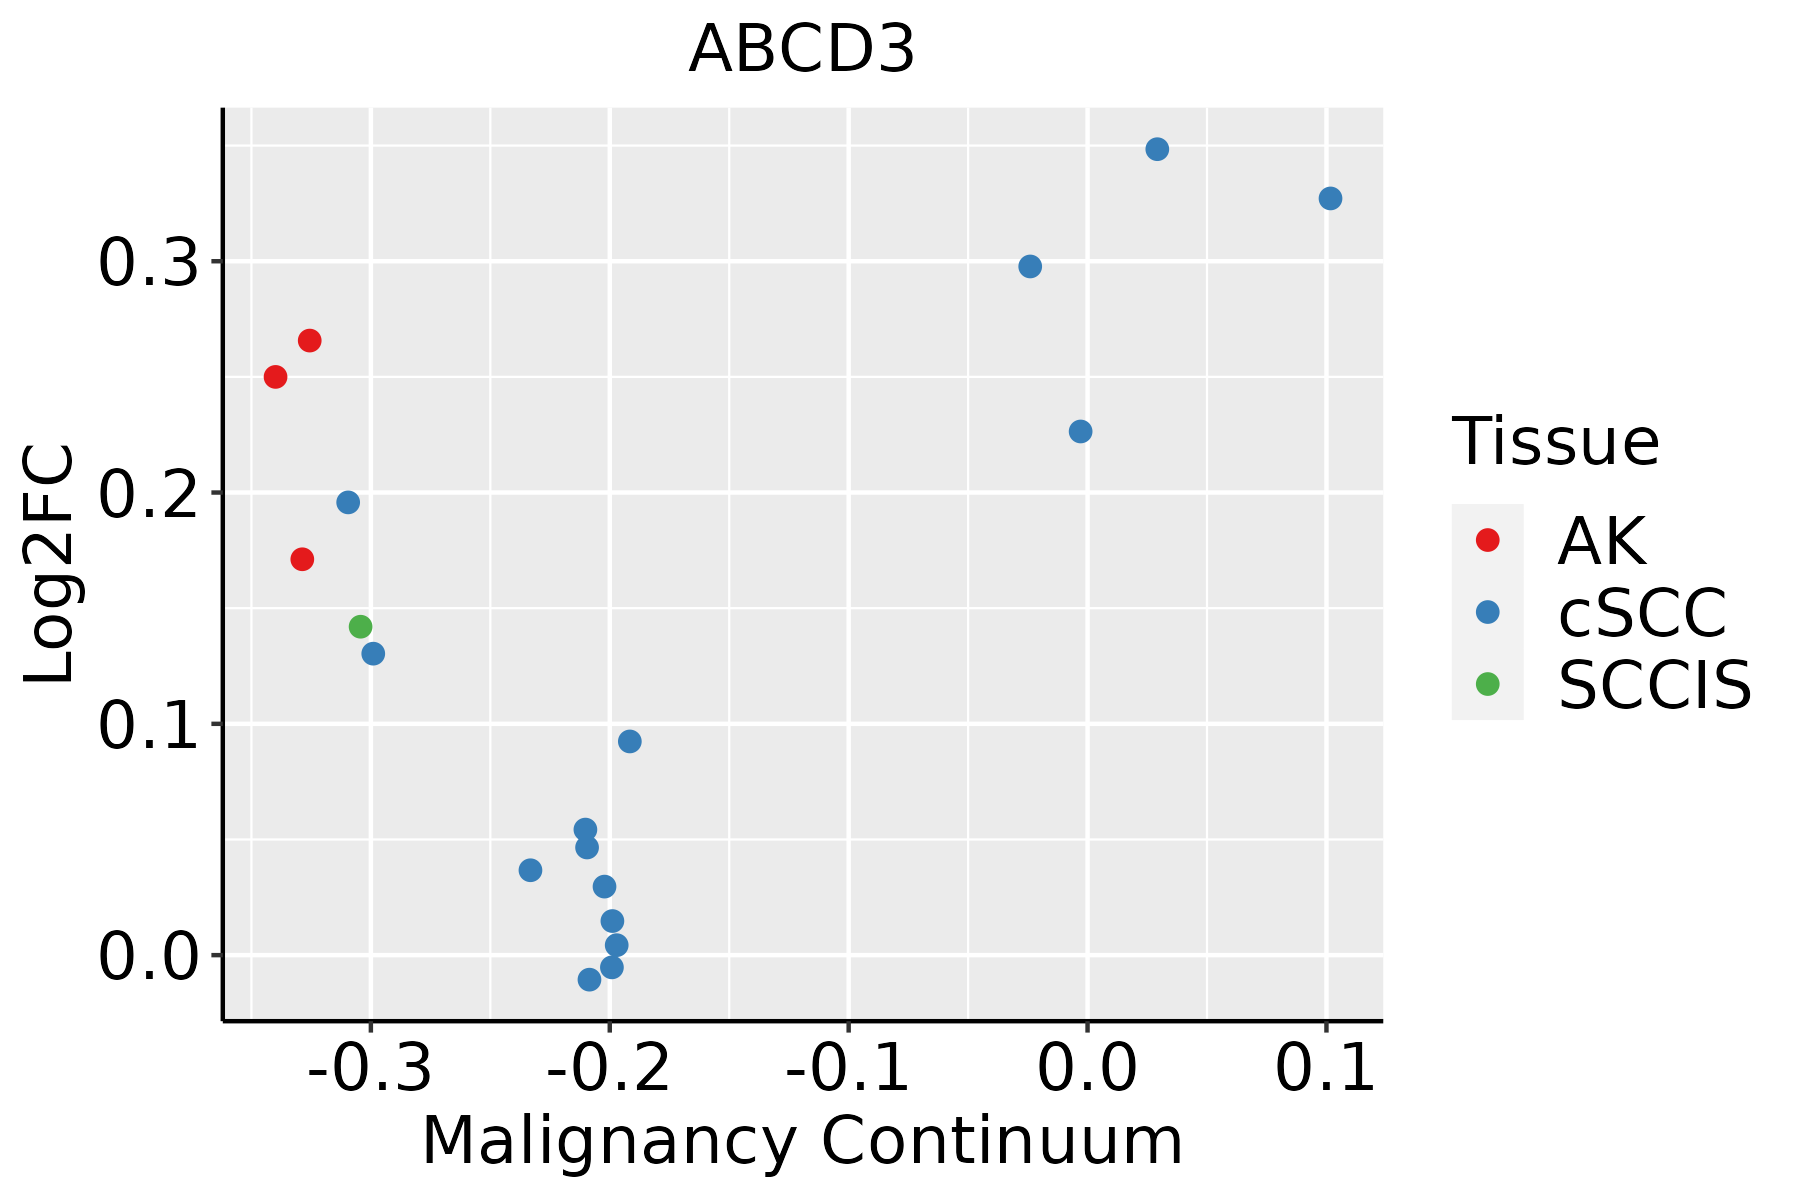 | AK: Actinic keratosis |
| cSCC: Cutaneous squamous cell carcinoma | ||
| SCCIS:squamous cell carcinoma in situ | ||
| Thyroid |  | ATC: Anaplastic thyroid cancer |
| HT: Hashimoto's thyroiditis | ||
| PTC: Papillary thyroid cancer |
| ∗log2FC in expression of this searched gene in stem-like cells from each diseased tissue sample relative to stem-like cells in normal samples in each tissue plotted against the malignancy continuum. Samples are colored based on if they are from different disease stage. |
Top |
Malignant transformation related pathway analysis |
| Find out the enriched GO biological processes and KEGG pathways involved in transition from healthy to precancer to cancer |
| Tissue | Disease Stage | Enriched GO biological Processes |
| Colorectum | AD |  |
| Colorectum | SER |  |
| Colorectum | MSS |  |
| Colorectum | MSI-H |  |
| Colorectum | FAP |  |
| ∗Top 15 enriched GO BP terms are showed in the bar plot of each disease state in each tissue. Each row represents a significant GO biological process which is colored according to the -log10(p.adjust). |
| Page: 1 2 3 4 5 6 7 8 9 |
| GO ID | Tissue | Disease Stage | Description | Gene Ratio | Bg Ratio | pvalue | p.adjust | Count |
| GO:0044282 | Colorectum | AD | small molecule catabolic process | 118/3918 | 376/18723 | 1.05e-06 | 3.55e-05 | 118 |
| GO:0006635 | Colorectum | AD | fatty acid beta-oxidation | 33/3918 | 74/18723 | 3.98e-06 | 1.09e-04 | 33 |
| GO:0009062 | Colorectum | AD | fatty acid catabolic process | 41/3918 | 100/18723 | 4.02e-06 | 1.09e-04 | 41 |
| GO:0019395 | Colorectum | AD | fatty acid oxidation | 40/3918 | 103/18723 | 2.43e-05 | 4.69e-04 | 40 |
| GO:0016042 | Colorectum | AD | lipid catabolic process | 97/3918 | 320/18723 | 4.31e-05 | 7.56e-04 | 97 |
| GO:0006631 | Colorectum | AD | fatty acid metabolic process | 114/3918 | 390/18723 | 5.58e-05 | 9.44e-04 | 114 |
| GO:0072329 | Colorectum | AD | monocarboxylic acid catabolic process | 44/3918 | 122/18723 | 8.05e-05 | 1.28e-03 | 44 |
| GO:0034440 | Colorectum | AD | lipid oxidation | 40/3918 | 108/18723 | 8.52e-05 | 1.32e-03 | 40 |
| GO:0030258 | Colorectum | AD | lipid modification | 67/3918 | 212/18723 | 1.66e-04 | 2.27e-03 | 67 |
| GO:0009410 | Colorectum | AD | response to xenobiotic stimulus | 128/3918 | 462/18723 | 2.69e-04 | 3.31e-03 | 128 |
| GO:0016054 | Colorectum | AD | organic acid catabolic process | 73/3918 | 240/18723 | 3.20e-04 | 3.81e-03 | 73 |
| GO:0044242 | Colorectum | AD | cellular lipid catabolic process | 66/3918 | 214/18723 | 3.96e-04 | 4.50e-03 | 66 |
| GO:0046395 | Colorectum | AD | carboxylic acid catabolic process | 70/3918 | 236/18723 | 9.06e-04 | 8.71e-03 | 70 |
| GO:0010876 | Colorectum | AD | lipid localization | 120/3918 | 448/18723 | 1.59e-03 | 1.33e-02 | 120 |
| GO:0006869 | Colorectum | AD | lipid transport | 108/3918 | 398/18723 | 1.67e-03 | 1.39e-02 | 108 |
| GO:0008202 | Colorectum | AD | steroid metabolic process | 85/3918 | 319/18723 | 8.07e-03 | 4.75e-02 | 85 |
| GO:00090622 | Colorectum | MSS | fatty acid catabolic process | 32/3467 | 100/18723 | 8.28e-04 | 8.67e-03 | 32 |
| GO:00442822 | Colorectum | MSS | small molecule catabolic process | 94/3467 | 376/18723 | 9.85e-04 | 9.86e-03 | 94 |
| GO:00302582 | Colorectum | MSS | lipid modification | 57/3467 | 212/18723 | 1.64e-03 | 1.49e-02 | 57 |
| GO:00066312 | Colorectum | MSS | fatty acid metabolic process | 95/3467 | 390/18723 | 2.20e-03 | 1.84e-02 | 95 |
| Page: 1 2 3 4 5 6 7 8 9 |
| Pathway ID | Tissue | Disease Stage | Description | Gene Ratio | Bg Ratio | pvalue | p.adjust | qvalue | Count |
| hsa041467 | Esophagus | ESCC | Peroxisome | 55/4205 | 82/8465 | 1.04e-03 | 3.27e-03 | 1.68e-03 | 55 |
| hsa0414612 | Esophagus | ESCC | Peroxisome | 55/4205 | 82/8465 | 1.04e-03 | 3.27e-03 | 1.68e-03 | 55 |
| hsa02010 | Liver | NAFLD | ABC transporters | 16/1043 | 45/8465 | 4.97e-05 | 1.16e-03 | 9.37e-04 | 16 |
| hsa020101 | Liver | NAFLD | ABC transporters | 16/1043 | 45/8465 | 4.97e-05 | 1.16e-03 | 9.37e-04 | 16 |
| hsa041462 | Liver | Cirrhotic | Peroxisome | 36/2530 | 82/8465 | 4.79e-03 | 1.74e-02 | 1.07e-02 | 36 |
| hsa041463 | Liver | Cirrhotic | Peroxisome | 36/2530 | 82/8465 | 4.79e-03 | 1.74e-02 | 1.07e-02 | 36 |
| hsa041464 | Liver | HCC | Peroxisome | 58/4020 | 82/8465 | 1.57e-05 | 1.05e-04 | 5.85e-05 | 58 |
| hsa020102 | Liver | HCC | ABC transporters | 29/4020 | 45/8465 | 1.62e-02 | 3.88e-02 | 2.16e-02 | 29 |
| hsa041465 | Liver | HCC | Peroxisome | 58/4020 | 82/8465 | 1.57e-05 | 1.05e-04 | 5.85e-05 | 58 |
| hsa020103 | Liver | HCC | ABC transporters | 29/4020 | 45/8465 | 1.62e-02 | 3.88e-02 | 2.16e-02 | 29 |
| Page: 1 |
Top |
Cell-cell communication analysis |
| Identification of potential cell-cell interactions between two cell types and their ligand-receptor pairs for different disease states |
| Ligand | Receptor | LRpair | Pathway | Tissue | Disease Stage |
| Page: 1 |
Top |
Single-cell gene regulatory network inference analysis |
| Find out the significant the regulons (TFs) and the target genes of each regulon across cell types for different disease states |
| TF | Cell Type | Tissue | Disease Stage | Target Gene | RSS | Regulon Activity |
| ∗The dot plots of a searched regulon are shown for all cell subpopulations in each disease state of each tissue based on the regulon specific score inferred using pySCENIC and by calculating the average expression. |
| Page: 1 |
Top |
Somatic mutation of malignant transformation related genes |
| Annotation of somatic variants for genes involved in malignant transformation |
| Hugo Symbol | Variant Class | Variant Classification | dbSNP RS | HGVSc | HGVSp | HGVSp Short | SWISSPROT | BIOTYPE | SIFT | PolyPhen | Tumor Sample Barcode | Tissue | Histology | Sex | Age | Stage | Therapy Types | Drugs | Outcome |
| ABCD3 | SNV | Missense_Mutation | novel | c.1966N>A | p.Glu656Lys | p.E656K | P28288 | protein_coding | deleterious(0.03) | benign(0.146) | TCGA-A7-A4SE-01 | Breast | breast invasive carcinoma | Female | <65 | I/II | Chemotherapy | adriamycin | CR |
| ABCD3 | SNV | Missense_Mutation | novel | c.935N>T | p.Ser312Leu | p.S312L | P28288 | protein_coding | tolerated(0.71) | benign(0.003) | TCGA-AR-A1AY-01 | Breast | breast invasive carcinoma | Female | >=65 | I/II | Unspecific | Doxorubicin | SD |
| ABCD3 | SNV | Missense_Mutation | rs757143436 | c.1810N>A | p.Asp604Asn | p.D604N | P28288 | protein_coding | deleterious(0) | probably_damaging(0.992) | TCGA-BH-A0DL-01 | Breast | breast invasive carcinoma | Female | <65 | I/II | Chemotherapy | cytoxan | CR |
| ABCD3 | SNV | Missense_Mutation | c.251G>A | p.Gly84Asp | p.G84D | P28288 | protein_coding | deleterious(0.01) | possibly_damaging(0.908) | TCGA-BH-A18G-01 | Breast | breast invasive carcinoma | Female | >=65 | I/II | Unknown | Unknown | SD | |
| ABCD3 | SNV | Missense_Mutation | c.809N>T | p.Ser270Phe | p.S270F | P28288 | protein_coding | deleterious(0) | probably_damaging(0.998) | TCGA-C8-A12Z-01 | Breast | breast invasive carcinoma | Female | <65 | I/II | Chemotherapy | 5-fluorouracil | CR | |
| ABCD3 | insertion | Nonsense_Mutation | novel | c.1512_1513insAAAATCAGTCTGTGAAG | p.Leu505LysfsTer5 | p.L505Kfs*5 | P28288 | protein_coding | TCGA-AR-A0TU-01 | Breast | breast invasive carcinoma | Female | <65 | I/II | Unspecific | Doxorubicin | SD | ||
| ABCD3 | insertion | In_Frame_Ins | novel | c.1003_1004insTTGTGAAAGCTTTACTTCAGTTTTTATTTAATT | p.Arg335delinsLeuValLysAlaLeuLeuGlnPheLeuPheAsnCys | p.R335delinsLVKALLQFLFNC | P28288 | protein_coding | TCGA-B6-A0IB-01 | Breast | breast invasive carcinoma | Female | <65 | III/IV | Unknown | Unknown | PD | ||
| ABCD3 | SNV | Missense_Mutation | c.1936G>A | p.Glu646Lys | p.E646K | P28288 | protein_coding | tolerated(0.06) | benign(0.01) | TCGA-EA-A3QE-01 | Cervix | cervical & endocervical cancer | Female | <65 | I/II | Unknown | Unknown | SD | |
| ABCD3 | SNV | Missense_Mutation | c.737G>A | p.Arg246Gln | p.R246Q | P28288 | protein_coding | tolerated(0.27) | benign(0.267) | TCGA-Q1-A73O-01 | Cervix | cervical & endocervical cancer | Female | <65 | I/II | Chemotherapy | cisplatin | CR | |
| ABCD3 | SNV | Missense_Mutation | c.1751N>C | p.Leu584Ser | p.L584S | P28288 | protein_coding | deleterious(0) | probably_damaging(0.997) | TCGA-AA-3811-01 | Colorectum | colon adenocarcinoma | Female | >=65 | III/IV | Unknown | Unknown | PD |
| Page: 1 2 3 4 5 6 7 |
Top |
Related drugs of malignant transformation related genes |
| Identification of chemicals and drugs interact with genes involved in malignant transfromation |
| (DGIdb 4.0) |
| Entrez ID | Symbol | Category | Interaction Types | Drug Claim Name | Drug Name | PMIDs |
| Page: 1 |

Copyright 2023-Present -The University of Texas Health Science Center at Houston |