
|
|||||
|
 | |
| |
| |
| |
| |
| |
|
Gene: ABCC9 |
Gene summary for ABCC9 |
| Gene information | Species | Human | Gene symbol | ABCC9 | Gene ID | 10060 |
| Gene name | ATP binding cassette subfamily C member 9 | |
| Gene Alias | ABC37 | |
| Cytomap | 12p12.1 | |
| Gene Type | protein-coding | GO ID | GO:0002376 | UniProtAcc | A0A024RAV7 |
Top |
Malignant transformation analysis |
| Identification of the aberrant gene expression in precancerous and cancerous lesions by comparing the gene expression of stem-like cells in diseased tissues with normal stem cells |
| Entrez ID | Symbol | Replicates | Species | Organ | Tissue | Adj P-value | Log2FC | Malignancy |
| 10060 | ABCC9 | NAFLD1 | Human | Liver | NAFLD | 2.07e-05 | 4.51e-01 | -0.04 |
| 10060 | ABCC9 | S43 | Human | Liver | Cirrhotic | 1.01e-03 | -1.12e-01 | -0.0187 |
| 10060 | ABCC9 | HCC1_Meng | Human | Liver | HCC | 1.90e-08 | -2.50e-01 | 0.0246 |
| 10060 | ABCC9 | HCC2_Meng | Human | Liver | HCC | 2.32e-08 | -2.52e-01 | 0.0107 |
| 10060 | ABCC9 | cirrhotic1 | Human | Liver | Cirrhotic | 1.08e-04 | -2.37e-01 | 0.0202 |
| 10060 | ABCC9 | cirrhotic2 | Human | Liver | Cirrhotic | 2.74e-04 | -2.24e-01 | 0.0201 |
| 10060 | ABCC9 | HCC1 | Human | Liver | HCC | 1.02e-06 | 3.04e+00 | 0.5336 |
| 10060 | ABCC9 | HCC2 | Human | Liver | HCC | 1.77e-23 | 3.79e+00 | 0.5341 |
| 10060 | ABCC9 | HCC5 | Human | Liver | HCC | 3.34e-02 | 1.59e+00 | 0.4932 |
| 10060 | ABCC9 | Pt13.b | Human | Liver | HCC | 1.02e-04 | -1.71e-02 | 0.0251 |
| 10060 | ABCC9 | Pt14.d | Human | Liver | HCC | 4.74e-03 | -2.11e-01 | 0.0143 |
| 10060 | ABCC9 | RNA-P17T-P17T-4 | Human | Lung | IAC | 2.87e-02 | 4.51e-01 | 0.343 |
| 10060 | ABCC9 | RNA-P17T-P17T-6 | Human | Lung | IAC | 2.18e-05 | 5.95e-01 | 0.3385 |
| 10060 | ABCC9 | RNA-P6T2-P6T2-1 | Human | Lung | IAC | 8.86e-09 | 3.84e-01 | -0.0166 |
| 10060 | ABCC9 | RNA-P6T2-P6T2-2 | Human | Lung | IAC | 2.47e-09 | 3.59e-01 | -0.0132 |
| 10060 | ABCC9 | RNA-P6T2-P6T2-3 | Human | Lung | IAC | 6.47e-13 | 4.27e-01 | -0.013 |
| 10060 | ABCC9 | RNA-P6T2-P6T2-4 | Human | Lung | IAC | 3.70e-11 | 4.25e-01 | -0.0121 |
| 10060 | ABCC9 | RNA-P7T1-P7T1-1 | Human | Lung | AIS | 3.61e-03 | 4.57e-01 | -0.0961 |
| 10060 | ABCC9 | RNA-P7T1-P7T1-2 | Human | Lung | AIS | 9.95e-04 | 5.11e-01 | -0.0876 |
| 10060 | ABCC9 | RNA-P7T1-P7T1-3 | Human | Lung | AIS | 2.14e-05 | 6.05e-01 | -0.0822 |
| Page: 1 2 |
| Tissue | Expression Dynamics | Abbreviation |
| Liver | 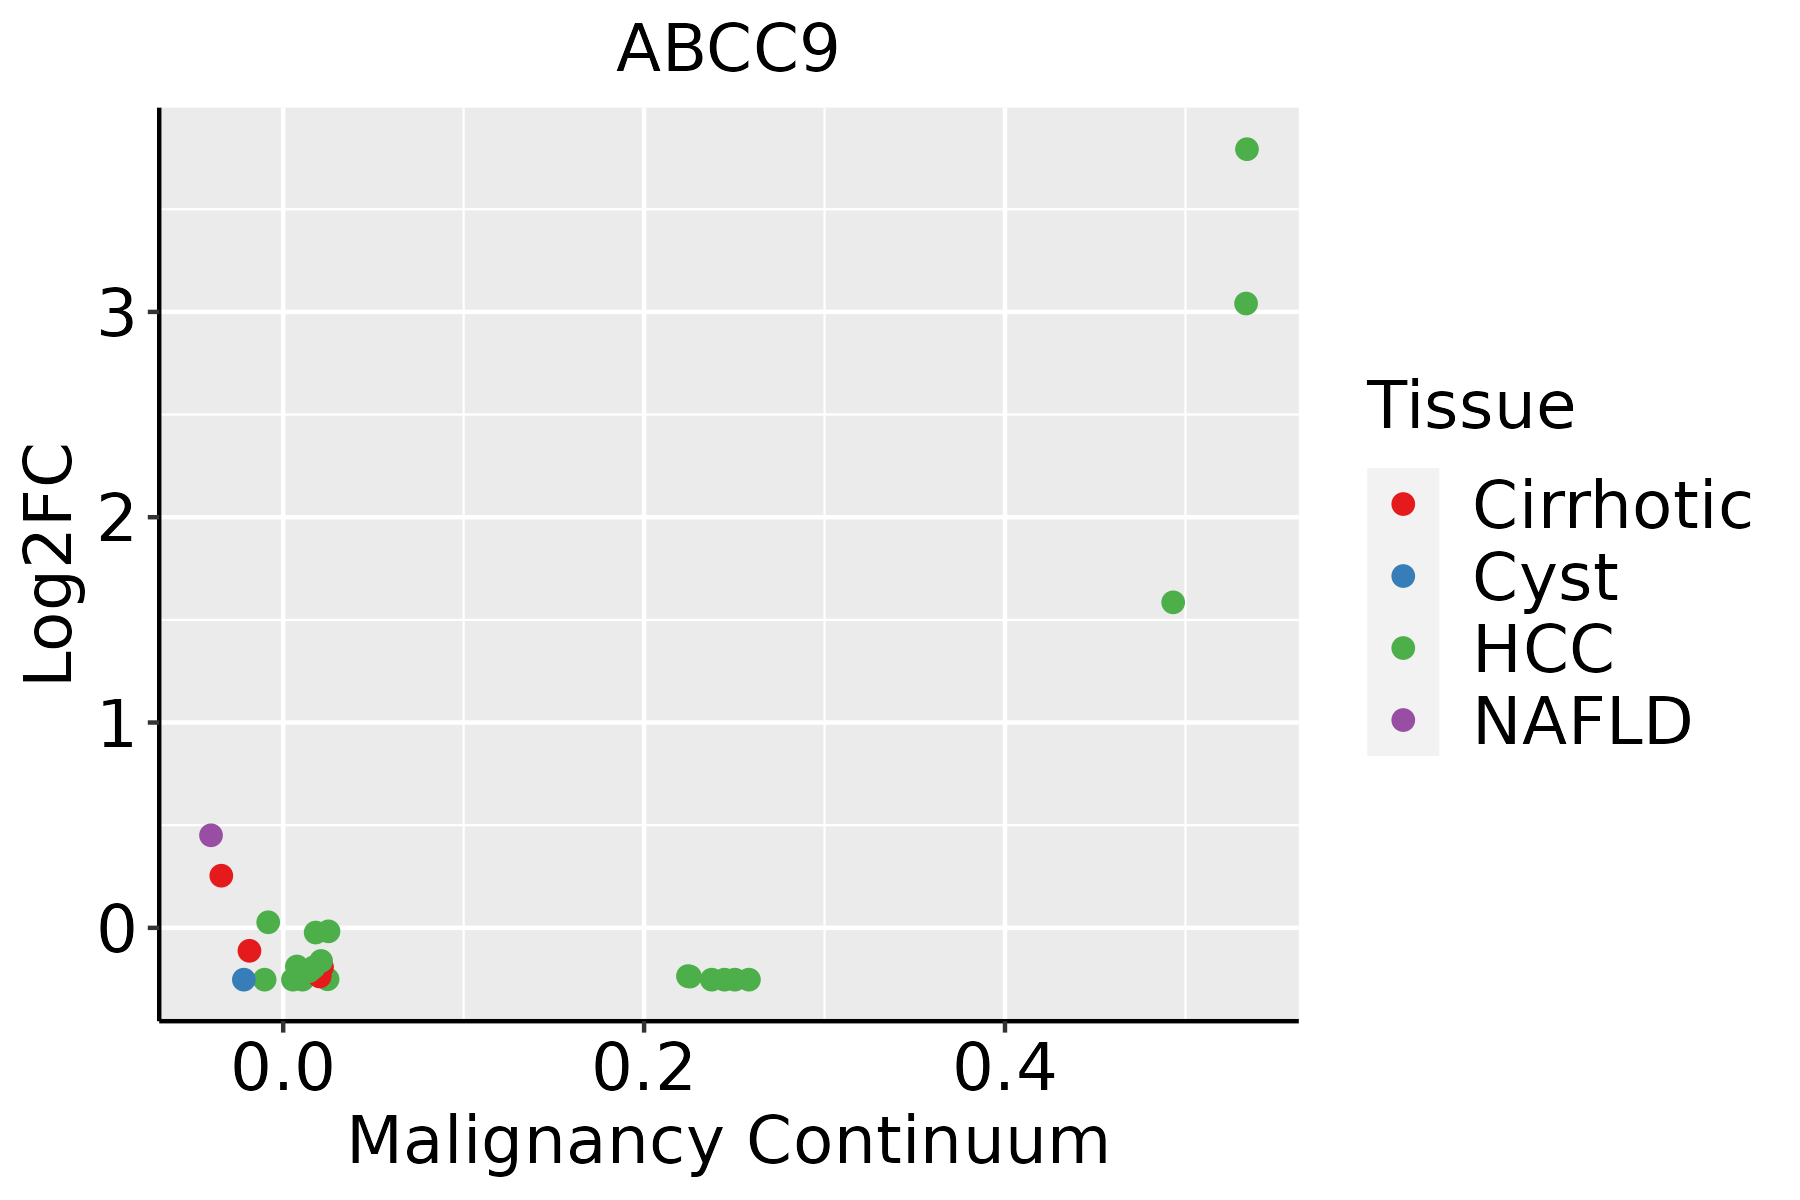 | HCC: Hepatocellular carcinoma |
| NAFLD: Non-alcoholic fatty liver disease | ||
| Lung |  | AAH: Atypical adenomatous hyperplasia |
| AIS: Adenocarcinoma in situ | ||
| IAC: Invasive lung adenocarcinoma | ||
| MIA: Minimally invasive adenocarcinoma |
| ∗log2FC in expression of this searched gene in stem-like cells from each diseased tissue sample relative to stem-like cells in normal samples in each tissue plotted against the malignancy continuum. Samples are colored based on if they are from different disease stage. |
Top |
Malignant transformation related pathway analysis |
| Find out the enriched GO biological processes and KEGG pathways involved in transition from healthy to precancer to cancer |
| Tissue | Disease Stage | Enriched GO biological Processes |
| Colorectum | AD |  |
| Colorectum | SER |  |
| Colorectum | MSS |  |
| Colorectum | MSI-H |  |
| Colorectum | FAP |  |
| ∗Top 15 enriched GO BP terms are showed in the bar plot of each disease state in each tissue. Each row represents a significant GO biological process which is colored according to the -log10(p.adjust). |
| Page: 1 2 3 4 5 6 7 8 9 |
| GO ID | Tissue | Disease Stage | Description | Gene Ratio | Bg Ratio | pvalue | p.adjust | Count |
| GO:00466837 | Liver | NAFLD | response to organophosphorus | 28/1882 | 131/18723 | 9.05e-05 | 1.82e-03 | 28 |
| GO:00030182 | Liver | NAFLD | vascular process in circulatory system | 46/1882 | 263/18723 | 1.36e-04 | 2.58e-03 | 46 |
| GO:00140747 | Liver | NAFLD | response to purine-containing compound | 29/1882 | 148/18723 | 3.34e-04 | 5.13e-03 | 29 |
| GO:01501043 | Liver | NAFLD | transport across blood-brain barrier | 17/1882 | 87/18723 | 5.46e-03 | 4.20e-02 | 17 |
| GO:00102322 | Liver | NAFLD | vascular transport | 17/1882 | 88/18723 | 6.15e-03 | 4.61e-02 | 17 |
| GO:00096155 | Liver | Cirrhotic | response to virus | 126/4634 | 367/18723 | 2.10e-05 | 2.77e-04 | 126 |
| GO:001407411 | Liver | Cirrhotic | response to purine-containing compound | 53/4634 | 148/18723 | 1.70e-03 | 1.08e-02 | 53 |
| GO:0051607 | Liver | Cirrhotic | defense response to virus | 84/4634 | 265/18723 | 6.02e-03 | 3.00e-02 | 84 |
| GO:0140546 | Liver | Cirrhotic | defense response to symbiont | 84/4634 | 265/18723 | 6.02e-03 | 3.00e-02 | 84 |
| GO:004668311 | Liver | Cirrhotic | response to organophosphorus | 45/4634 | 131/18723 | 8.57e-03 | 3.97e-02 | 45 |
| GO:000961511 | Liver | HCC | response to virus | 210/7958 | 367/18723 | 7.32e-09 | 1.86e-07 | 210 |
| GO:00516071 | Liver | HCC | defense response to virus | 151/7958 | 265/18723 | 1.27e-06 | 1.85e-05 | 151 |
| GO:01405461 | Liver | HCC | defense response to symbiont | 151/7958 | 265/18723 | 1.27e-06 | 1.85e-05 | 151 |
| GO:001407421 | Liver | HCC | response to purine-containing compound | 84/7958 | 148/18723 | 3.19e-04 | 2.26e-03 | 84 |
| GO:004668321 | Liver | HCC | response to organophosphorus | 73/7958 | 131/18723 | 1.52e-03 | 8.05e-03 | 73 |
| GO:015010411 | Liver | HCC | transport across blood-brain barrier | 50/7958 | 87/18723 | 3.42e-03 | 1.55e-02 | 50 |
| GO:001023211 | Liver | HCC | vascular transport | 50/7958 | 88/18723 | 4.69e-03 | 2.02e-02 | 50 |
| GO:00096156 | Lung | IAC | response to virus | 61/2061 | 367/18723 | 6.75e-04 | 9.12e-03 | 61 |
| GO:19035222 | Lung | IAC | regulation of blood circulation | 43/2061 | 256/18723 | 3.18e-03 | 2.77e-02 | 43 |
| GO:00466838 | Lung | AIS | response to organophosphorus | 24/1849 | 131/18723 | 2.14e-03 | 2.30e-02 | 24 |
| Page: 1 2 |
| Pathway ID | Tissue | Disease Stage | Description | Gene Ratio | Bg Ratio | pvalue | p.adjust | qvalue | Count |
| hsa02010 | Liver | NAFLD | ABC transporters | 16/1043 | 45/8465 | 4.97e-05 | 1.16e-03 | 9.37e-04 | 16 |
| hsa020101 | Liver | NAFLD | ABC transporters | 16/1043 | 45/8465 | 4.97e-05 | 1.16e-03 | 9.37e-04 | 16 |
| hsa020102 | Liver | HCC | ABC transporters | 29/4020 | 45/8465 | 1.62e-02 | 3.88e-02 | 2.16e-02 | 29 |
| hsa020103 | Liver | HCC | ABC transporters | 29/4020 | 45/8465 | 1.62e-02 | 3.88e-02 | 2.16e-02 | 29 |
| Page: 1 |
Top |
Cell-cell communication analysis |
| Identification of potential cell-cell interactions between two cell types and their ligand-receptor pairs for different disease states |
| Ligand | Receptor | LRpair | Pathway | Tissue | Disease Stage |
| Page: 1 |
Top |
Single-cell gene regulatory network inference analysis |
| Find out the significant the regulons (TFs) and the target genes of each regulon across cell types for different disease states |
| TF | Cell Type | Tissue | Disease Stage | Target Gene | RSS | Regulon Activity |
| ∗The dot plots of a searched regulon are shown for all cell subpopulations in each disease state of each tissue based on the regulon specific score inferred using pySCENIC and by calculating the average expression. |
| Page: 1 |
Top |
Somatic mutation of malignant transformation related genes |
| Annotation of somatic variants for genes involved in malignant transformation |
| Hugo Symbol | Variant Class | Variant Classification | dbSNP RS | HGVSc | HGVSp | HGVSp Short | SWISSPROT | BIOTYPE | SIFT | PolyPhen | Tumor Sample Barcode | Tissue | Histology | Sex | Age | Stage | Therapy Types | Drugs | Outcome |
| ABCC9 | SNV | Missense_Mutation | c.3496A>T | p.Ser1166Cys | p.S1166C | O60706 | protein_coding | tolerated(0.09) | probably_damaging(0.927) | TCGA-A2-A0CL-01 | Breast | breast invasive carcinoma | Female | <65 | III/IV | Chemotherapy | cytoxan | SD | |
| ABCC9 | SNV | Missense_Mutation | c.2799N>C | p.Glu933Asp | p.E933D | O60706 | protein_coding | deleterious(0.02) | possibly_damaging(0.681) | TCGA-AC-A5EH-01 | Breast | breast invasive carcinoma | Female | >=65 | I/II | Unknown | Unknown | SD | |
| ABCC9 | SNV | Missense_Mutation | rs374849789 | c.325G>A | p.Val109Met | p.V109M | O60706 | protein_coding | tolerated(0.16) | benign(0.036) | TCGA-AC-A8OQ-01 | Breast | breast invasive carcinoma | Female | >=65 | I/II | Unknown | Unknown | SD |
| ABCC9 | SNV | Missense_Mutation | c.2066C>G | p.Ser689Cys | p.S689C | O60706 | protein_coding | deleterious(0.02) | probably_damaging(0.957) | TCGA-AN-A0AR-01 | Breast | breast invasive carcinoma | Female | <65 | I/II | Unknown | Unknown | SD | |
| ABCC9 | SNV | Missense_Mutation | c.2234G>A | p.Arg745Lys | p.R745K | O60706 | protein_coding | tolerated(0.94) | benign(0.025) | TCGA-AO-A0JC-01 | Breast | breast invasive carcinoma | Female | <65 | I/II | Chemotherapy | fluorouracil | SD | |
| ABCC9 | SNV | Missense_Mutation | c.280N>C | p.Asp94His | p.D94H | O60706 | protein_coding | deleterious(0.02) | benign(0.035) | TCGA-AR-A0TX-01 | Breast | breast invasive carcinoma | Female | <65 | I/II | Unknown | Unknown | SD | |
| ABCC9 | SNV | Missense_Mutation | novel | c.3833N>T | p.Ala1278Val | p.A1278V | O60706 | protein_coding | deleterious(0) | probably_damaging(0.988) | TCGA-B6-A3ZX-01 | Breast | breast invasive carcinoma | Female | <65 | III/IV | Chemotherapy | cyclophosphamide | PD |
| ABCC9 | SNV | Missense_Mutation | novel | c.1484N>T | p.Thr495Ile | p.T495I | O60706 | protein_coding | tolerated(0.07) | possibly_damaging(0.672) | TCGA-BH-A0HF-01 | Breast | breast invasive carcinoma | Female | >=65 | I/II | Hormone Therapy | arimidex | SD |
| ABCC9 | SNV | Missense_Mutation | rs773377070 | c.4637N>A | p.Arg1546His | p.R1546H | O60706 | protein_coding | deleterious(0.01) | benign(0.42) | TCGA-C8-A1HE-01 | Breast | breast invasive carcinoma | Female | <65 | I/II | Unknown | Unknown | SD |
| ABCC9 | SNV | Missense_Mutation | c.1190N>C | p.Arg397Thr | p.R397T | O60706 | protein_coding | deleterious(0) | probably_damaging(0.972) | TCGA-C8-A26Z-01 | Breast | breast invasive carcinoma | Female | <65 | I/II | Hormone Therapy | tamoxiphen | CR |
| Page: 1 2 3 4 5 6 7 8 9 10 11 12 13 14 15 16 17 18 19 20 21 22 23 24 25 26 27 28 |
Top |
Related drugs of malignant transformation related genes |
| Identification of chemicals and drugs interact with genes involved in malignant transfromation |
| (DGIdb 4.0) |
| Entrez ID | Symbol | Category | Interaction Types | Drug Claim Name | Drug Name | PMIDs |
| 10060 | ABCC9 | TRANSPORTER, DRUGGABLE GENOME, ABC TRANSPORTER | CHEMBL2105160 | NAMINIDIL | ||
| 10060 | ABCC9 | TRANSPORTER, DRUGGABLE GENOME, ABC TRANSPORTER | allosteric modulator | 252827466 | ||
| 10060 | ABCC9 | TRANSPORTER, DRUGGABLE GENOME, ABC TRANSPORTER | Tolbutamide | TOLBUTAMIDE | ||
| 10060 | ABCC9 | TRANSPORTER, DRUGGABLE GENOME, ABC TRANSPORTER | CHEMBL1200338 | PINACIDIL | ||
| 10060 | ABCC9 | TRANSPORTER, DRUGGABLE GENOME, ABC TRANSPORTER | Repaglinide | REPAGLINIDE | ||
| 10060 | ABCC9 | TRANSPORTER, DRUGGABLE GENOME, ABC TRANSPORTER | montelukast | MONTELUKAST | 28940478 | |
| 10060 | ABCC9 | TRANSPORTER, DRUGGABLE GENOME, ABC TRANSPORTER | Nicorandil | NICORANDIL | ||
| 10060 | ABCC9 | TRANSPORTER, DRUGGABLE GENOME, ABC TRANSPORTER | Glimepiride | GLIMEPIRIDE | ||
| 10060 | ABCC9 | TRANSPORTER, DRUGGABLE GENOME, ABC TRANSPORTER | CHEMBL802 | MINOXIDIL | ||
| 10060 | ABCC9 | TRANSPORTER, DRUGGABLE GENOME, ABC TRANSPORTER | CHEMBL2104449 | SARAKALIM |
| Page: 1 |

Copyright 2023-Present -The University of Texas Health Science Center at Houston |