
|
|||||
|
 | |
| |
| |
| |
| |
| |
|
Gene: ABCC6 |
Gene summary for ABCC6 |
| Gene information | Species | Human | Gene symbol | ABCC6 | Gene ID | 368 |
| Gene name | ATP binding cassette subfamily C member 6 | |
| Gene Alias | ABC34 | |
| Cytomap | 16p13.11 | |
| Gene Type | protein-coding | GO ID | GO:0003008 | UniProtAcc | O95255 |
Top |
Malignant transformation analysis |
| Identification of the aberrant gene expression in precancerous and cancerous lesions by comparing the gene expression of stem-like cells in diseased tissues with normal stem cells |
| Entrez ID | Symbol | Replicates | Species | Organ | Tissue | Adj P-value | Log2FC | Malignancy |
| 368 | ABCC6 | NAFLD1 | Human | Liver | NAFLD | 4.83e-12 | 8.43e-01 | -0.04 |
| 368 | ABCC6 | S41 | Human | Liver | Cirrhotic | 2.33e-02 | 4.08e-01 | -0.0343 |
| 368 | ABCC6 | S43 | Human | Liver | Cirrhotic | 9.29e-09 | -1.15e-01 | -0.0187 |
| 368 | ABCC6 | HCC1_Meng | Human | Liver | HCC | 2.95e-63 | -1.42e-02 | 0.0246 |
| 368 | ABCC6 | HCC2_Meng | Human | Liver | HCC | 2.07e-04 | -1.30e-01 | 0.0107 |
| 368 | ABCC6 | HCC1 | Human | Liver | HCC | 1.65e-17 | 3.84e+00 | 0.5336 |
| 368 | ABCC6 | S014 | Human | Liver | HCC | 4.06e-23 | 1.14e+00 | 0.2254 |
| 368 | ABCC6 | S015 | Human | Liver | HCC | 5.15e-23 | 1.46e+00 | 0.2375 |
| 368 | ABCC6 | S016 | Human | Liver | HCC | 3.66e-26 | 1.09e+00 | 0.2243 |
| 368 | ABCC6 | S027 | Human | Liver | HCC | 2.15e-05 | 6.68e-01 | 0.2446 |
| 368 | ABCC6 | S028 | Human | Liver | HCC | 5.07e-18 | 9.32e-01 | 0.2503 |
| 368 | ABCC6 | S029 | Human | Liver | HCC | 4.94e-23 | 1.12e+00 | 0.2581 |
| Page: 1 |
| Tissue | Expression Dynamics | Abbreviation |
| Liver | 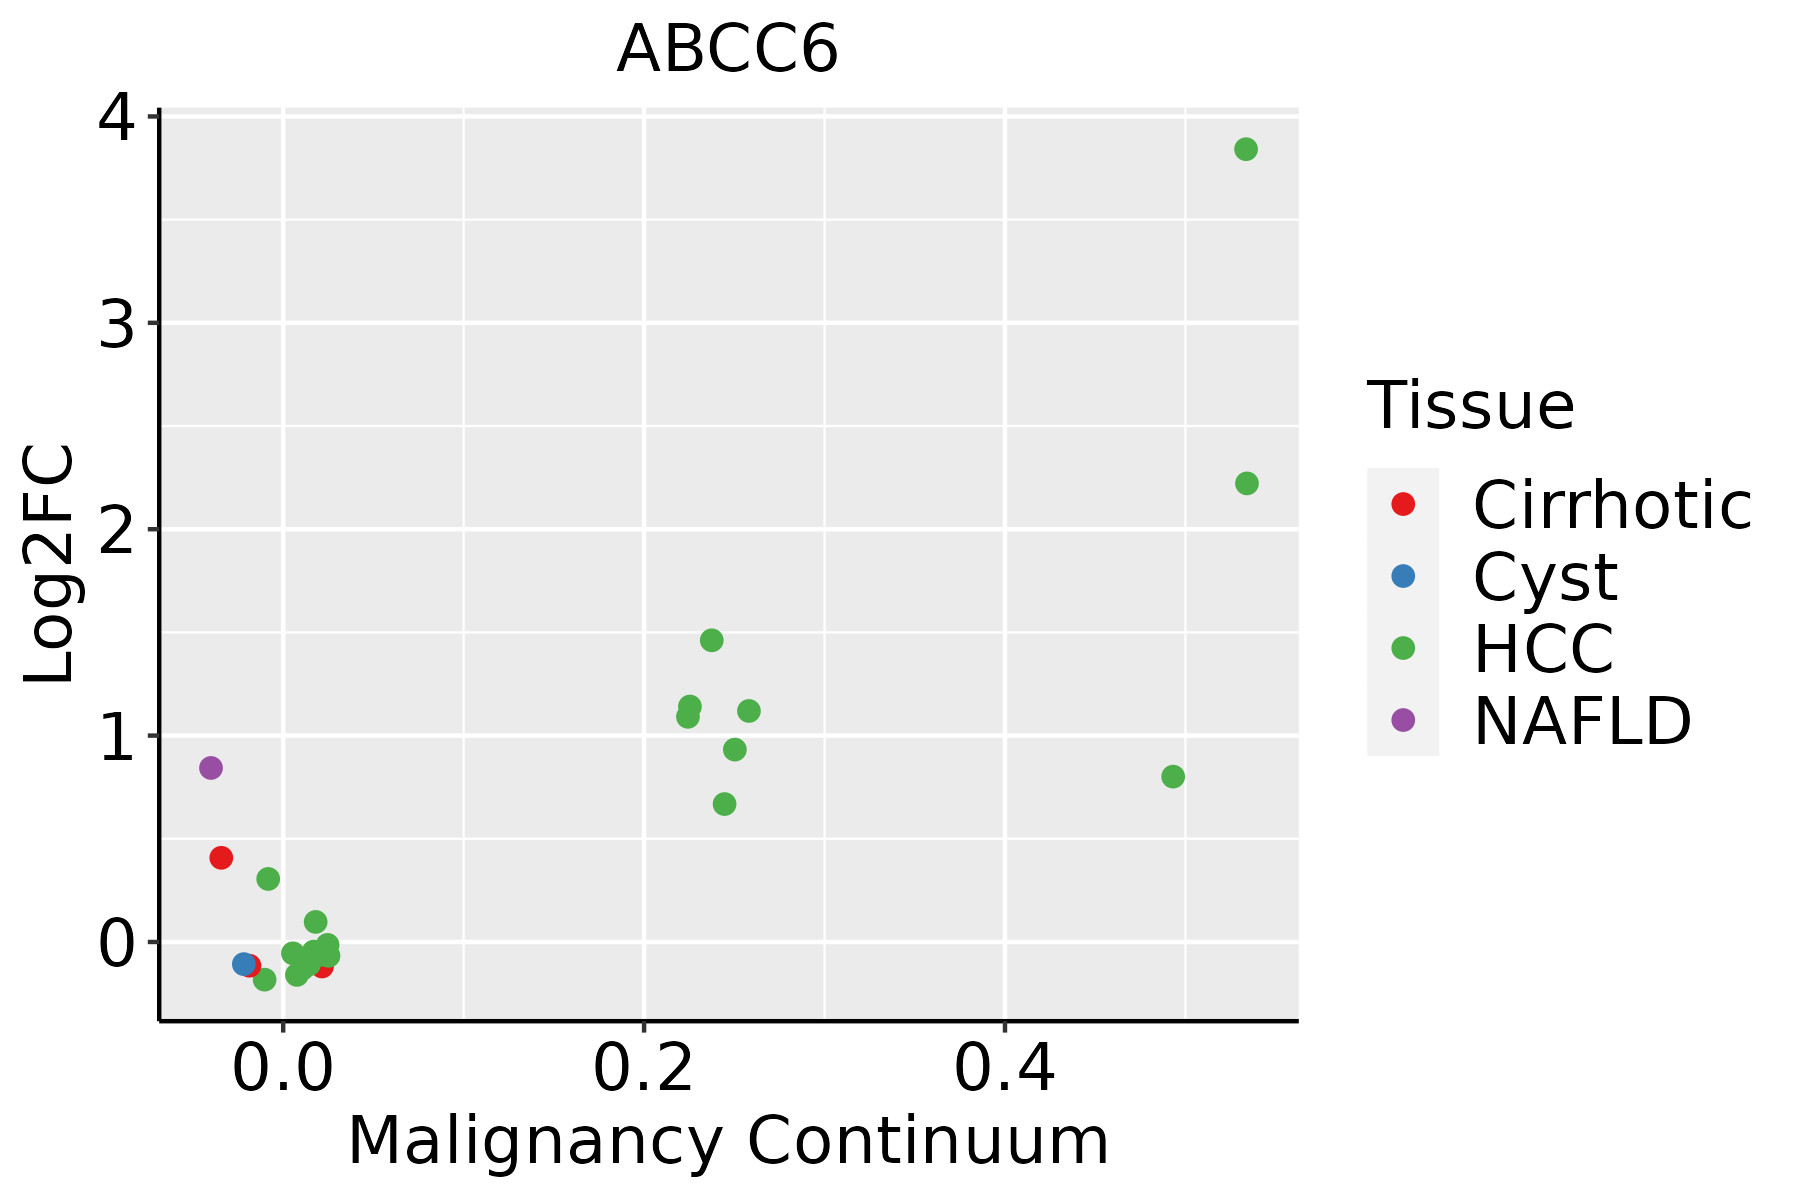 | HCC: Hepatocellular carcinoma |
| NAFLD: Non-alcoholic fatty liver disease |
| ∗log2FC in expression of this searched gene in stem-like cells from each diseased tissue sample relative to stem-like cells in normal samples in each tissue plotted against the malignancy continuum. Samples are colored based on if they are from different disease stage. |
Top |
Malignant transformation related pathway analysis |
| Find out the enriched GO biological processes and KEGG pathways involved in transition from healthy to precancer to cancer |
| Tissue | Disease Stage | Enriched GO biological Processes |
| Colorectum | AD |  |
| Colorectum | SER |  |
| Colorectum | MSS |  |
| Colorectum | MSI-H |  |
| Colorectum | FAP |  |
| ∗Top 15 enriched GO BP terms are showed in the bar plot of each disease state in each tissue. Each row represents a significant GO biological process which is colored according to the -log10(p.adjust). |
| Page: 1 2 3 4 5 6 7 8 9 |
| GO ID | Tissue | Disease Stage | Description | Gene Ratio | Bg Ratio | pvalue | p.adjust | Count |
| GO:00094107 | Liver | NAFLD | response to xenobiotic stimulus | 88/1882 | 462/18723 | 2.53e-09 | 4.11e-07 | 88 |
| GO:000941012 | Liver | Cirrhotic | response to xenobiotic stimulus | 165/4634 | 462/18723 | 6.82e-08 | 2.09e-06 | 165 |
| GO:00159316 | Liver | Cirrhotic | nucleobase-containing compound transport | 87/4634 | 222/18723 | 1.25e-06 | 2.52e-05 | 87 |
| GO:001593111 | Liver | HCC | nucleobase-containing compound transport | 150/7958 | 222/18723 | 3.17e-14 | 2.03e-12 | 150 |
| GO:000941022 | Liver | HCC | response to xenobiotic stimulus | 248/7958 | 462/18723 | 6.47e-07 | 1.02e-05 | 248 |
| GO:1901264 | Liver | HCC | carbohydrate derivative transport | 48/7958 | 80/18723 | 1.19e-03 | 6.62e-03 | 48 |
| Page: 1 |
| Pathway ID | Tissue | Disease Stage | Description | Gene Ratio | Bg Ratio | pvalue | p.adjust | qvalue | Count |
| hsa02010 | Liver | NAFLD | ABC transporters | 16/1043 | 45/8465 | 4.97e-05 | 1.16e-03 | 9.37e-04 | 16 |
| hsa020101 | Liver | NAFLD | ABC transporters | 16/1043 | 45/8465 | 4.97e-05 | 1.16e-03 | 9.37e-04 | 16 |
| hsa020102 | Liver | HCC | ABC transporters | 29/4020 | 45/8465 | 1.62e-02 | 3.88e-02 | 2.16e-02 | 29 |
| hsa020103 | Liver | HCC | ABC transporters | 29/4020 | 45/8465 | 1.62e-02 | 3.88e-02 | 2.16e-02 | 29 |
| Page: 1 |
Top |
Cell-cell communication analysis |
| Identification of potential cell-cell interactions between two cell types and their ligand-receptor pairs for different disease states |
| Ligand | Receptor | LRpair | Pathway | Tissue | Disease Stage |
| Page: 1 |
Top |
Single-cell gene regulatory network inference analysis |
| Find out the significant the regulons (TFs) and the target genes of each regulon across cell types for different disease states |
| TF | Cell Type | Tissue | Disease Stage | Target Gene | RSS | Regulon Activity |
| ∗The dot plots of a searched regulon are shown for all cell subpopulations in each disease state of each tissue based on the regulon specific score inferred using pySCENIC and by calculating the average expression. |
| Page: 1 |
Top |
Somatic mutation of malignant transformation related genes |
| Annotation of somatic variants for genes involved in malignant transformation |
| Hugo Symbol | Variant Class | Variant Classification | dbSNP RS | HGVSc | HGVSp | HGVSp Short | SWISSPROT | BIOTYPE | SIFT | PolyPhen | Tumor Sample Barcode | Tissue | Histology | Sex | Age | Stage | Therapy Types | Drugs | Outcome |
| ABCC6 | SNV | Missense_Mutation | novel | c.319N>T | p.His107Tyr | p.H107Y | O95255 | protein_coding | tolerated(0.12) | benign(0.176) | TCGA-5L-AAT1-01 | Breast | breast invasive carcinoma | Female | <65 | III/IV | Hormone Therapy | letrozol | SD |
| ABCC6 | SNV | Missense_Mutation | c.3511N>T | p.Leu1171Phe | p.L1171F | O95255 | protein_coding | deleterious(0) | probably_damaging(1) | TCGA-A2-A1FV-01 | Breast | breast invasive carcinoma | Female | >=65 | I/II | Chemotherapy | cyclophosphamide | SD | |
| ABCC6 | SNV | Missense_Mutation | rs549920304 | c.4264N>C | p.Ile1422Leu | p.I1422L | O95255 | protein_coding | deleterious(0.02) | probably_damaging(0.914) | TCGA-A8-A08S-01 | Breast | breast invasive carcinoma | Female | >=65 | I/II | Hormone Therapy | anastrozole | SD |
| ABCC6 | SNV | Missense_Mutation | c.865N>G | p.Leu289Val | p.L289V | O95255 | protein_coding | tolerated(0.07) | benign(0.051) | TCGA-A8-A09M-01 | Breast | breast invasive carcinoma | Female | >=65 | III/IV | Chemotherapy | paclitaxel | CR | |
| ABCC6 | SNV | Missense_Mutation | novel | c.4435N>A | p.Glu1479Lys | p.E1479K | O95255 | protein_coding | deleterious(0) | probably_damaging(0.998) | TCGA-AC-A5XS-01 | Breast | breast invasive carcinoma | Female | >=65 | I/II | Hormone Therapy | femara | SD |
| ABCC6 | SNV | Missense_Mutation | c.181N>T | p.Gly61Cys | p.G61C | O95255 | protein_coding | deleterious(0.03) | benign(0.386) | TCGA-BH-A0EB-01 | Breast | breast invasive carcinoma | Female | >=65 | I/II | Hormone Therapy | arimidex | SD | |
| ABCC6 | SNV | Missense_Mutation | rs114149656 | c.1675N>A | p.Glu559Lys | p.E559K | O95255 | protein_coding | tolerated(0.07) | benign(0.007) | TCGA-BH-A203-01 | Breast | breast invasive carcinoma | Female | >=65 | I/II | Unknown | Unknown | PD |
| ABCC6 | SNV | Missense_Mutation | novel | c.1172N>A | p.Arg391Lys | p.R391K | O95255 | protein_coding | tolerated(0.05) | probably_damaging(0.999) | TCGA-BH-A2L8-01 | Breast | breast invasive carcinoma | Female | <65 | I/II | Chemotherapy | cytoxan | CR |
| ABCC6 | SNV | Missense_Mutation | c.997A>G | p.Ser333Gly | p.S333G | O95255 | protein_coding | deleterious(0.03) | benign(0.186) | TCGA-D8-A1XQ-01 | Breast | breast invasive carcinoma | Female | >=65 | I/II | Unknown | Unknown | SD | |
| ABCC6 | deletion | Frame_Shift_Del | novel | c.1597delT | p.Ser533LeufsTer30 | p.S533Lfs*30 | O95255 | protein_coding | TCGA-EW-A2FV-01 | Breast | breast invasive carcinoma | Female | <65 | III/IV | Chemotherapy | docetaxel | SD |
| Page: 1 2 3 4 5 6 7 8 9 10 11 12 13 14 |
Top |
Related drugs of malignant transformation related genes |
| Identification of chemicals and drugs interact with genes involved in malignant transfromation |
| (DGIdb 4.0) |
| Entrez ID | Symbol | Category | Interaction Types | Drug Claim Name | Drug Name | PMIDs |
| 368 | ABCC6 | TRANSPORTER, DRUGGABLE GENOME, ABC TRANSPORTER | HEPARAN SULFATE | 12600949 | ||
| 368 | ABCC6 | TRANSPORTER, DRUGGABLE GENOME, ABC TRANSPORTER | thalidomide | THALIDOMIDE | 20038957 | |
| 368 | ABCC6 | TRANSPORTER, DRUGGABLE GENOME, ABC TRANSPORTER | docetaxel | DOCETAXEL | 20038957 | |
| 368 | ABCC6 | TRANSPORTER, DRUGGABLE GENOME, ABC TRANSPORTER | SALINE | SODIUM CHLORIDE | 17151194 | |
| 368 | ABCC6 | TRANSPORTER, DRUGGABLE GENOME, ABC TRANSPORTER | CHONDROITIN SULFATE | 12600949 |
| Page: 1 |

Copyright 2023-Present -The University of Texas Health Science Center at Houston |