| Tissue | Expression Dynamics | Abbreviation |
| Cervix |  | CC: Cervix cancer |
| HSIL_HPV: HPV-infected high-grade squamous intraepithelial lesions |
| N_HPV: HPV-infected normal cervix |
| Esophagus |  | ESCC: Esophageal squamous cell carcinoma |
| HGIN: High-grade intraepithelial neoplasias |
| LGIN: Low-grade intraepithelial neoplasias |
| Liver | 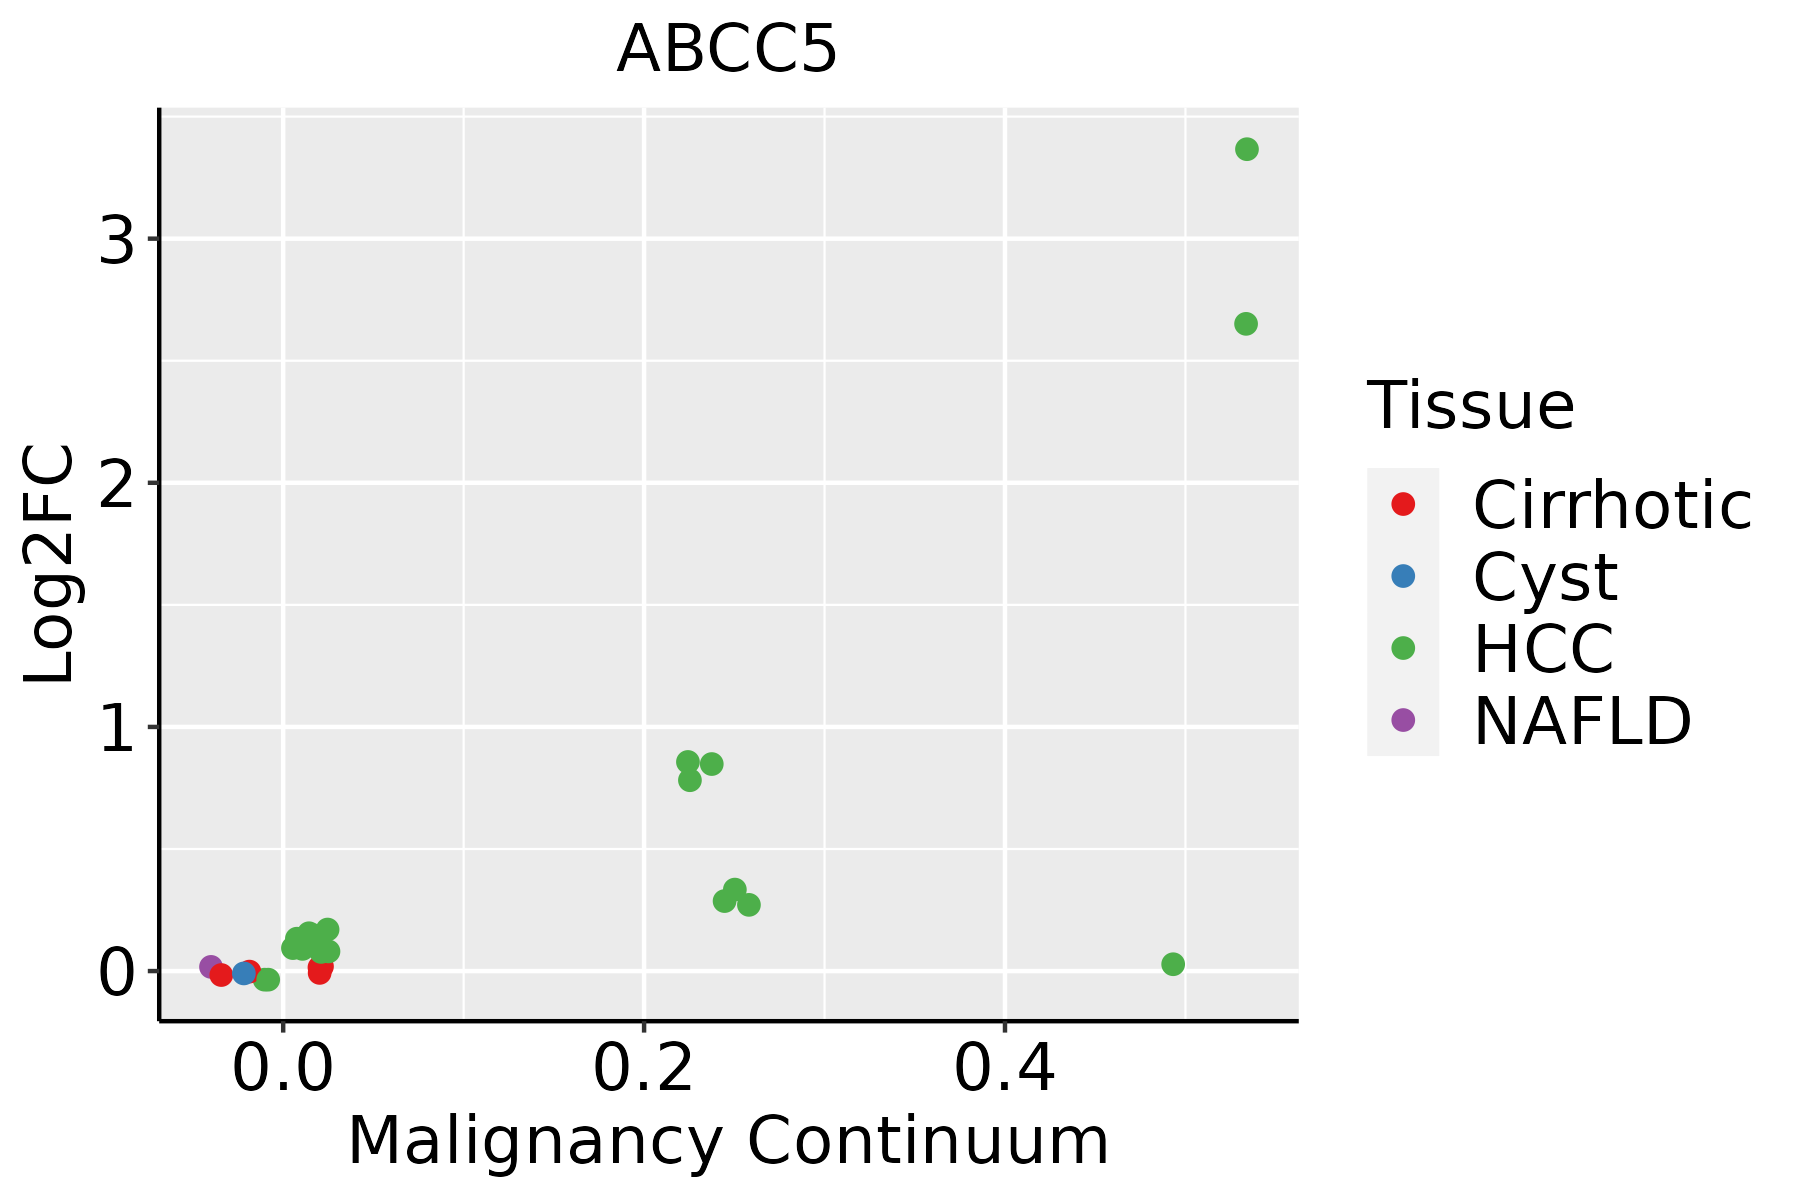 | HCC: Hepatocellular carcinoma |
| NAFLD: Non-alcoholic fatty liver disease |
| Oral Cavity | 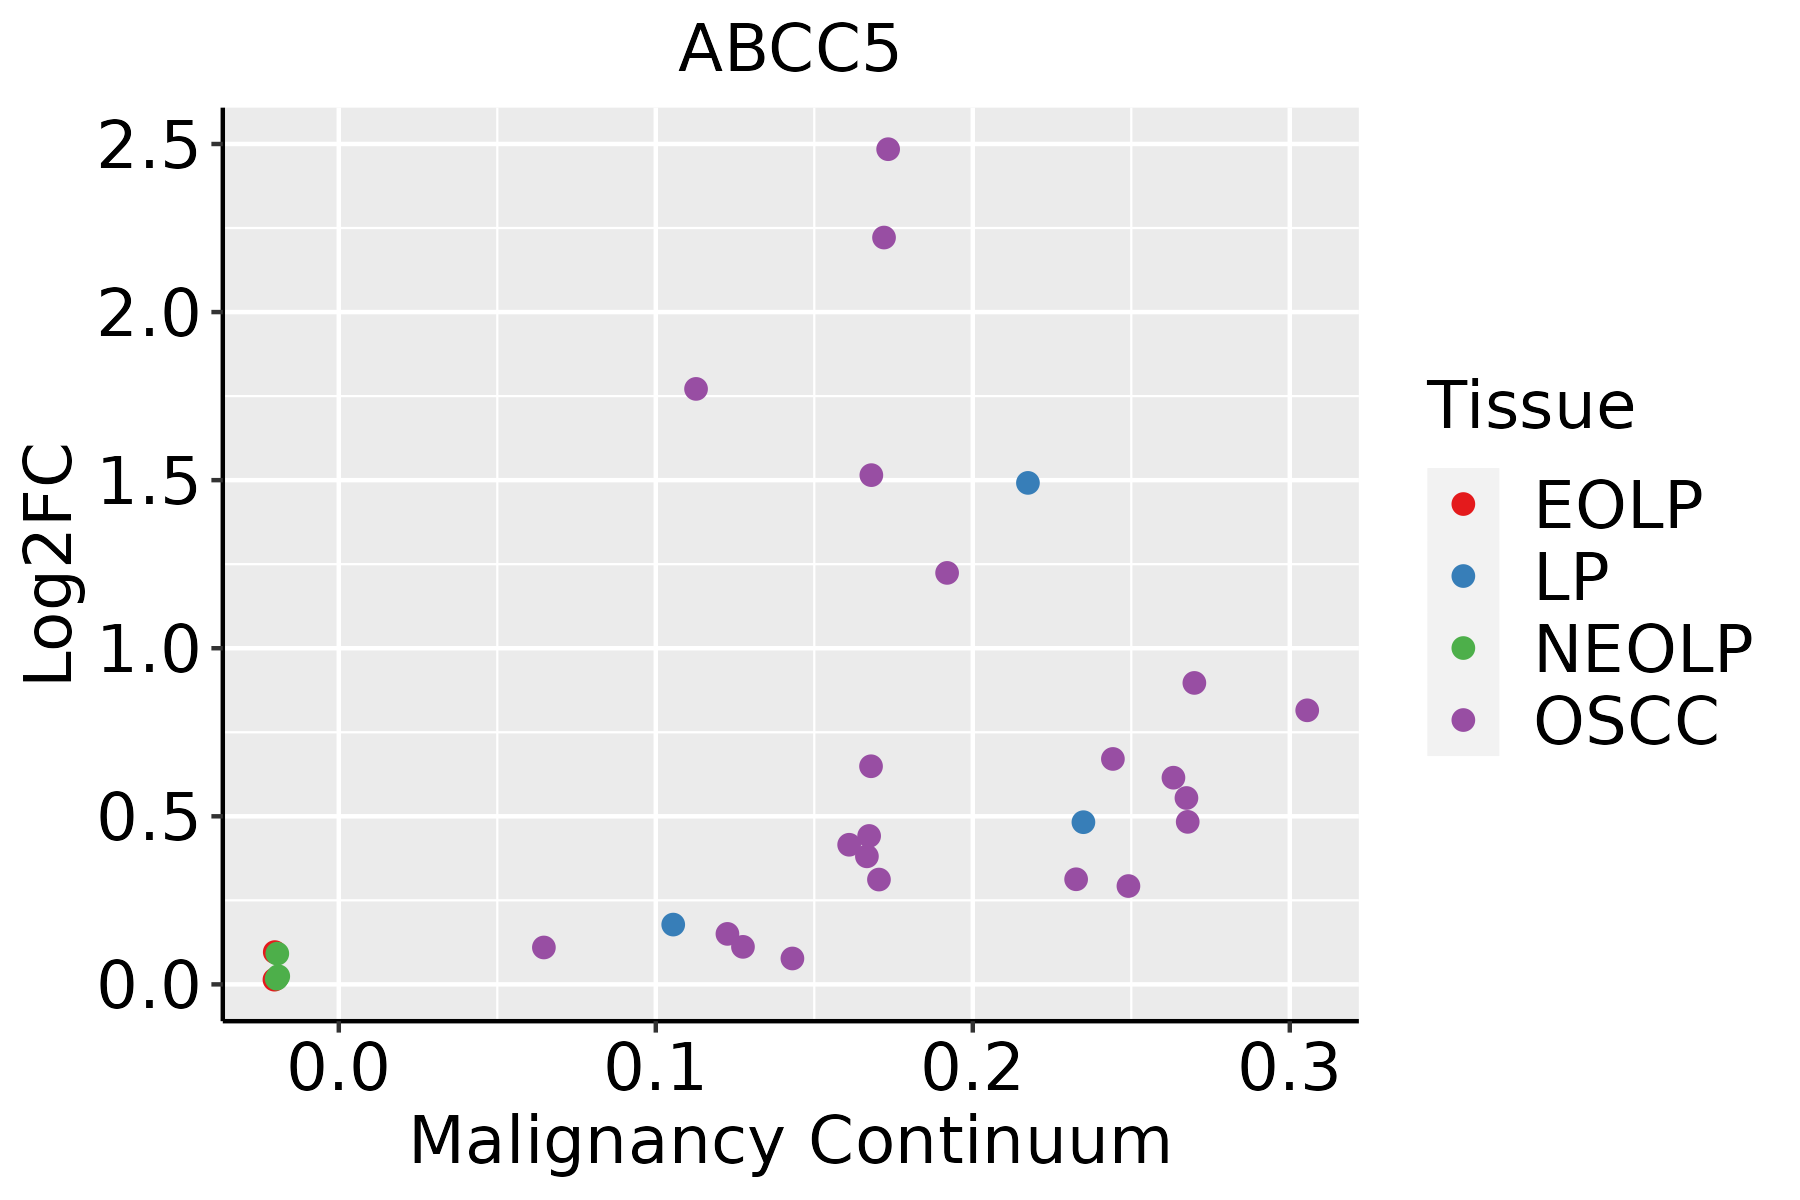 | EOLP: Erosive Oral lichen planus |
| LP: leukoplakia |
| NEOLP: Non-erosive oral lichen planus |
| OSCC: Oral squamous cell carcinoma |
| GO ID | Tissue | Disease Stage | Description | Gene Ratio | Bg Ratio | pvalue | p.adjust | Count |
| GO:00159318 | Cervix | CC | nucleobase-containing compound transport | 43/2311 | 222/18723 | 1.72e-03 | 1.30e-02 | 43 |
| GO:00158337 | Cervix | CC | peptide transport | 46/2311 | 264/18723 | 9.69e-03 | 4.78e-02 | 46 |
| GO:001593116 | Esophagus | HGIN | nucleobase-containing compound transport | 57/2587 | 222/18723 | 1.76e-06 | 6.52e-05 | 57 |
| GO:001593117 | Esophagus | ESCC | nucleobase-containing compound transport | 162/8552 | 222/18723 | 9.87e-17 | 7.93e-15 | 162 |
| GO:0006024 | Esophagus | ESCC | glycosaminoglycan biosynthetic process | 45/8552 | 75/18723 | 8.75e-03 | 3.08e-02 | 45 |
| GO:0006023 | Esophagus | ESCC | aminoglycan biosynthetic process | 47/8552 | 79/18723 | 9.29e-03 | 3.23e-02 | 47 |
| GO:001593111 | Liver | HCC | nucleobase-containing compound transport | 150/7958 | 222/18723 | 3.17e-14 | 2.03e-12 | 150 |
| GO:1901264 | Liver | HCC | carbohydrate derivative transport | 48/7958 | 80/18723 | 1.19e-03 | 6.62e-03 | 48 |
| GO:00000411 | Liver | HCC | transition metal ion transport | 59/7958 | 105/18723 | 3.18e-03 | 1.47e-02 | 59 |
| GO:015010411 | Liver | HCC | transport across blood-brain barrier | 50/7958 | 87/18723 | 3.42e-03 | 1.55e-02 | 50 |
| GO:001023211 | Liver | HCC | vascular transport | 50/7958 | 88/18723 | 4.69e-03 | 2.02e-02 | 50 |
| GO:0015886 | Liver | HCC | heme transport | 9/7958 | 11/18723 | 9.51e-03 | 3.60e-02 | 9 |
| GO:00068261 | Liver | HCC | iron ion transport | 34/7958 | 58/18723 | 9.66e-03 | 3.63e-02 | 34 |
| GO:001593114 | Oral cavity | OSCC | nucleobase-containing compound transport | 150/7305 | 222/18723 | 4.86e-18 | 5.04e-16 | 150 |
| GO:19012642 | Oral cavity | OSCC | carbohydrate derivative transport | 44/7305 | 80/18723 | 2.67e-03 | 1.16e-02 | 44 |
| GO:00068572 | Oral cavity | OSCC | oligopeptide transport | 11/7305 | 16/18723 | 1.56e-02 | 4.99e-02 | 11 |
| GO:001593115 | Oral cavity | LP | nucleobase-containing compound transport | 95/4623 | 222/18723 | 2.23e-09 | 9.98e-08 | 95 |
| GO:19012641 | Oral cavity | LP | carbohydrate derivative transport | 31/4623 | 80/18723 | 3.69e-03 | 2.44e-02 | 31 |
| Hugo Symbol | Variant Class | Variant Classification | dbSNP RS | HGVSc | HGVSp | HGVSp Short | SWISSPROT | BIOTYPE | SIFT | PolyPhen | Tumor Sample Barcode | Tissue | Histology | Sex | Age | Stage | Therapy Types | Drugs | Outcome |
| ABCC5 | SNV | Missense_Mutation | | c.4087N>C | p.Glu1363Gln | p.E1363Q | O15440 | protein_coding | deleterious(0.01) | benign(0.125) | TCGA-AR-A250-01 | Breast | breast invasive carcinoma | Female | <65 | I/II | Chemotherapy | doxorubicin | SD |
| ABCC5 | SNV | Missense_Mutation | rs780239386 | c.2476N>A | p.Glu826Lys | p.E826K | O15440 | protein_coding | tolerated(0.71) | benign(0) | TCGA-C8-A26W-01 | Breast | breast invasive carcinoma | Female | <65 | I/II | Chemotherapy | doxorubicin | CR |
| ABCC5 | SNV | Missense_Mutation | novel | c.1990N>G | p.Arg664Gly | p.R664G | O15440 | protein_coding | tolerated(0.08) | benign(0.07) | TCGA-D8-A1XK-01 | Breast | breast invasive carcinoma | Female | <65 | I/II | Chemotherapy | doxorubicine+cyclophosphamide | SD |
| ABCC5 | SNV | Missense_Mutation | rs11552530 | c.3301N>T | p.Arg1101Trp | p.R1101W | O15440 | protein_coding | tolerated(0.12) | possibly_damaging(0.583) | TCGA-D8-A27F-01 | Breast | breast invasive carcinoma | Female | <65 | I/II | Chemotherapy | adriamycin+cyclophosphamide | SD |
| ABCC5 | SNV | Missense_Mutation | rs747505911 | c.418N>A | p.Glu140Lys | p.E140K | O15440 | protein_coding | deleterious(0) | benign(0.394) | TCGA-D8-A27G-01 | Breast | breast invasive carcinoma | Female | >=65 | I/II | Unknown | Unknown | SD |
| ABCC5 | SNV | Missense_Mutation | | c.2856C>G | p.Phe952Leu | p.F952L | O15440 | protein_coding | deleterious(0.01) | possibly_damaging(0.714) | TCGA-E2-A14P-01 | Breast | breast invasive carcinoma | Female | >=65 | III/IV | Targeted Molecular therapy | trastuzumab | SD |
| ABCC5 | SNV | Missense_Mutation | | c.2221A>G | p.Thr741Ala | p.T741A | O15440 | protein_coding | deleterious(0) | probably_damaging(0.931) | TCGA-E9-A22G-01 | Breast | breast invasive carcinoma | Female | <65 | I/II | Chemotherapy | doxorubicin | SD |
| ABCC5 | deletion | Frame_Shift_Del | | c.3268_3269delNN | p.Leu1090ValfsTer62 | p.L1090Vfs*62 | O15440 | protein_coding | | | TCGA-AN-A0AK-01 | Breast | breast invasive carcinoma | Female | >=65 | I/II | Unknown | Unknown | SD |
| ABCC5 | SNV | Missense_Mutation | novel | c.2420N>T | p.Ser807Leu | p.S807L | O15440 | protein_coding | tolerated(0.29) | benign(0.007) | TCGA-VS-A958-01 | Cervix | cervical & endocervical cancer | Female | <65 | I/II | Chemotherapy | cisplatin | CR |
| ABCC5 | deletion | Frame_Shift_Del | rs762628168 | c.3269delT | p.Leu1090CysfsTer26 | p.L1090Cfs*26 | O15440 | protein_coding | | | TCGA-2W-A8YY-01 | Cervix | cervical & endocervical cancer | Female | <65 | I/II | Chemotherapy | cisplatin | CR |
| Entrez ID | Symbol | Category | Interaction Types | Drug Claim Name | Drug Name | PMIDs |
| 10057 | ABCC5 | DRUGGABLE GENOME, ABC TRANSPORTER, TRANSPORTER | inhibitor | 178101454 | SILDENAFIL | |
| 10057 | ABCC5 | DRUGGABLE GENOME, ABC TRANSPORTER, TRANSPORTER | | irinotecan | IRINOTECAN | 26352872 |
| 10057 | ABCC5 | DRUGGABLE GENOME, ABC TRANSPORTER, TRANSPORTER | | oxaliplatin | OXALIPLATIN | 24924344 |
| 10057 | ABCC5 | DRUGGABLE GENOME, ABC TRANSPORTER, TRANSPORTER | | FLOXURIDINE | FLOXURIDINE | 20930123 |
| 10057 | ABCC5 | DRUGGABLE GENOME, ABC TRANSPORTER, TRANSPORTER | | zidovudine | ZIDOVUDINE | 22960662 |
| 10057 | ABCC5 | DRUGGABLE GENOME, ABC TRANSPORTER, TRANSPORTER | inhibitor | 252827486 | | |
| 10057 | ABCC5 | DRUGGABLE GENOME, ABC TRANSPORTER, TRANSPORTER | | fluorouracil | FLUOROURACIL | 26352872 |
| 10057 | ABCC5 | DRUGGABLE GENOME, ABC TRANSPORTER, TRANSPORTER | | leucovorin | LEUCOVORIN | 26352872 |
| 10057 | ABCC5 | DRUGGABLE GENOME, ABC TRANSPORTER, TRANSPORTER | | glibenclamide | GLYBURIDE | 27403931 |


