| Tissue | Expression Dynamics | Abbreviation |
| Colorectum (GSE201348) |  | FAP: Familial adenomatous polyposis |
| CRC: Colorectal cancer |
| Colorectum (HTA11) | 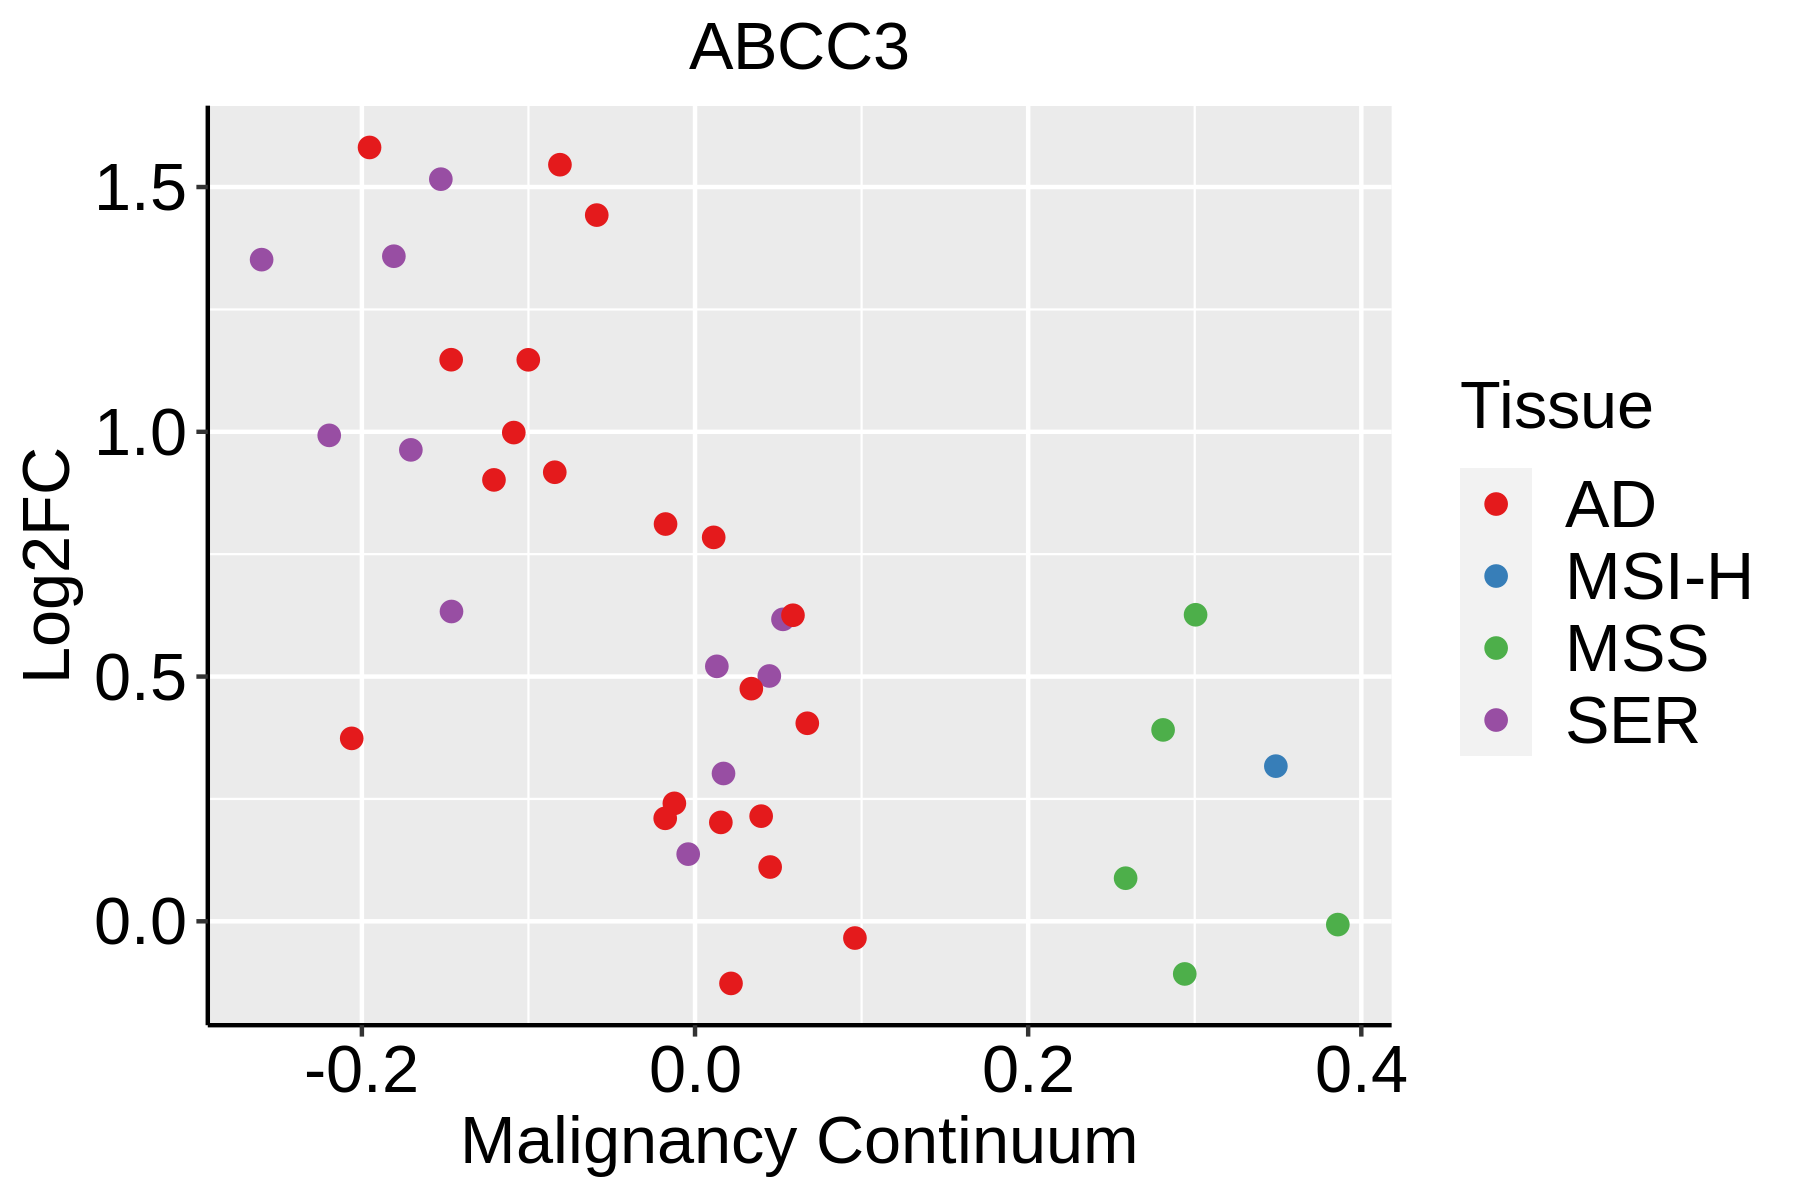 | AD: Adenomas |
| SER: Sessile serrated lesions |
| MSI-H: Microsatellite-high colorectal cancer |
| MSS: Microsatellite stable colorectal cancer |
| Esophagus | 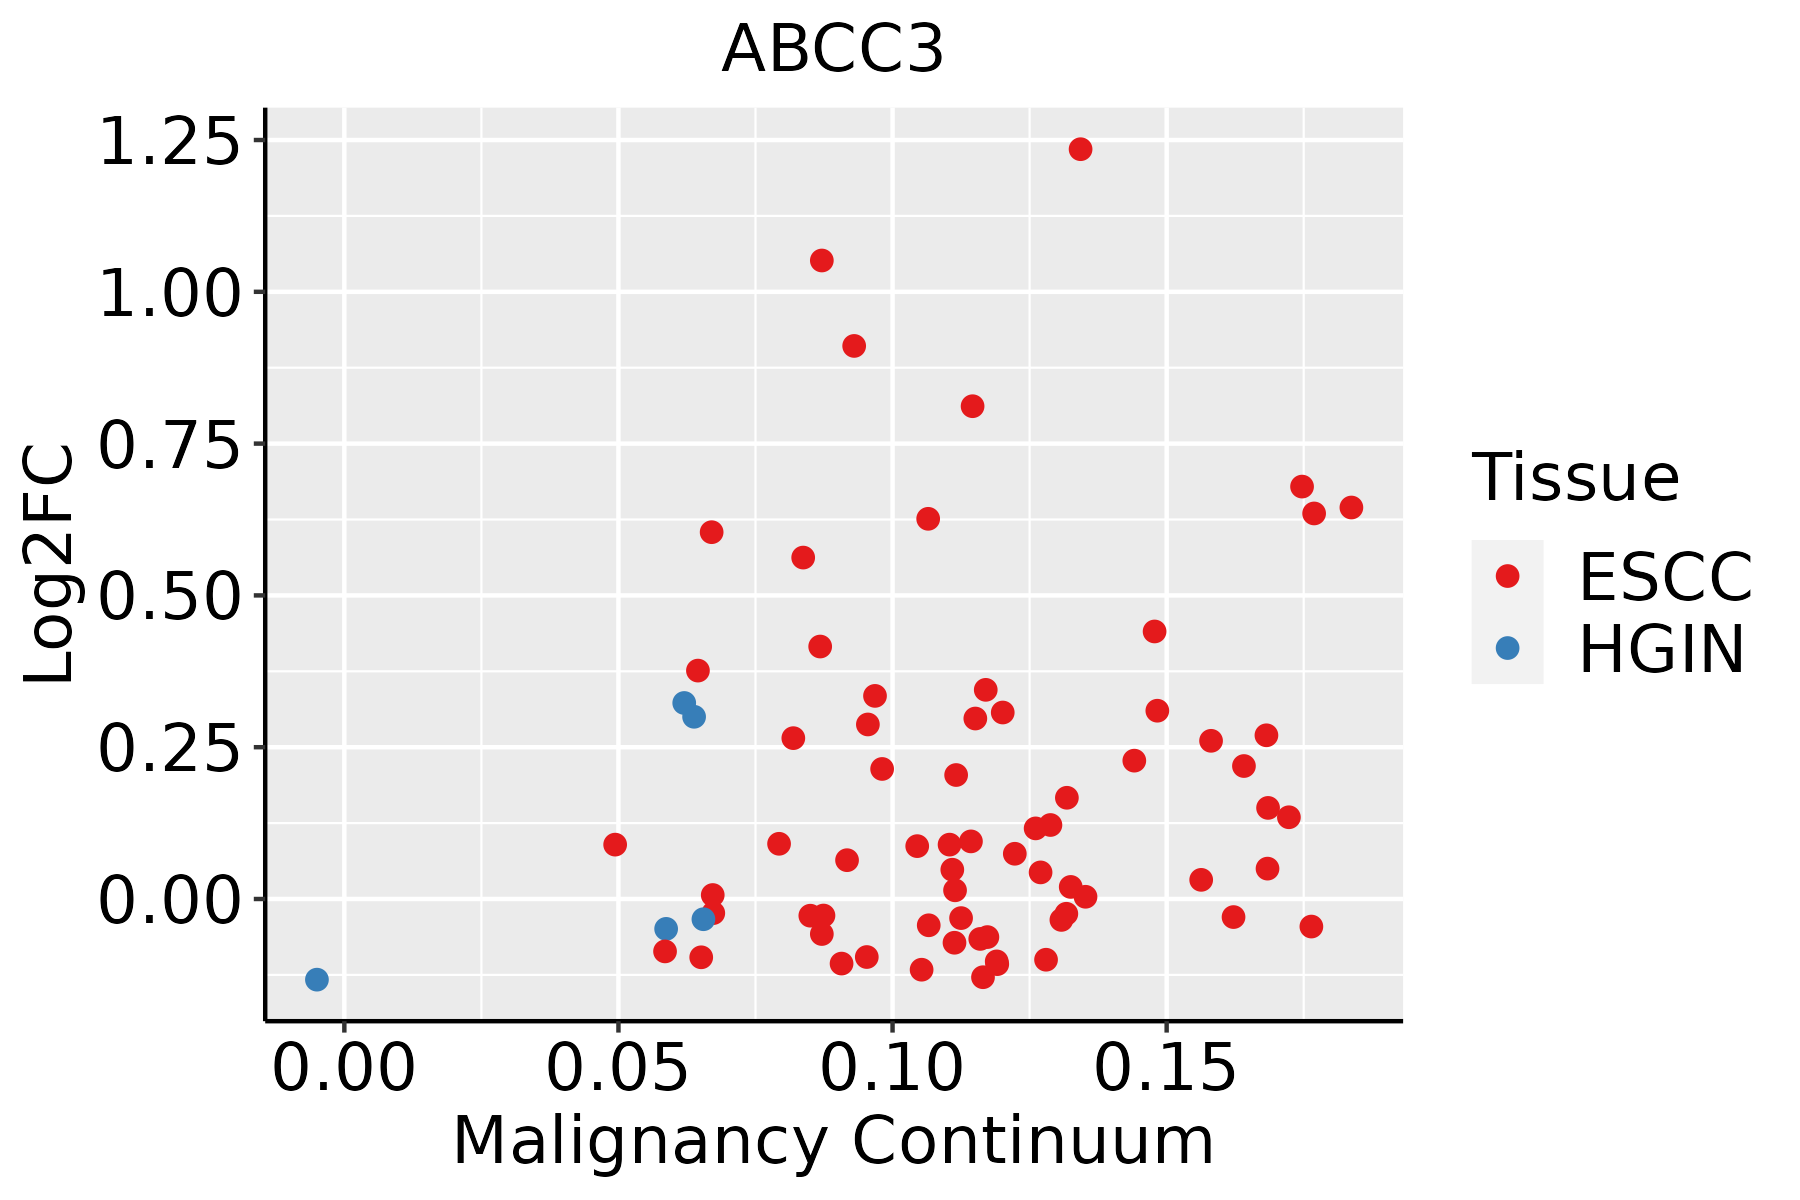 | ESCC: Esophageal squamous cell carcinoma |
| HGIN: High-grade intraepithelial neoplasias |
| LGIN: Low-grade intraepithelial neoplasias |
| GC | 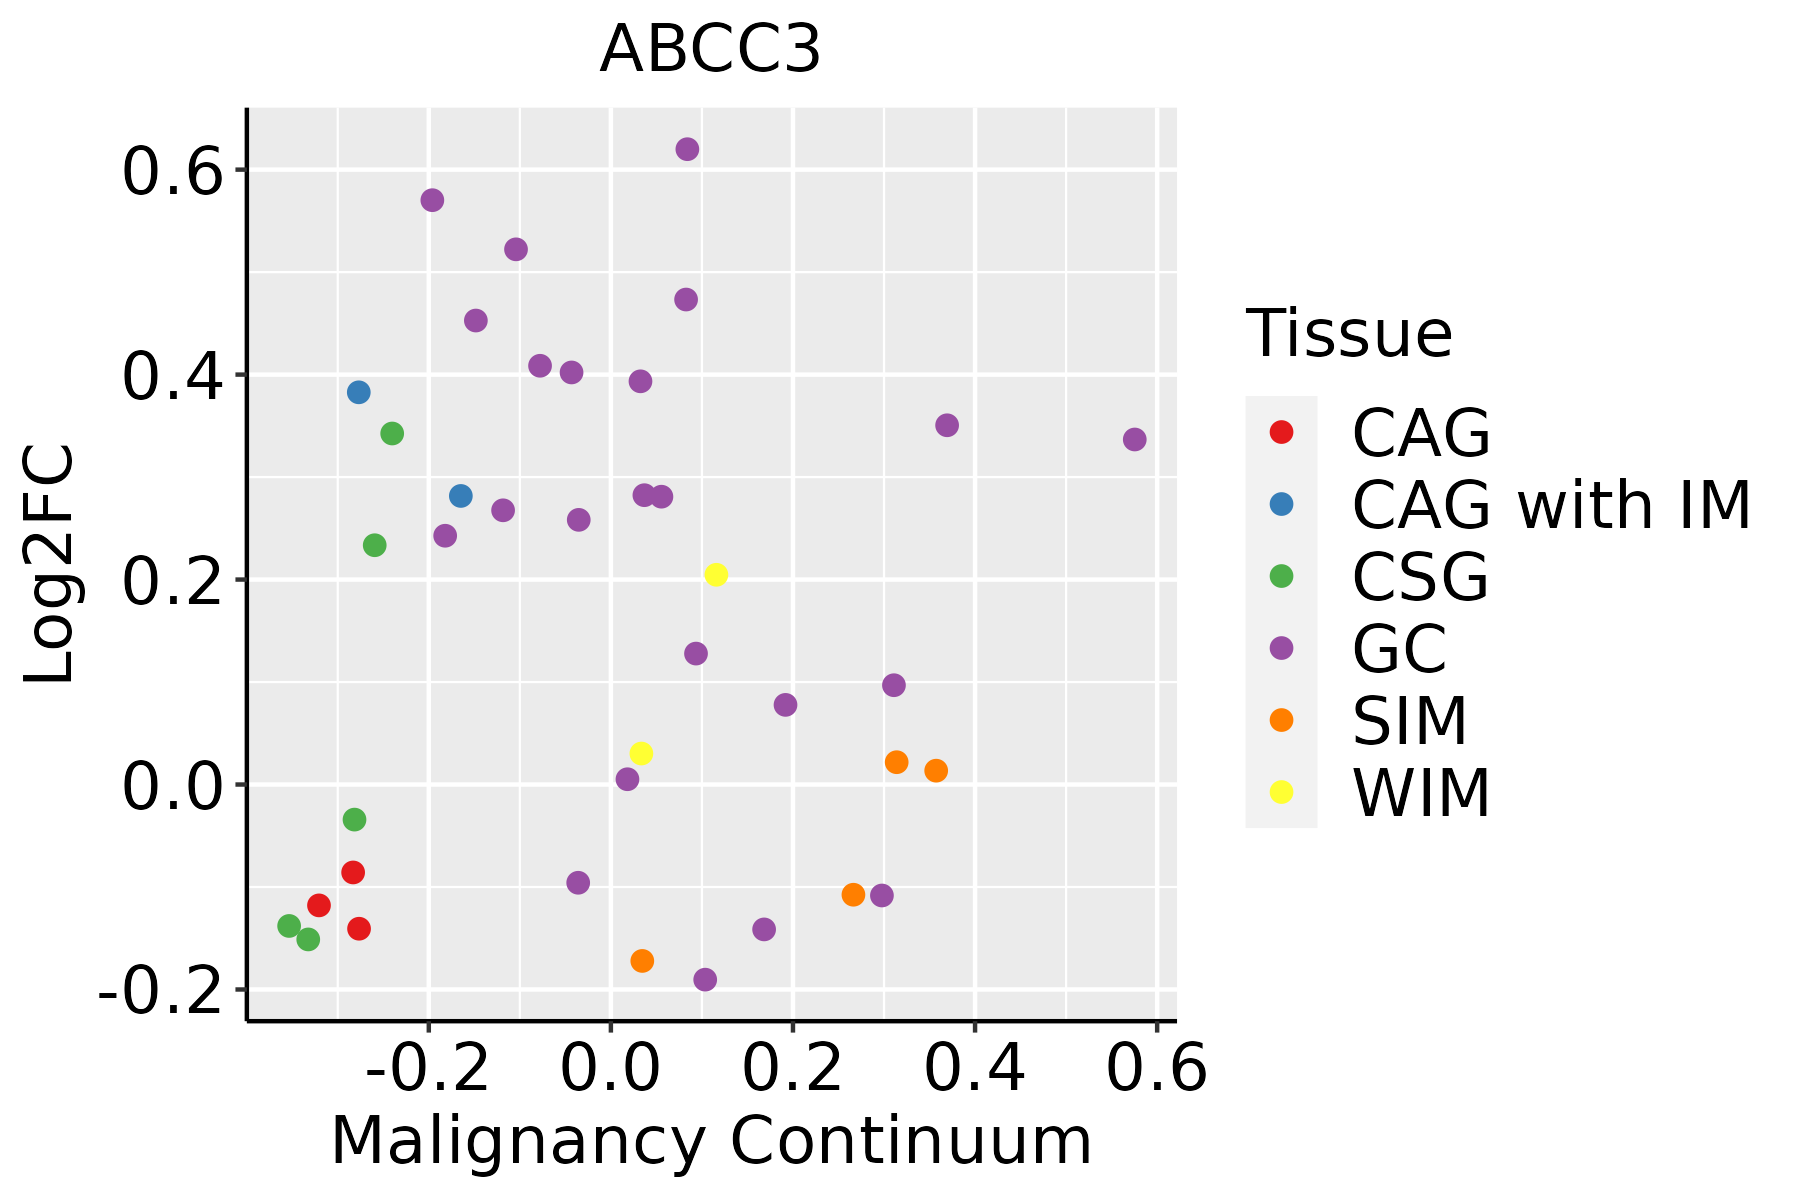 | CAG: Chronic atrophic gastritis |
| CAG with IM: Chronic atrophic gastritis with intestinal metaplasia |
| CSG: Chronic superficial gastritis |
| GC: Gastric cancer |
| SIM: Severe intestinal metaplasia |
| WIM: Wild intestinal metaplasia |
| Liver |  | HCC: Hepatocellular carcinoma |
| NAFLD: Non-alcoholic fatty liver disease |
| Lung |  | AAH: Atypical adenomatous hyperplasia |
| AIS: Adenocarcinoma in situ |
| IAC: Invasive lung adenocarcinoma |
| MIA: Minimally invasive adenocarcinoma |
| Oral Cavity | 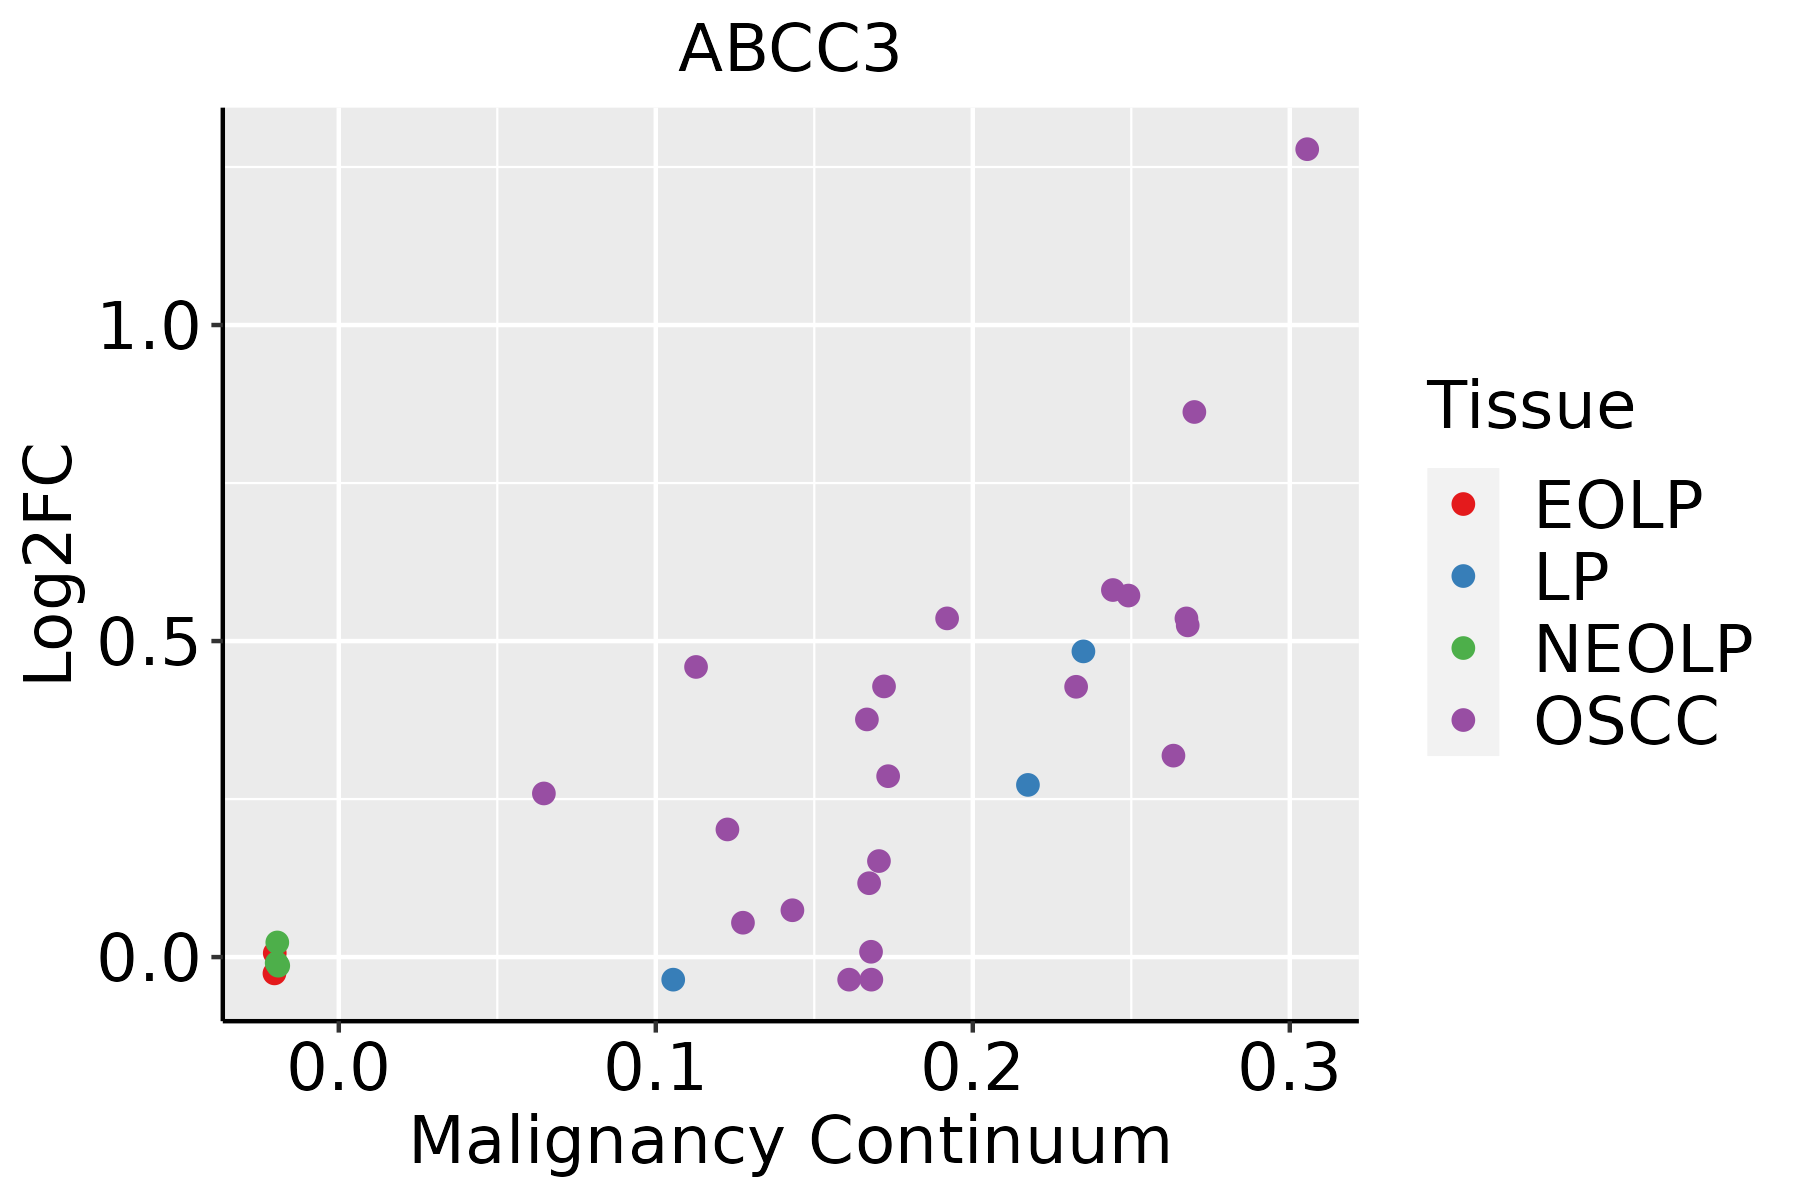 | EOLP: Erosive Oral lichen planus |
| LP: leukoplakia |
| NEOLP: Non-erosive oral lichen planus |
| OSCC: Oral squamous cell carcinoma |
| Prostate | 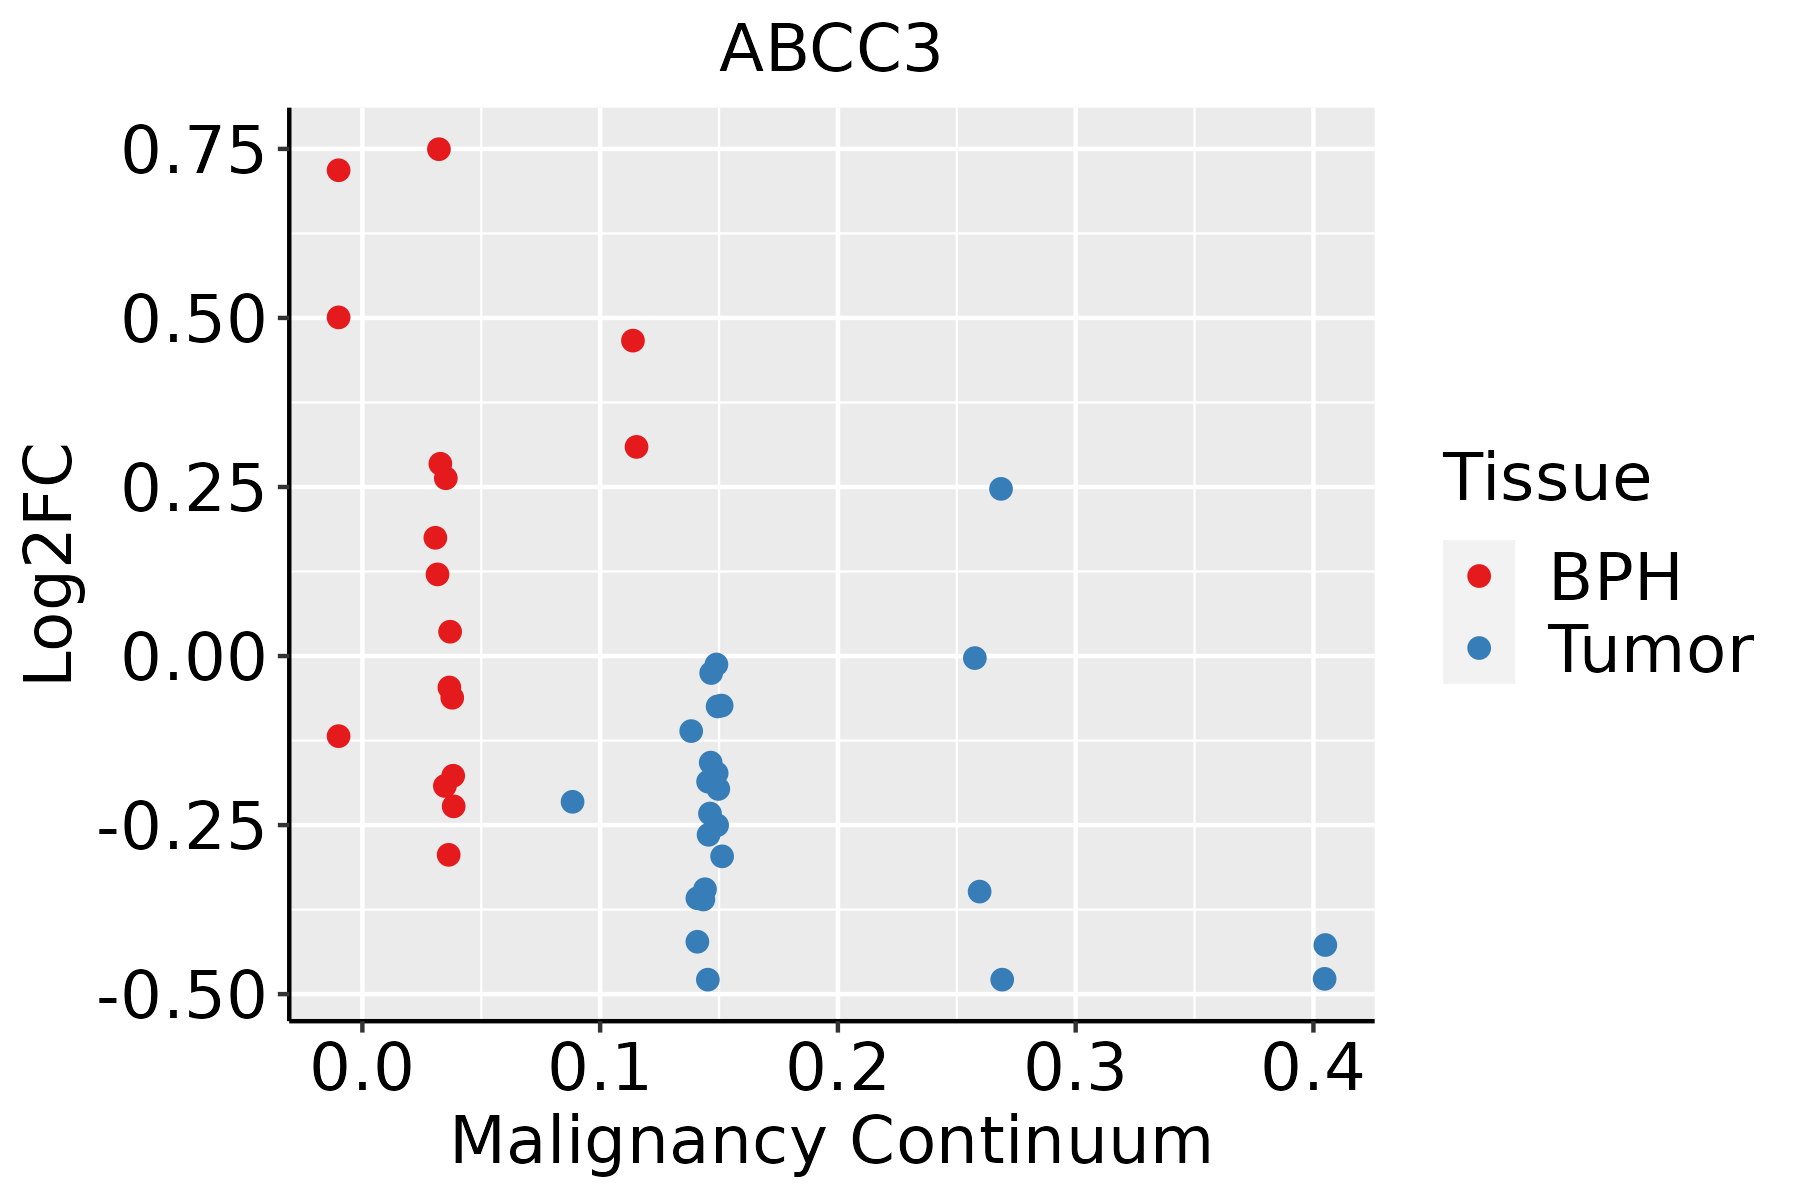 | BPH: Benign Prostatic Hyperplasia |
| Thyroid | 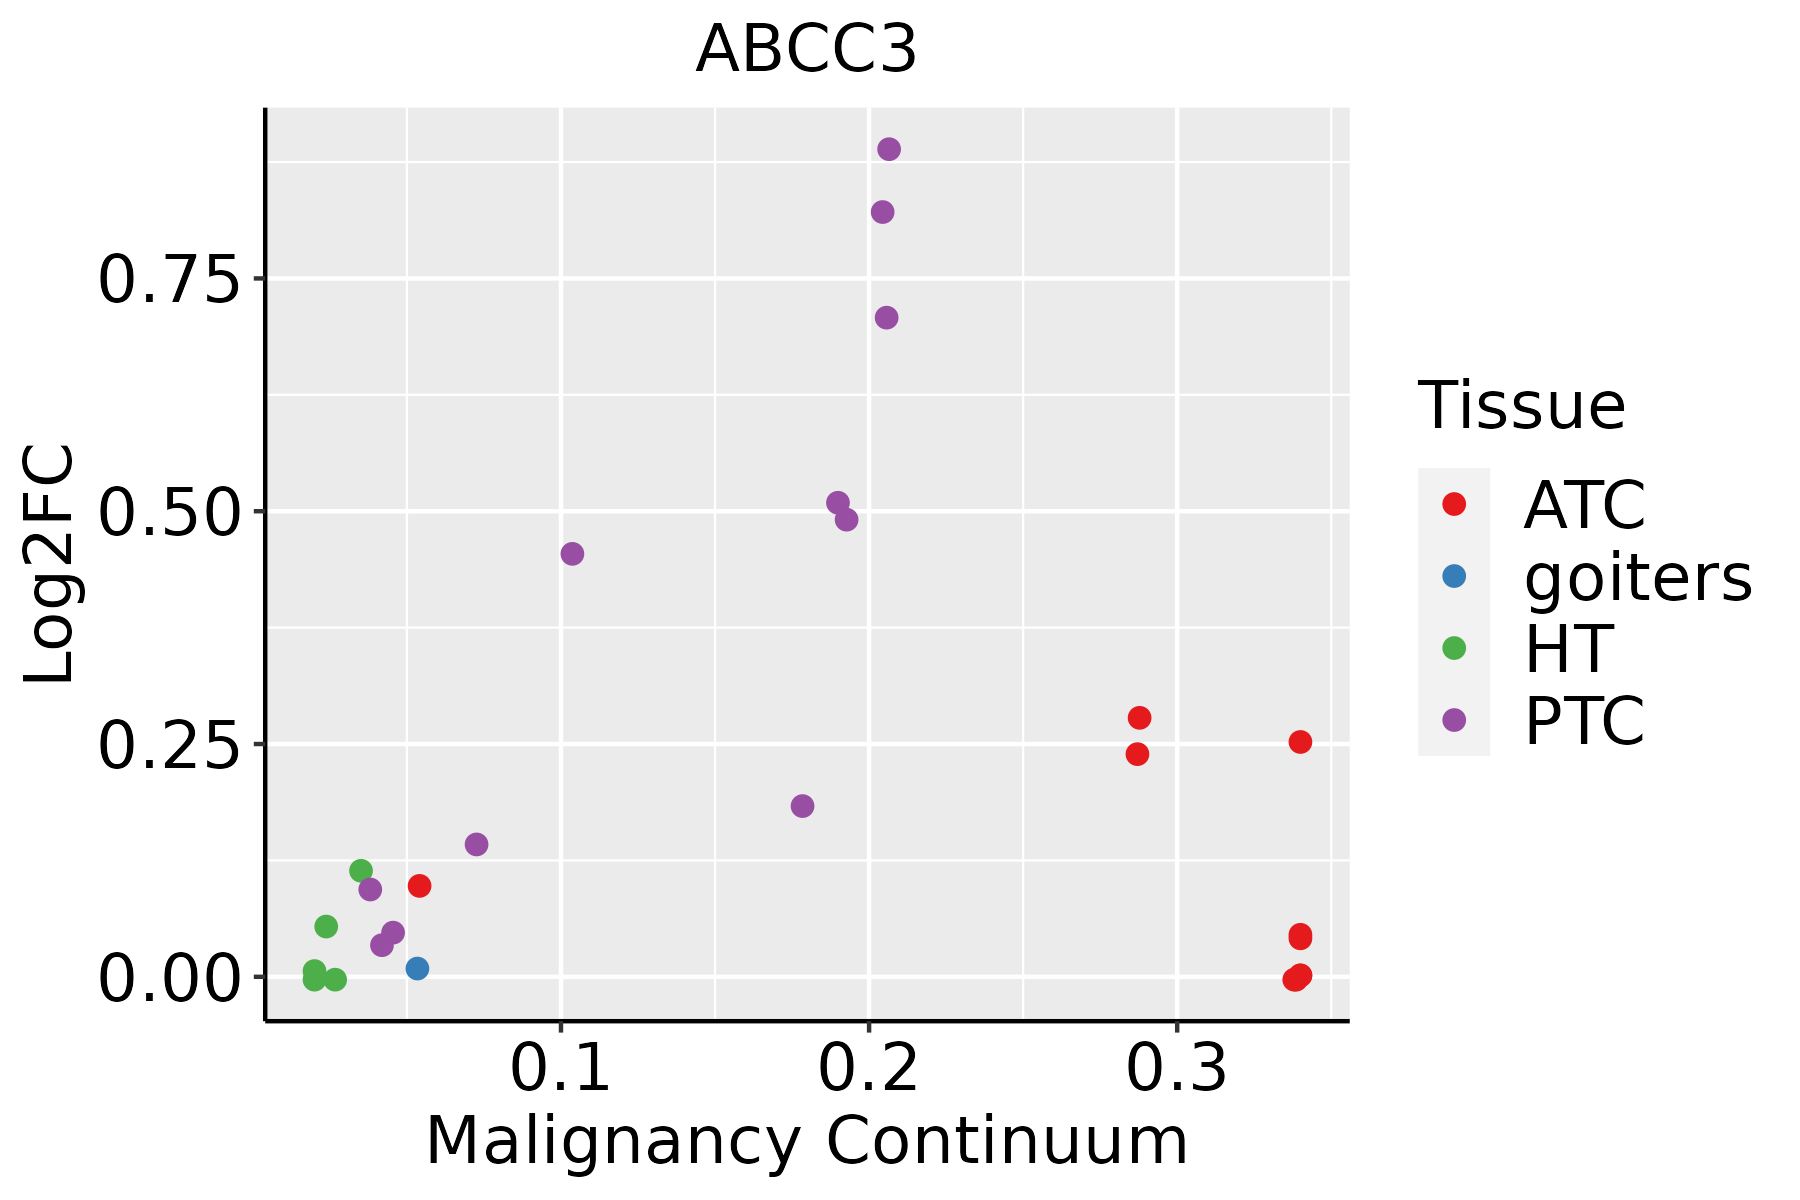 | ATC: Anaplastic thyroid cancer |
| HT: Hashimoto's thyroiditis |
| PTC: Papillary thyroid cancer |
| GO ID | Tissue | Disease Stage | Description | Gene Ratio | Bg Ratio | pvalue | p.adjust | Count |
| GO:0010876 | Colorectum | AD | lipid localization | 120/3918 | 448/18723 | 1.59e-03 | 1.33e-02 | 120 |
| GO:0006869 | Colorectum | AD | lipid transport | 108/3918 | 398/18723 | 1.67e-03 | 1.39e-02 | 108 |
| GO:0015698 | Colorectum | AD | inorganic anion transport | 52/3918 | 180/18723 | 6.83e-03 | 4.22e-02 | 52 |
| GO:0150104 | Colorectum | MSS | transport across blood-brain barrier | 28/3467 | 87/18723 | 1.54e-03 | 1.41e-02 | 28 |
| GO:0010232 | Colorectum | MSS | vascular transport | 28/3467 | 88/18723 | 1.87e-03 | 1.64e-02 | 28 |
| GO:00108761 | Colorectum | MSS | lipid localization | 104/3467 | 448/18723 | 6.76e-03 | 4.38e-02 | 104 |
| GO:01501041 | Colorectum | FAP | transport across blood-brain barrier | 25/2622 | 87/18723 | 2.63e-04 | 3.59e-03 | 25 |
| GO:00068691 | Colorectum | FAP | lipid transport | 81/2622 | 398/18723 | 2.84e-04 | 3.76e-03 | 81 |
| GO:00102321 | Colorectum | FAP | vascular transport | 25/2622 | 88/18723 | 3.19e-04 | 4.12e-03 | 25 |
| GO:0003018 | Colorectum | FAP | vascular process in circulatory system | 56/2622 | 263/18723 | 7.67e-04 | 8.12e-03 | 56 |
| GO:00108762 | Colorectum | FAP | lipid localization | 85/2622 | 448/18723 | 1.92e-03 | 1.63e-02 | 85 |
| GO:00156981 | Colorectum | FAP | inorganic anion transport | 38/2622 | 180/18723 | 5.73e-03 | 3.67e-02 | 38 |
| GO:00030181 | Colorectum | CRC | vascular process in circulatory system | 45/2078 | 263/18723 | 2.10e-03 | 2.08e-02 | 45 |
| GO:00068692 | Colorectum | CRC | lipid transport | 63/2078 | 398/18723 | 2.36e-03 | 2.26e-02 | 63 |
| GO:00108763 | Colorectum | CRC | lipid localization | 68/2078 | 448/18723 | 4.60e-03 | 3.58e-02 | 68 |
| GO:01501042 | Colorectum | CRC | transport across blood-brain barrier | 18/2078 | 87/18723 | 6.50e-03 | 4.69e-02 | 18 |
| GO:00108765 | Liver | NAFLD | lipid localization | 79/1882 | 448/18723 | 4.75e-07 | 2.92e-05 | 79 |
| GO:00068694 | Liver | NAFLD | lipid transport | 71/1882 | 398/18723 | 1.16e-06 | 5.59e-05 | 71 |
| GO:0015850 | Liver | NAFLD | organic hydroxy compound transport | 50/1882 | 284/18723 | 6.01e-05 | 1.32e-03 | 50 |
| GO:00030182 | Liver | NAFLD | vascular process in circulatory system | 46/1882 | 263/18723 | 1.36e-04 | 2.58e-03 | 46 |
| Hugo Symbol | Variant Class | Variant Classification | dbSNP RS | HGVSc | HGVSp | HGVSp Short | SWISSPROT | BIOTYPE | SIFT | PolyPhen | Tumor Sample Barcode | Tissue | Histology | Sex | Age | Stage | Therapy Types | Drugs | Outcome |
| ABCC3 | SNV | Missense_Mutation | novel | c.2348N>G | p.Ser783Cys | p.S783C | O15438 | protein_coding | deleterious(0) | possibly_damaging(0.778) | TCGA-3C-AALI-01 | Breast | breast invasive carcinoma | Female | <65 | I/II | Unspecific | Poly E | Complete Response |
| ABCC3 | SNV | Missense_Mutation | | c.2531C>G | p.Ser844Cys | p.S844C | O15438 | protein_coding | deleterious(0.01) | possibly_damaging(0.625) | TCGA-A8-A0A7-01 | Breast | breast invasive carcinoma | Female | <65 | I/II | Unknown | Unknown | SD |
| ABCC3 | SNV | Missense_Mutation | novel | c.2877N>A | p.Phe959Leu | p.F959L | O15438 | protein_coding | deleterious(0.01) | benign(0.188) | TCGA-AN-A046-01 | Breast | breast invasive carcinoma | Female | >=65 | I/II | Unknown | Unknown | SD |
| ABCC3 | SNV | Missense_Mutation | | c.2521N>A | p.Arg841Ser | p.R841S | O15438 | protein_coding | tolerated(0.17) | benign(0.057) | TCGA-AR-A255-01 | Breast | breast invasive carcinoma | Female | <65 | I/II | Targeted Molecular therapy | trastuzumab | SD |
| ABCC3 | SNV | Missense_Mutation | | c.2213N>T | p.Gly738Val | p.G738V | O15438 | protein_coding | deleterious(0) | probably_damaging(1) | TCGA-BH-A0BZ-01 | Breast | breast invasive carcinoma | Female | <65 | III/IV | Chemotherapy | doxorubicin | CR |
| ABCC3 | SNV | Missense_Mutation | novel | c.2383N>T | p.Gly795Trp | p.G795W | O15438 | protein_coding | deleterious(0) | probably_damaging(1) | TCGA-E9-A1NC-01 | Breast | breast invasive carcinoma | Female | <65 | I/II | Chemotherapy | doxorubicin | CR |
| ABCC3 | SNV | Missense_Mutation | | c.3560C>G | p.Pro1187Arg | p.P1187R | O15438 | protein_coding | deleterious(0) | possibly_damaging(0.845) | TCGA-E9-A247-01 | Breast | breast invasive carcinoma | Female | <65 | I/II | Hormone Therapy | tamoxiphen | SD |
| ABCC3 | SNV | Missense_Mutation | rs755779050 | c.2273G>A | p.Arg758Gln | p.R758Q | O15438 | protein_coding | deleterious(0) | probably_damaging(1) | TCGA-GM-A3NY-01 | Breast | breast invasive carcinoma | Female | >=65 | I/II | Hormone Therapy | arimidex | SD |
| ABCC3 | SNV | Missense_Mutation | novel | c.4207C>T | p.His1403Tyr | p.H1403Y | O15438 | protein_coding | deleterious(0) | probably_damaging(0.915) | TCGA-PL-A8LX-01 | Breast | breast invasive carcinoma | Female | <65 | III/IV | Unknown | Unknown | SD |
| ABCC3 | deletion | Frame_Shift_Del | novel | c.3421delN | p.Ser1141GlnfsTer15 | p.S1141Qfs*15 | O15438 | protein_coding | | | TCGA-D8-A27V-01 | Breast | breast invasive carcinoma | Female | <65 | I/II | Hormone Therapy | tamoxiphen | SD |
| Entrez ID | Symbol | Category | Interaction Types | Drug Claim Name | Drug Name | PMIDs |
| 8714 | ABCC3 | DRUG RESISTANCE, DRUGGABLE GENOME, TRANSPORTER, ABC TRANSPORTER, CLINICALLY ACTIONABLE | | EMTRICITABINE | EMTRICITABINE | 17172311 |
| 8714 | ABCC3 | DRUG RESISTANCE, DRUGGABLE GENOME, TRANSPORTER, ABC TRANSPORTER, CLINICALLY ACTIONABLE | | MONOMETHYL AURISTATIN E | | 18593940 |
| 8714 | ABCC3 | DRUG RESISTANCE, DRUGGABLE GENOME, TRANSPORTER, ABC TRANSPORTER, CLINICALLY ACTIONABLE | | methotrexate | METHOTREXATE | 22016816,21317831,21606946 |
| 8714 | ABCC3 | DRUG RESISTANCE, DRUGGABLE GENOME, TRANSPORTER, ABC TRANSPORTER, CLINICALLY ACTIONABLE | | CEFOPERAZONE | CEFOPERAZONE | 22166395 |
| 8714 | ABCC3 | DRUG RESISTANCE, DRUGGABLE GENOME, TRANSPORTER, ABC TRANSPORTER, CLINICALLY ACTIONABLE | | DOXORUBICIN | DOXORUBICIN | |
| 8714 | ABCC3 | DRUG RESISTANCE, DRUGGABLE GENOME, TRANSPORTER, ABC TRANSPORTER, CLINICALLY ACTIONABLE | | ABACAVIR | ABACAVIR | 17172311 |
| 8714 | ABCC3 | DRUG RESISTANCE, DRUGGABLE GENOME, TRANSPORTER, ABC TRANSPORTER, CLINICALLY ACTIONABLE | | CEFACLOR | CEFACLOR | 22166395 |
| 8714 | ABCC3 | DRUG RESISTANCE, DRUGGABLE GENOME, TRANSPORTER, ABC TRANSPORTER, CLINICALLY ACTIONABLE | | TENOFOVIR | TENOFOVIR | 17172311 |
| 8714 | ABCC3 | DRUG RESISTANCE, DRUGGABLE GENOME, TRANSPORTER, ABC TRANSPORTER, CLINICALLY ACTIONABLE | | DELAVIRDINE | DELAVIRDINE | 17172311 |
| 8714 | ABCC3 | DRUG RESISTANCE, DRUGGABLE GENOME, TRANSPORTER, ABC TRANSPORTER, CLINICALLY ACTIONABLE | | cisplatin | CISPLATIN | 25141953,22016816,31666714,27457817 |


