Schematic overview of the cellular and molecular mechanisms involved in the cancer progression, including the proposed cellular and molecular mechanisms in cancer cells trajectory. AT1: alveolar type 1 cells; AT2: alveolar type 2 cells; AAH: atypical adenomatous hyperplasia; AIS: adenocarcinoma in situ; MIA: minimally invasive adenocarcinoma; IA: invasive adenocarcinoma; EMT: epithelial-mesenchymal transition

Home

Download

Statistics

Help

Contact

Center for Computational Systems Medicine
leaf

Gene summary

leaf

Malignant transformation analysis

leaf

Malignant transformation related pathway analysis

leaf

Cell-cell communication analysis

leaf

Single-cell gene regulatory network inference analysis

leaf

Somatic mutation of malignant transformation related genes

leaf

Related drugs of malignant transformation related genes

Gene: ABCC1

Gene summary for ABCC1

check button Gene summary.

Gene informationSpeciesHuman
Gene symbol

ABCC1

Gene ID

4363

Gene nameATP binding cassette subfamily C member 1
Gene AliasABC29
Cytomap16p13.11
Gene Typeprotein-coding
GO ID

GO:0003008

UniProtAcc

P33527


Top

Malignant transformation analysis

check button Identification of the aberrant gene expression in precancerous and cancerous lesions by comparing the gene expression of stem-like cells in diseased tissues with normal stem cells
check button Malignant transformation involving gene list.
Entrez IDSymbolReplicatesSpeciesOrganTissueAdj P-valueLog2FCMalignancy
4363ABCC1CCI_1HumanCervixCC4.31e-138.82e-010.528
4363ABCC1CCI_2HumanCervixCC5.77e-076.57e-010.5249
4363ABCC1CCI_3HumanCervixCC7.40e-148.29e-010.516
4363ABCC1HTA11_3410_2000001011HumanColorectumAD6.85e-035.79e-020.0155
4363ABCC1HTA11_1391_2000001011HumanColorectumAD8.75e-101.08e+00-0.059
4363ABCC1HTA11_866_3004761011HumanColorectumAD2.01e-024.61e-010.096
4363ABCC1HTA11_7696_3000711011HumanColorectumAD8.52e-035.09e-010.0674
4363ABCC1HTA11_99999965104_69814HumanColorectumMSS7.52e-068.68e-010.281
4363ABCC1HTA11_99999971662_82457HumanColorectumMSS1.18e-067.01e-010.3859
4363ABCC1HTA11_99999973899_84307HumanColorectumMSS1.64e-051.02e+000.2585
4363ABCC1HTA11_99999974143_84620HumanColorectumMSS4.10e-054.88e-010.3005
4363ABCC1A015-C-203HumanColorectumFAP4.57e-107.91e-02-0.1294
4363ABCC1A002-C-201HumanColorectumFAP3.76e-043.17e-010.0324
4363ABCC1A001-C-108HumanColorectumFAP6.13e-041.44e-01-0.0272
4363ABCC1A002-C-021HumanColorectumFAP6.97e-064.48e-010.1171
4363ABCC1A002-C-205HumanColorectumFAP7.87e-112.92e-01-0.1236
4363ABCC1A015-C-006HumanColorectumFAP1.22e-049.83e-04-0.0994
4363ABCC1A015-C-106HumanColorectumFAP3.56e-022.32e-01-0.0511
4363ABCC1A002-C-114HumanColorectumFAP1.89e-058.51e-02-0.1561
4363ABCC1A015-C-104HumanColorectumFAP3.71e-121.01e-01-0.1899
Page: 1 2 3 4 5 6 7 

check button Transcriptomic changes along malignancy continuum.
TissueExpression DynamicsAbbreviation
CervixThe image shows the transcriptomic changes along malignancy continuum.log2FC in expression of this searched gene in stem-like cells from each diseased tissue sample relative to stem-like cells in normal samples in each tissue plotted against the malignancy continuum. Samples are colored based on if they are from different disease stage.CC: Cervix cancer
HSIL_HPV: HPV-infected high-grade squamous intraepithelial lesions
N_HPV: HPV-infected normal cervix
Colorectum (GSE201348)The image shows the transcriptomic changes along malignancy continuum.log2FC in expression of this searched gene in stem-like cells from each diseased tissue sample relative to stem-like cells in normal samples in each tissue plotted against the malignancy continuum. Samples are colored based on if they are from different disease stage.FAP: Familial adenomatous polyposis
CRC: Colorectal cancer
Colorectum (HTA11)The image shows the transcriptomic changes along malignancy continuum.log2FC in expression of this searched gene in stem-like cells from each diseased tissue sample relative to stem-like cells in normal samples in each tissue plotted against the malignancy continuum. Samples are colored based on if they are from different disease stage.AD: Adenomas
SER: Sessile serrated lesions
MSI-H: Microsatellite-high colorectal cancer
MSS: Microsatellite stable colorectal cancer
EndometriumThe image shows the transcriptomic changes along malignancy continuum.log2FC in expression of this searched gene in stem-like cells from each diseased tissue sample relative to stem-like cells in normal samples in each tissue plotted against the malignancy continuum. Samples are colored based on if they are from different disease stage.AEH: Atypical endometrial hyperplasia
EEC: Endometrioid Cancer
EsophagusThe image shows the transcriptomic changes along malignancy continuum.log2FC in expression of this searched gene in stem-like cells from each diseased tissue sample relative to stem-like cells in normal samples in each tissue plotted against the malignancy continuum. Samples are colored based on if they are from different disease stage.ESCC: Esophageal squamous cell carcinoma
HGIN: High-grade intraepithelial neoplasias
LGIN: Low-grade intraepithelial neoplasias
Oral CavityThe image shows the transcriptomic changes along malignancy continuum.log2FC in expression of this searched gene in stem-like cells from each diseased tissue sample relative to stem-like cells in normal samples in each tissue plotted against the malignancy continuum. Samples are colored based on if they are from different disease stage.
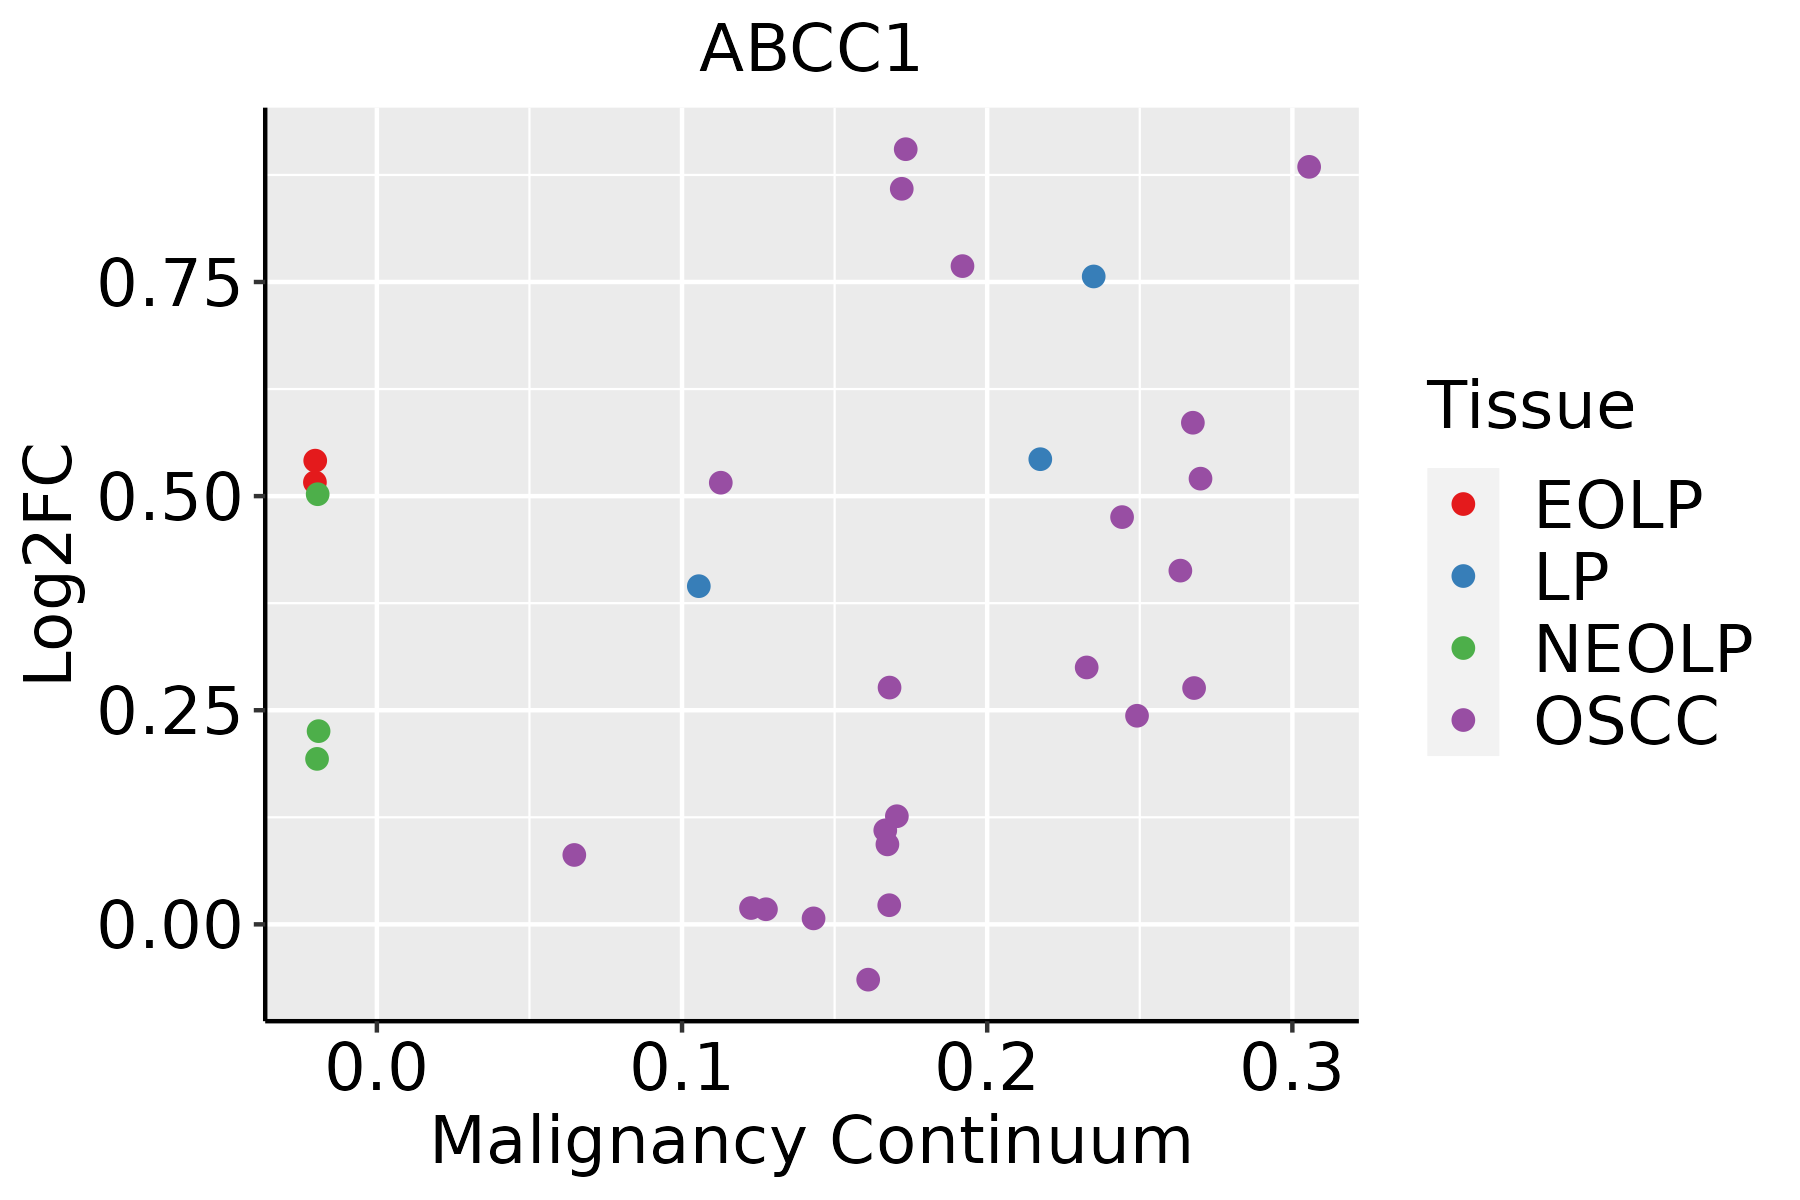
EOLP: Erosive Oral lichen planus
LP: leukoplakia
NEOLP: Non-erosive oral lichen planus
OSCC: Oral squamous cell carcinoma
ProstateThe image shows the transcriptomic changes along malignancy continuum.log2FC in expression of this searched gene in stem-like cells from each diseased tissue sample relative to stem-like cells in normal samples in each tissue plotted against the malignancy continuum. Samples are colored based on if they are from different disease stage.BPH: Benign Prostatic Hyperplasia
ThyroidThe image shows the transcriptomic changes along malignancy continuum.log2FC in expression of this searched gene in stem-like cells from each diseased tissue sample relative to stem-like cells in normal samples in each tissue plotted against the malignancy continuum. Samples are colored based on if they are from different disease stage.ATC: Anaplastic thyroid cancer
HT: Hashimoto's thyroiditis
PTC: Papillary thyroid cancer
∗log2FC in expression of this searched gene in stem-like cells from each diseased tissue sample relative to stem-like cells in normal samples in each tissue plotted against the malignancy continuum. Samples are colored based on if they are from different disease stage.

Top

Malignant transformation related pathway analysis

check buttonFind out the enriched GO biological processes and KEGG pathways involved in transition from healthy to precancer to cancer
check button Figure of enriched GO biological processes.
TissueDisease StageEnriched GO biological Processes
ColorectumADGO analysis - Figure of enriched GO biological processes: Top 15 enriched GO BP terms are showed in the bar plot of each disease state in each tissue. Each row represents a significant GO biological process which is colored according to the -log10(p.adjust).
ColorectumSERGO analysis - Figure of enriched GO biological processes: Top 15 enriched GO BP terms are showed in the bar plot of each disease state in each tissue. Each row represents a significant GO biological process which is colored according to the -log10(p.adjust).
ColorectumMSSGO analysis - Figure of enriched GO biological processes: Top 15 enriched GO BP terms are showed in the bar plot of each disease state in each tissue. Each row represents a significant GO biological process which is colored according to the -log10(p.adjust).
ColorectumMSI-HGO analysis - Figure of enriched GO biological processes: Top 15 enriched GO BP terms are showed in the bar plot of each disease state in each tissue. Each row represents a significant GO biological process which is colored according to the -log10(p.adjust).
ColorectumFAPGO analysis - Figure of enriched GO biological processes: Top 15 enriched GO BP terms are showed in the bar plot of each disease state in each tissue. Each row represents a significant GO biological process which is colored according to the -log10(p.adjust).
∗Top 15 enriched GO BP terms are showed in the bar plot of each disease state in each tissue. Each row represents a significant GO biological process which is colored according to the -log10(p.adjust).
Page: 1 2 3 4 5 6 7 8 9 

check button Enriched GO biological processes.
GO IDTissueDisease StageDescriptionGene RatioBg Ratiopvaluep.adjustCount
GO:000697910CervixCCresponse to oxidative stress102/2311446/187232.99e-104.36e-08102
GO:00321035CervixCCpositive regulation of response to external stimulus95/2311427/187235.44e-095.03e-0795
GO:00603267CervixCCcell chemotaxis73/2311310/187232.82e-081.96e-0673
GO:006219710CervixCCcellular response to chemical stress76/2311337/187231.01e-075.25e-0676
GO:003459910CervixCCcellular response to oxidative stress63/2311288/187233.58e-069.50e-0563
GO:00313494CervixCCpositive regulation of defense response60/2311278/187239.38e-062.11e-0460
GO:19016538CervixCCcellular response to peptide72/2311359/187231.89e-053.48e-0472
GO:00507273CervixCCregulation of inflammatory response75/2311386/187233.95e-056.18e-0475
GO:00507294CervixCCpositive regulation of inflammatory response34/2311142/187239.51e-051.25e-0334
GO:00467008CervixCCheterocycle catabolic process80/2311445/187233.23e-043.42e-0380
GO:00442709CervixCCcellular nitrogen compound catabolic process79/2311451/187237.80e-046.91e-0379
GO:00194398CervixCCaromatic compound catabolic process79/2311467/187232.14e-031.54e-0279
GO:00094109CervixCCresponse to xenobiotic stimulus78/2311462/187232.39e-031.70e-0278
GO:19013618CervixCCorganic cyclic compound catabolic process80/2311495/187236.77e-033.72e-0280
GO:00158337CervixCCpeptide transport46/2311264/187239.69e-034.78e-0246
GO:0044270ColorectumADcellular nitrogen compound catabolic process147/3918451/187233.35e-092.23e-07147
GO:0046700ColorectumADheterocycle catabolic process145/3918445/187234.37e-092.84e-07145
GO:0006979ColorectumADresponse to oxidative stress145/3918446/187235.16e-093.23e-07145
GO:0019439ColorectumADaromatic compound catabolic process146/3918467/187237.48e-083.84e-06146
GO:1901361ColorectumADorganic cyclic compound catabolic process153/3918495/187238.23e-084.18e-06153
Page: 1 2 3 4 5 6 7 8 9 10 11 

check button Enriched KEGG pathways.
Pathway IDTissueDisease StageDescriptionGene RatioBg Ratiopvaluep.adjustqvalueCount
hsa0407110CervixCCSphingolipid signaling pathway35/1267121/84655.70e-053.93e-042.32e-0435
hsa0407113CervixCCSphingolipid signaling pathway35/1267121/84655.70e-053.93e-042.32e-0435
hsa040712ColorectumMSSSphingolipid signaling pathway40/1875121/84653.56e-031.64e-021.01e-0240
hsa040713ColorectumMSSSphingolipid signaling pathway40/1875121/84653.56e-031.64e-021.01e-0240
hsa040714ColorectumFAPSphingolipid signaling pathway34/1404121/84659.53e-045.22e-033.17e-0334
hsa040715ColorectumFAPSphingolipid signaling pathway34/1404121/84659.53e-045.22e-033.17e-0334
hsa040716ColorectumCRCSphingolipid signaling pathway30/1091121/84652.49e-043.09e-032.09e-0330
hsa040717ColorectumCRCSphingolipid signaling pathway30/1091121/84652.49e-043.09e-032.09e-0330
Page: 1 

Top

Cell-cell communication analysis

check buttonIdentification of potential cell-cell interactions between two cell types and their ligand-receptor pairs for different disease states
LigandReceptorLRpairPathwayTissueDisease Stage
Page: 1 

Top

Single-cell gene regulatory network inference analysis

check buttonFind out the significant the regulons (TFs) and the target genes of each regulon across cell types for different disease states
TFCell TypeTissueDisease StageTarget GeneRSSRegulon Activity
∗The dot plots of a searched regulon are shown for all cell subpopulations in each disease state of each tissue based on the regulon specific score inferred using pySCENIC and by calculating the average expression.
Page: 1 

Top

Somatic mutation of malignant transformation related genes

check buttonAnnotation of somatic variants for genes involved in malignant transformation
Hugo SymbolVariant ClassVariant ClassificationdbSNP RSHGVScHGVSpHGVSp ShortSWISSPROTBIOTYPESIFTPolyPhenTumor Sample BarcodeTissueHistologySexAgeStageTherapy TypesDrugsOutcome
ABCC1SNVMissense_Mutationc.1390N>Gp.Pro464Alap.P464AP33527protein_codingdeleterious(0.04)benign(0.4)TCGA-AN-A0AR-01Breastbreast invasive carcinomaFemale<65I/IIUnknownUnknownSD
ABCC1SNVMissense_Mutationrs377634982c.870N>Cp.Lys290Asnp.K290NP33527protein_codingtolerated(0.25)benign(0)TCGA-AN-A0XU-01Breastbreast invasive carcinomaFemale<65I/IIUnknownUnknownSD
ABCC1SNVMissense_Mutationc.3622N>Gp.Asn1208Aspp.N1208DP33527protein_codingdeleterious(0.01)probably_damaging(0.999)TCGA-BH-A0HA-01Breastbreast invasive carcinomaFemale<65I/IIUnknownUnknownSD
ABCC1SNVMissense_Mutationc.4085G>Ap.Gly1362Aspp.G1362DP33527protein_codingdeleterious(0)probably_damaging(1)TCGA-BH-A18G-01Breastbreast invasive carcinomaFemale>=65I/IIUnknownUnknownSD
ABCC1SNVMissense_Mutationrs756405833c.3781G>Ap.Val1261Metp.V1261MP33527protein_codingdeleterious(0)possibly_damaging(0.777)TCGA-D8-A13Z-01Breastbreast invasive carcinomaFemale<65I/IIChemotherapydoxorubicineSD
ABCC1SNVMissense_Mutationnovelc.1664N>Tp.Cys555Phep.C555FP33527protein_codingdeleterious(0.03)probably_damaging(0.926)TCGA-E9-A244-01Breastbreast invasive carcinomaFemale<65I/IIChemotherapycyclophosphamideSD
ABCC1SNVMissense_Mutationc.1207N>Tp.Val403Phep.V403FP33527protein_codingdeleterious(0)possibly_damaging(0.905)TCGA-GM-A2DM-01Breastbreast invasive carcinomaFemale<65I/IIChemotherapytaxolCR
ABCC1insertionIn_Frame_Insnovelc.631_632insACCCAGGCTGGAGTGCGATGGCACAATCTCAGCTTGCTGCAAp.Ser211delinsTyrProGlyTrpSerAlaMetAlaGlnSerGlnLeuAlaAlaThrp.S211delinsYPGWSAMAQSQLAATP33527protein_codingTCGA-A2-A04Y-01Breastbreast invasive carcinomaFemale<65I/IIChemotherapycytoxanSD
ABCC1insertionFrame_Shift_Insnovelc.946_947insGTCATCATCACAGTCAATTTTATTTATTp.Val316GlyfsTer49p.V316Gfs*49P33527protein_codingTCGA-AO-A03T-01Breastbreast invasive carcinomaFemale<65I/IIChemotherapycyclophosphamideSD
ABCC1insertionFrame_Shift_Insnovelc.3318_3319insACCATGCCTGGTTCATCATTATTATTATTATTp.Val1107ThrfsTer45p.V1107Tfs*45P33527protein_codingTCGA-BH-A0AW-01Breastbreast invasive carcinomaFemale<65I/IIChemotherapycarboplatinSD
Page: 1 2 3 4 5 6 7 8 9 10 11 12 13 14 15 16 17 

Top

Related drugs of malignant transformation related genes

check buttonIdentification of chemicals and drugs interact with genes involved in malignant transfromation
(DGIdb 4.0)
Entrez IDSymbolCategoryInteraction TypesDrug Claim NameDrug NamePMIDs
4363ABCC1DRUGGABLE GENOME, TRANSPORTER, ABC TRANSPORTERNEVIRAPINENEVIRAPINE17172311
4363ABCC1DRUGGABLE GENOME, TRANSPORTER, ABC TRANSPORTERinhibitor384403652
4363ABCC1DRUGGABLE GENOME, TRANSPORTER, ABC TRANSPORTERTRAIL10811986
4363ABCC1DRUGGABLE GENOME, TRANSPORTER, ABC TRANSPORTER(S)-VERAPAMIL(S)-VERAPAMIL17646169
4363ABCC1DRUGGABLE GENOME, TRANSPORTER, ABC TRANSPORTERBenzbromaroneBENZBROMARONE
4363ABCC1DRUGGABLE GENOME, TRANSPORTER, ABC TRANSPORTERERYTHROMYCINERYTHROMYCIN10817732
4363ABCC1DRUGGABLE GENOME, TRANSPORTER, ABC TRANSPORTEREPIPODOPHYLLOTOXINS9719484
4363ABCC1DRUGGABLE GENOME, TRANSPORTER, ABC TRANSPORTERNOVOBIOCINNOVOBIOCIN10901300
4363ABCC1DRUGGABLE GENOME, TRANSPORTER, ABC TRANSPORTERTENOFOVIRTENOFOVIR17172311
4363ABCC1DRUGGABLE GENOME, TRANSPORTER, ABC TRANSPORTERCYCLOSPORINECYCLOSPORINE23017888
Page: 1 2 3 4 5 6 7