
|
|||||
|
 | |
| |
| |
| |
| |
| |
|
Gene: ABCB7 |
Gene summary for ABCB7 |
| Gene information | Species | Human | Gene symbol | ABCB7 | Gene ID | 22 |
| Gene name | ATP binding cassette subfamily B member 7 | |
| Gene Alias | ABC7 | |
| Cytomap | Xq13.3 | |
| Gene Type | protein-coding | GO ID | GO:0000041 | UniProtAcc | O75027 |
Top |
Malignant transformation analysis |
| Identification of the aberrant gene expression in precancerous and cancerous lesions by comparing the gene expression of stem-like cells in diseased tissues with normal stem cells |
| Entrez ID | Symbol | Replicates | Species | Organ | Tissue | Adj P-value | Log2FC | Malignancy |
| 22 | ABCB7 | LZE4T | Human | Esophagus | ESCC | 6.79e-11 | 2.21e-01 | 0.0811 |
| 22 | ABCB7 | LZE5T | Human | Esophagus | ESCC | 3.67e-05 | 3.20e-01 | 0.0514 |
| 22 | ABCB7 | LZE7T | Human | Esophagus | ESCC | 4.43e-06 | 2.32e-01 | 0.0667 |
| 22 | ABCB7 | LZE8T | Human | Esophagus | ESCC | 4.23e-04 | 9.83e-02 | 0.067 |
| 22 | ABCB7 | LZE20T | Human | Esophagus | ESCC | 7.00e-04 | 1.71e-01 | 0.0662 |
| 22 | ABCB7 | LZE24T | Human | Esophagus | ESCC | 1.48e-14 | 3.28e-01 | 0.0596 |
| 22 | ABCB7 | LZE21T | Human | Esophagus | ESCC | 1.87e-03 | 2.31e-01 | 0.0655 |
| 22 | ABCB7 | LZE6T | Human | Esophagus | ESCC | 7.52e-03 | 1.19e-01 | 0.0845 |
| 22 | ABCB7 | P2T-E | Human | Esophagus | ESCC | 3.52e-24 | 5.05e-01 | 0.1177 |
| 22 | ABCB7 | P4T-E | Human | Esophagus | ESCC | 1.41e-17 | 3.12e-01 | 0.1323 |
| 22 | ABCB7 | P5T-E | Human | Esophagus | ESCC | 4.96e-14 | 1.53e-01 | 0.1327 |
| 22 | ABCB7 | P8T-E | Human | Esophagus | ESCC | 1.46e-15 | 2.83e-01 | 0.0889 |
| 22 | ABCB7 | P9T-E | Human | Esophagus | ESCC | 1.97e-10 | 1.90e-01 | 0.1131 |
| 22 | ABCB7 | P10T-E | Human | Esophagus | ESCC | 2.65e-23 | 2.46e-01 | 0.116 |
| 22 | ABCB7 | P11T-E | Human | Esophagus | ESCC | 3.99e-09 | 2.94e-01 | 0.1426 |
| 22 | ABCB7 | P12T-E | Human | Esophagus | ESCC | 8.93e-30 | 5.55e-01 | 0.1122 |
| 22 | ABCB7 | P15T-E | Human | Esophagus | ESCC | 1.68e-14 | 3.22e-01 | 0.1149 |
| 22 | ABCB7 | P16T-E | Human | Esophagus | ESCC | 1.02e-18 | 1.84e-01 | 0.1153 |
| 22 | ABCB7 | P17T-E | Human | Esophagus | ESCC | 4.30e-04 | 2.00e-01 | 0.1278 |
| 22 | ABCB7 | P19T-E | Human | Esophagus | ESCC | 2.11e-03 | 2.45e-01 | 0.1662 |
| Page: 1 2 3 4 |
| Tissue | Expression Dynamics | Abbreviation |
| Esophagus | 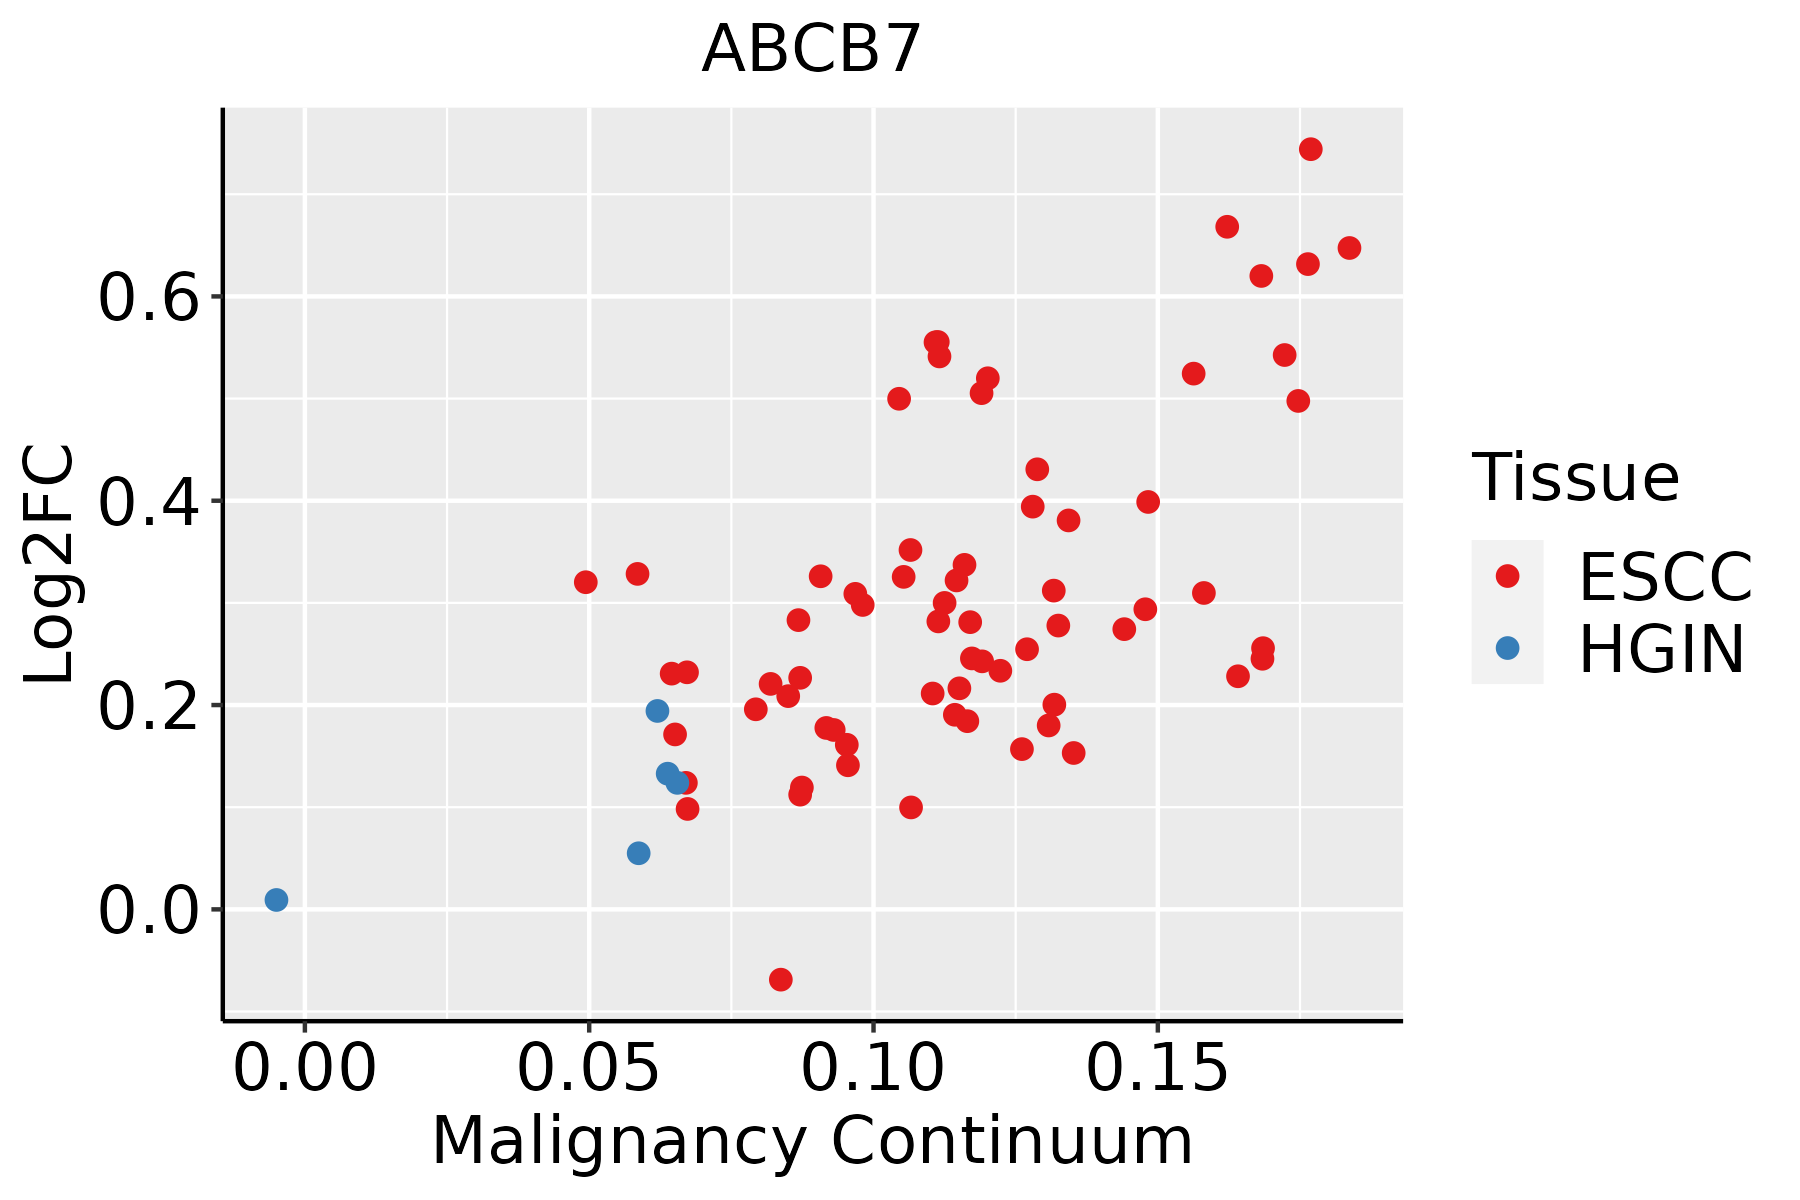 | ESCC: Esophageal squamous cell carcinoma |
| HGIN: High-grade intraepithelial neoplasias | ||
| LGIN: Low-grade intraepithelial neoplasias | ||
| Liver | 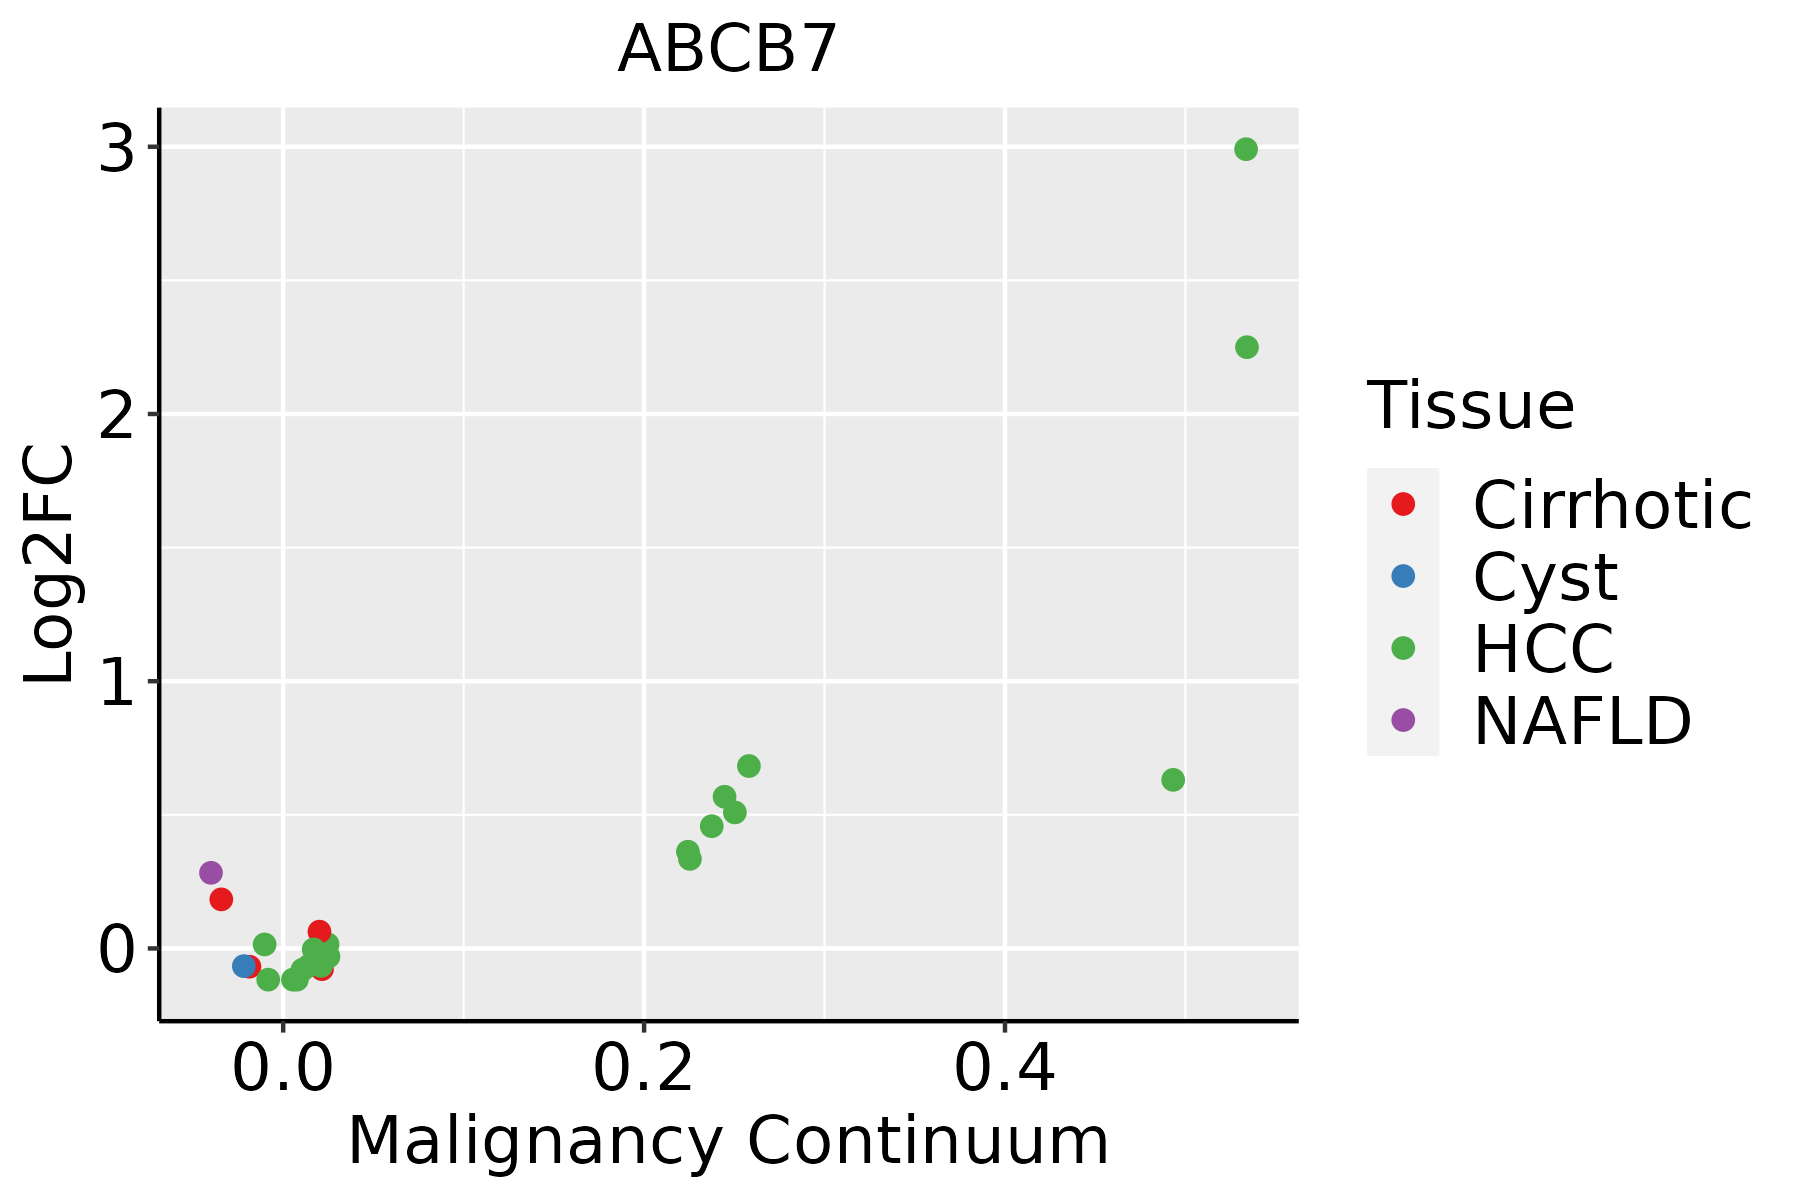 | HCC: Hepatocellular carcinoma |
| NAFLD: Non-alcoholic fatty liver disease | ||
| Oral Cavity |  | EOLP: Erosive Oral lichen planus |
| LP: leukoplakia | ||
| NEOLP: Non-erosive oral lichen planus | ||
| OSCC: Oral squamous cell carcinoma |
| ∗log2FC in expression of this searched gene in stem-like cells from each diseased tissue sample relative to stem-like cells in normal samples in each tissue plotted against the malignancy continuum. Samples are colored based on if they are from different disease stage. |
Top |
Malignant transformation related pathway analysis |
| Find out the enriched GO biological processes and KEGG pathways involved in transition from healthy to precancer to cancer |
| Tissue | Disease Stage | Enriched GO biological Processes |
| Colorectum | AD |  |
| Colorectum | SER |  |
| Colorectum | MSS |  |
| Colorectum | MSI-H |  |
| Colorectum | FAP |  |
| ∗Top 15 enriched GO BP terms are showed in the bar plot of each disease state in each tissue. Each row represents a significant GO biological process which is colored according to the -log10(p.adjust). |
| Page: 1 2 3 4 5 6 7 8 9 |
| GO ID | Tissue | Disease Stage | Description | Gene Ratio | Bg Ratio | pvalue | p.adjust | Count |
| GO:0006839110 | Esophagus | ESCC | mitochondrial transport | 187/8552 | 254/18723 | 8.35e-20 | 9.81e-18 | 187 |
| GO:00067906 | Esophagus | ESCC | sulfur compound metabolic process | 201/8552 | 339/18723 | 2.64e-07 | 3.94e-06 | 201 |
| GO:1990542110 | Esophagus | ESCC | mitochondrial transmembrane transport | 72/8552 | 102/18723 | 2.94e-07 | 4.23e-06 | 72 |
| GO:200037718 | Esophagus | ESCC | regulation of reactive oxygen species metabolic process | 100/8552 | 157/18723 | 3.87e-06 | 4.17e-05 | 100 |
| GO:005507617 | Esophagus | ESCC | transition metal ion homeostasis | 87/8552 | 138/18723 | 2.85e-05 | 2.37e-04 | 87 |
| GO:007259318 | Esophagus | ESCC | reactive oxygen species metabolic process | 137/8552 | 239/18723 | 1.82e-04 | 1.16e-03 | 137 |
| GO:001622611 | Esophagus | ESCC | iron-sulfur cluster assembly | 21/8552 | 26/18723 | 2.69e-04 | 1.63e-03 | 21 |
| GO:003116311 | Esophagus | ESCC | metallo-sulfur cluster assembly | 21/8552 | 26/18723 | 2.69e-04 | 1.63e-03 | 21 |
| GO:00469169 | Esophagus | ESCC | cellular transition metal ion homeostasis | 70/8552 | 115/18723 | 7.28e-04 | 3.79e-03 | 70 |
| GO:00067791 | Esophagus | ESCC | porphyrin-containing compound biosynthetic process | 23/8552 | 31/18723 | 1.20e-03 | 5.88e-03 | 23 |
| GO:00330141 | Esophagus | ESCC | tetrapyrrole biosynthetic process | 23/8552 | 31/18723 | 1.20e-03 | 5.88e-03 | 23 |
| GO:00461482 | Esophagus | ESCC | pigment biosynthetic process | 40/8552 | 62/18723 | 2.14e-03 | 9.54e-03 | 40 |
| GO:00067832 | Esophagus | ESCC | heme biosynthetic process | 20/8552 | 27/18723 | 2.61e-03 | 1.11e-02 | 20 |
| GO:00550729 | Esophagus | ESCC | iron ion homeostasis | 52/8552 | 85/18723 | 2.86e-03 | 1.21e-02 | 52 |
| GO:20003783 | Esophagus | ESCC | negative regulation of reactive oxygen species metabolic process | 34/8552 | 52/18723 | 3.26e-03 | 1.35e-02 | 34 |
| GO:00330132 | Esophagus | ESCC | tetrapyrrole metabolic process | 37/8552 | 59/18723 | 6.23e-03 | 2.29e-02 | 37 |
| GO:00424401 | Esophagus | ESCC | pigment metabolic process | 50/8552 | 84/18723 | 7.34e-03 | 2.64e-02 | 50 |
| GO:00421681 | Esophagus | ESCC | heme metabolic process | 27/8552 | 42/18723 | 1.16e-02 | 3.90e-02 | 27 |
| GO:00068397 | Liver | Cirrhotic | mitochondrial transport | 112/4634 | 254/18723 | 1.03e-11 | 6.66e-10 | 112 |
| GO:000679011 | Liver | Cirrhotic | sulfur compound metabolic process | 129/4634 | 339/18723 | 3.06e-08 | 1.04e-06 | 129 |
| Page: 1 2 3 4 |
| Pathway ID | Tissue | Disease Stage | Description | Gene Ratio | Bg Ratio | pvalue | p.adjust | qvalue | Count |
| hsa020102 | Liver | HCC | ABC transporters | 29/4020 | 45/8465 | 1.62e-02 | 3.88e-02 | 2.16e-02 | 29 |
| hsa020103 | Liver | HCC | ABC transporters | 29/4020 | 45/8465 | 1.62e-02 | 3.88e-02 | 2.16e-02 | 29 |
| Page: 1 |
Top |
Cell-cell communication analysis |
| Identification of potential cell-cell interactions between two cell types and their ligand-receptor pairs for different disease states |
| Ligand | Receptor | LRpair | Pathway | Tissue | Disease Stage |
| Page: 1 |
Top |
Single-cell gene regulatory network inference analysis |
| Find out the significant the regulons (TFs) and the target genes of each regulon across cell types for different disease states |
| TF | Cell Type | Tissue | Disease Stage | Target Gene | RSS | Regulon Activity |
| ∗The dot plots of a searched regulon are shown for all cell subpopulations in each disease state of each tissue based on the regulon specific score inferred using pySCENIC and by calculating the average expression. |
| Page: 1 |
Top |
Somatic mutation of malignant transformation related genes |
| Annotation of somatic variants for genes involved in malignant transformation |
| Hugo Symbol | Variant Class | Variant Classification | dbSNP RS | HGVSc | HGVSp | HGVSp Short | SWISSPROT | BIOTYPE | SIFT | PolyPhen | Tumor Sample Barcode | Tissue | Histology | Sex | Age | Stage | Therapy Types | Drugs | Outcome |
| ABCB7 | SNV | Missense_Mutation | c.392N>A | p.Pro131His | p.P131H | O75027 | protein_coding | deleterious(0) | probably_damaging(1) | TCGA-A2-A25A-01 | Breast | breast invasive carcinoma | Female | <65 | I/II | Unspecific | Cytoxan | SD | |
| ABCB7 | SNV | Missense_Mutation | c.1395N>T | p.Gln465His | p.Q465H | O75027 | protein_coding | tolerated(0.22) | benign(0.001) | TCGA-AR-A24H-01 | Breast | breast invasive carcinoma | Female | >=65 | I/II | Hormone Therapy | tamoxiphen | SD | |
| ABCB7 | SNV | Missense_Mutation | c.560N>T | p.Ala187Val | p.A187V | O75027 | protein_coding | tolerated(0.56) | benign(0.049) | TCGA-BH-A0DL-01 | Breast | breast invasive carcinoma | Female | <65 | I/II | Chemotherapy | cytoxan | CR | |
| ABCB7 | SNV | Missense_Mutation | c.487N>G | p.Lys163Glu | p.K163E | O75027 | protein_coding | deleterious(0) | probably_damaging(0.992) | TCGA-BH-A0HA-01 | Breast | breast invasive carcinoma | Female | <65 | I/II | Unknown | Unknown | SD | |
| ABCB7 | SNV | Missense_Mutation | c.2144N>G | p.Asn715Ser | p.N715S | O75027 | protein_coding | tolerated(0.35) | benign(0.003) | TCGA-BH-A204-01 | Breast | breast invasive carcinoma | Female | >=65 | I/II | Unknown | Unknown | SD | |
| ABCB7 | SNV | Missense_Mutation | novel | c.462G>A | p.Met154Ile | p.M154I | O75027 | protein_coding | tolerated(0.1) | benign(0.061) | TCGA-OL-A66J-01 | Breast | breast invasive carcinoma | Female | >=65 | I/II | Unknown | Unknown | SD |
| ABCB7 | insertion | Frame_Shift_Ins | novel | c.1758_1759insTTATATTTGA | p.Gly587LeufsTer7 | p.G587Lfs*7 | O75027 | protein_coding | TCGA-A2-A04Y-01 | Breast | breast invasive carcinoma | Female | <65 | I/II | Chemotherapy | cytoxan | SD | ||
| ABCB7 | insertion | Nonsense_Mutation | novel | c.1756_1757insATCATTAGAAGATGTTTTCAGTACTTGAGACCT | p.Ala586delinsAspHisTerLysMetPheSerValLeuGluThrSer | p.A586delinsDH*KMFSVLETS | O75027 | protein_coding | TCGA-A2-A04Y-01 | Breast | breast invasive carcinoma | Female | <65 | I/II | Chemotherapy | cytoxan | SD | ||
| ABCB7 | insertion | Nonsense_Mutation | novel | c.1381_1382insATTAGATAATCT | p.Ala461delinsAspTerIleIleSer | p.A461delinsD*IIS | O75027 | protein_coding | TCGA-A2-A0D1-01 | Breast | breast invasive carcinoma | Female | >=65 | I/II | Chemotherapy | taxotere | SD | ||
| ABCB7 | insertion | In_Frame_Ins | novel | c.1379_1380insCGTATCATTTAAATT | p.Met460delinsIleValSerPheLysLeu | p.M460delinsIVSFKL | O75027 | protein_coding | TCGA-A2-A0D1-01 | Breast | breast invasive carcinoma | Female | >=65 | I/II | Chemotherapy | taxotere | SD |
| Page: 1 2 3 4 5 6 7 8 9 10 11 12 |
Top |
Related drugs of malignant transformation related genes |
| Identification of chemicals and drugs interact with genes involved in malignant transfromation |
| (DGIdb 4.0) |
| Entrez ID | Symbol | Category | Interaction Types | Drug Claim Name | Drug Name | PMIDs |
| Page: 1 |

Copyright 2023-Present -The University of Texas Health Science Center at Houston |