
|
|||||
|
 | |
| |
| |
| |
| |
| |
|
Gene: ABCB6 |
Gene summary for ABCB6 |
| Gene information | Species | Human | Gene symbol | ABCB6 | Gene ID | 10058 |
| Gene name | ATP binding cassette subfamily B member 6 (Langereis blood group) | |
| Gene Alias | ABC | |
| Cytomap | 2q35 | |
| Gene Type | protein-coding | GO ID | GO:0000041 | UniProtAcc | Q9NP58 |
Top |
Malignant transformation analysis |
| Identification of the aberrant gene expression in precancerous and cancerous lesions by comparing the gene expression of stem-like cells in diseased tissues with normal stem cells |
| Entrez ID | Symbol | Replicates | Species | Organ | Tissue | Adj P-value | Log2FC | Malignancy |
| 10058 | ABCB6 | LZE2T | Human | Esophagus | ESCC | 9.54e-06 | 6.52e-01 | 0.082 |
| 10058 | ABCB6 | LZE4T | Human | Esophagus | ESCC | 1.25e-18 | 5.07e-01 | 0.0811 |
| 10058 | ABCB6 | LZE7T | Human | Esophagus | ESCC | 2.07e-09 | 3.18e-01 | 0.0667 |
| 10058 | ABCB6 | LZE8T | Human | Esophagus | ESCC | 9.77e-06 | 2.01e-01 | 0.067 |
| 10058 | ABCB6 | LZE24T | Human | Esophagus | ESCC | 1.68e-09 | 2.46e-01 | 0.0596 |
| 10058 | ABCB6 | LZE6T | Human | Esophagus | ESCC | 3.01e-06 | 2.96e-01 | 0.0845 |
| 10058 | ABCB6 | P9T-E | Human | Esophagus | ESCC | 2.30e-02 | 1.08e-01 | 0.1131 |
| 10058 | ABCB6 | P15T-E | Human | Esophagus | ESCC | 1.32e-06 | 1.58e-01 | 0.1149 |
| 10058 | ABCB6 | P28T-E | Human | Esophagus | ESCC | 8.84e-05 | 1.08e-01 | 0.1149 |
| 10058 | ABCB6 | P30T-E | Human | Esophagus | ESCC | 9.20e-05 | 1.75e-01 | 0.137 |
| 10058 | ABCB6 | P32T-E | Human | Esophagus | ESCC | 1.66e-02 | 7.91e-02 | 0.1666 |
| 10058 | ABCB6 | P37T-E | Human | Esophagus | ESCC | 4.28e-02 | 9.24e-02 | 0.1371 |
| 10058 | ABCB6 | P49T-E | Human | Esophagus | ESCC | 7.48e-03 | 2.82e-01 | 0.1768 |
| 10058 | ABCB6 | P52T-E | Human | Esophagus | ESCC | 8.84e-05 | 1.25e-01 | 0.1555 |
| 10058 | ABCB6 | P56T-E | Human | Esophagus | ESCC | 1.75e-02 | 2.90e-01 | 0.1613 |
| 10058 | ABCB6 | P130T-E | Human | Esophagus | ESCC | 9.20e-06 | 1.39e-01 | 0.1676 |
| 10058 | ABCB6 | HCC1 | Human | Liver | HCC | 5.09e-08 | 3.53e+00 | 0.5336 |
| 10058 | ABCB6 | HCC2 | Human | Liver | HCC | 8.83e-42 | 4.30e+00 | 0.5341 |
| 10058 | ABCB6 | HCC5 | Human | Liver | HCC | 2.57e-02 | 1.82e+00 | 0.4932 |
| 10058 | ABCB6 | S014 | Human | Liver | HCC | 1.64e-05 | 1.55e-01 | 0.2254 |
| Page: 1 2 |
| Tissue | Expression Dynamics | Abbreviation |
| Esophagus | 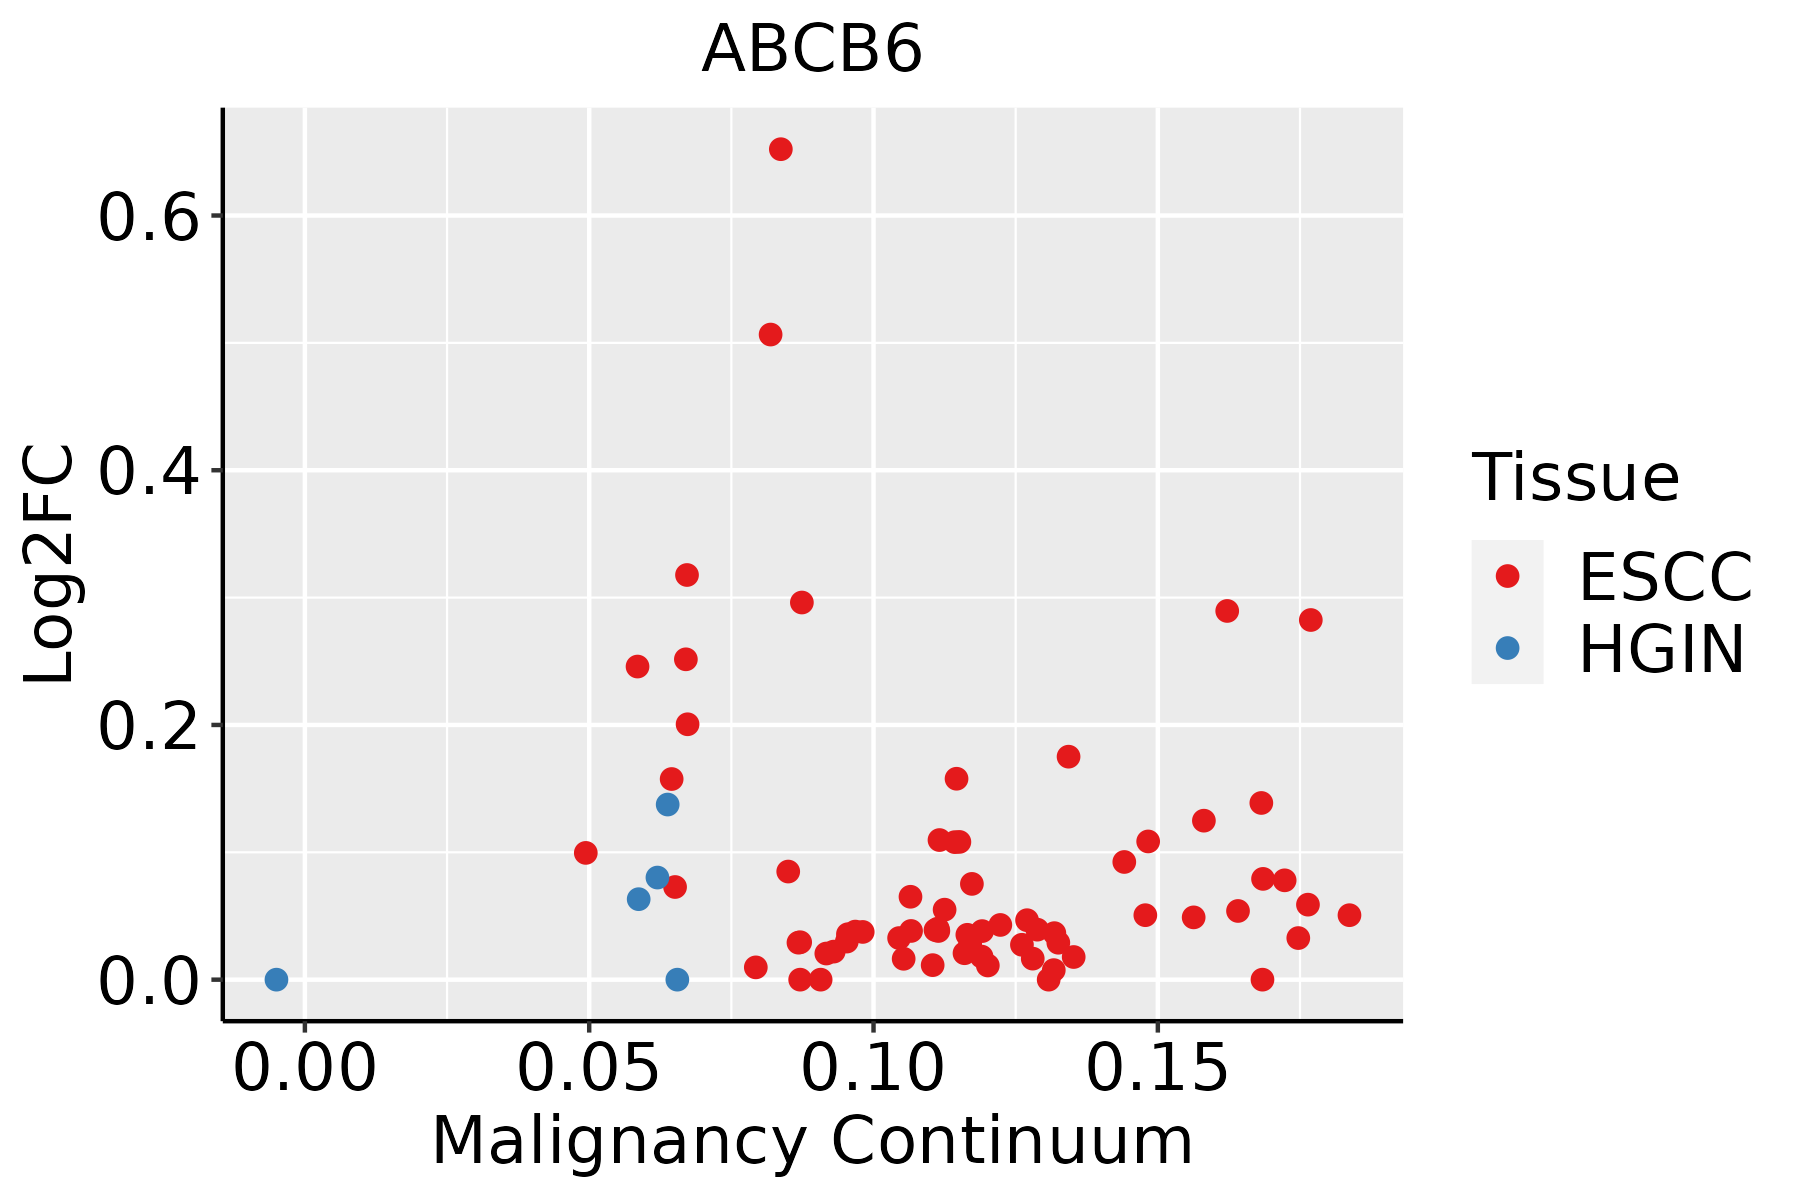 | ESCC: Esophageal squamous cell carcinoma |
| HGIN: High-grade intraepithelial neoplasias | ||
| LGIN: Low-grade intraepithelial neoplasias | ||
| Liver | 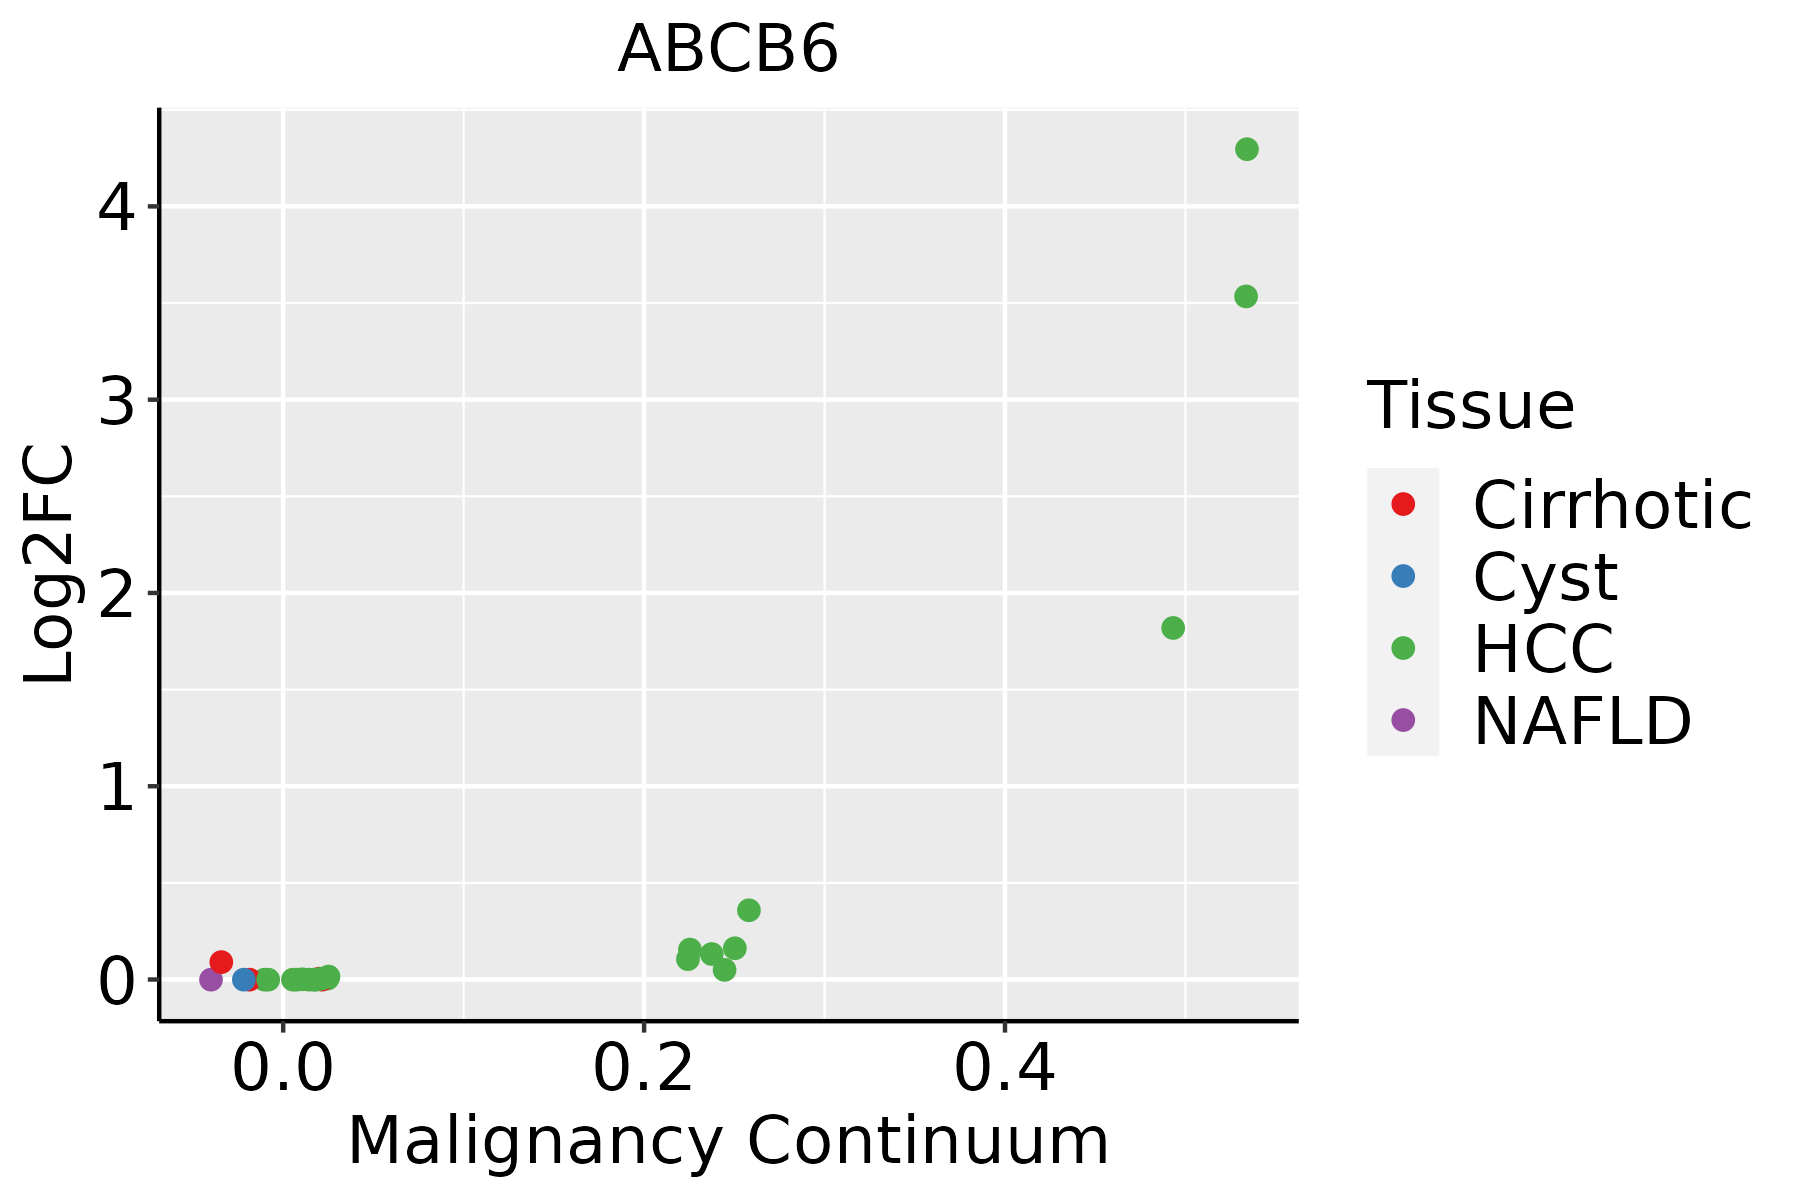 | HCC: Hepatocellular carcinoma |
| NAFLD: Non-alcoholic fatty liver disease |
| ∗log2FC in expression of this searched gene in stem-like cells from each diseased tissue sample relative to stem-like cells in normal samples in each tissue plotted against the malignancy continuum. Samples are colored based on if they are from different disease stage. |
Top |
Malignant transformation related pathway analysis |
| Find out the enriched GO biological processes and KEGG pathways involved in transition from healthy to precancer to cancer |
| Tissue | Disease Stage | Enriched GO biological Processes |
| Colorectum | AD |  |
| Colorectum | SER |  |
| Colorectum | MSS |  |
| Colorectum | MSI-H |  |
| Colorectum | FAP |  |
| ∗Top 15 enriched GO BP terms are showed in the bar plot of each disease state in each tissue. Each row represents a significant GO biological process which is colored according to the -log10(p.adjust). |
| Page: 1 2 3 4 5 6 7 8 9 |
| GO ID | Tissue | Disease Stage | Description | Gene Ratio | Bg Ratio | pvalue | p.adjust | Count |
| GO:001605014 | Esophagus | ESCC | vesicle organization | 211/8552 | 300/18723 | 2.85e-18 | 2.87e-16 | 211 |
| GO:00435888 | Esophagus | ESCC | skin development | 163/8552 | 263/18723 | 6.48e-08 | 1.14e-06 | 163 |
| GO:00330593 | Esophagus | ESCC | cellular pigmentation | 40/8552 | 53/18723 | 9.67e-06 | 9.21e-05 | 40 |
| GO:005507617 | Esophagus | ESCC | transition metal ion homeostasis | 87/8552 | 138/18723 | 2.85e-05 | 2.37e-04 | 87 |
| GO:001003827 | Esophagus | ESCC | response to metal ion | 208/8552 | 373/18723 | 5.02e-05 | 3.90e-04 | 208 |
| GO:004668619 | Esophagus | ESCC | response to cadmium ion | 47/8552 | 68/18723 | 7.81e-05 | 5.80e-04 | 47 |
| GO:000963620 | Esophagus | ESCC | response to toxic substance | 150/8552 | 262/18723 | 1.00e-04 | 7.12e-04 | 150 |
| GO:00487531 | Esophagus | ESCC | pigment granule organization | 23/8552 | 29/18723 | 2.25e-04 | 1.40e-03 | 23 |
| GO:00324381 | Esophagus | ESCC | melanosome organization | 22/8552 | 28/18723 | 3.95e-04 | 2.26e-03 | 22 |
| GO:00469169 | Esophagus | ESCC | cellular transition metal ion homeostasis | 70/8552 | 115/18723 | 7.28e-04 | 3.79e-03 | 70 |
| GO:1990748110 | Esophagus | ESCC | cellular detoxification | 70/8552 | 116/18723 | 1.02e-03 | 5.17e-03 | 70 |
| GO:00550703 | Esophagus | ESCC | copper ion homeostasis | 15/8552 | 18/18723 | 1.20e-03 | 5.88e-03 | 15 |
| GO:00067791 | Esophagus | ESCC | porphyrin-containing compound biosynthetic process | 23/8552 | 31/18723 | 1.20e-03 | 5.88e-03 | 23 |
| GO:00330141 | Esophagus | ESCC | tetrapyrrole biosynthetic process | 23/8552 | 31/18723 | 1.20e-03 | 5.88e-03 | 23 |
| GO:007124117 | Esophagus | ESCC | cellular response to inorganic substance | 125/8552 | 226/18723 | 2.17e-03 | 9.67e-03 | 125 |
| GO:00434731 | Esophagus | ESCC | pigmentation | 59/8552 | 98/18723 | 2.64e-03 | 1.12e-02 | 59 |
| GO:00550729 | Esophagus | ESCC | iron ion homeostasis | 52/8552 | 85/18723 | 2.86e-03 | 1.21e-02 | 52 |
| GO:0097237110 | Esophagus | ESCC | cellular response to toxic substance | 72/8552 | 124/18723 | 3.65e-03 | 1.49e-02 | 72 |
| GO:007127615 | Esophagus | ESCC | cellular response to cadmium ion | 27/8552 | 40/18723 | 4.39e-03 | 1.73e-02 | 27 |
| GO:00330132 | Esophagus | ESCC | tetrapyrrole metabolic process | 37/8552 | 59/18723 | 6.23e-03 | 2.29e-02 | 37 |
| Page: 1 2 3 |
| Pathway ID | Tissue | Disease Stage | Description | Gene Ratio | Bg Ratio | pvalue | p.adjust | qvalue | Count |
| hsa020102 | Liver | HCC | ABC transporters | 29/4020 | 45/8465 | 1.62e-02 | 3.88e-02 | 2.16e-02 | 29 |
| hsa020103 | Liver | HCC | ABC transporters | 29/4020 | 45/8465 | 1.62e-02 | 3.88e-02 | 2.16e-02 | 29 |
| Page: 1 |
Top |
Cell-cell communication analysis |
| Identification of potential cell-cell interactions between two cell types and their ligand-receptor pairs for different disease states |
| Ligand | Receptor | LRpair | Pathway | Tissue | Disease Stage |
| Page: 1 |
Top |
Single-cell gene regulatory network inference analysis |
| Find out the significant the regulons (TFs) and the target genes of each regulon across cell types for different disease states |
| TF | Cell Type | Tissue | Disease Stage | Target Gene | RSS | Regulon Activity |
| ∗The dot plots of a searched regulon are shown for all cell subpopulations in each disease state of each tissue based on the regulon specific score inferred using pySCENIC and by calculating the average expression. |
| Page: 1 |
Top |
Somatic mutation of malignant transformation related genes |
| Annotation of somatic variants for genes involved in malignant transformation |
| Hugo Symbol | Variant Class | Variant Classification | dbSNP RS | HGVSc | HGVSp | HGVSp Short | SWISSPROT | BIOTYPE | SIFT | PolyPhen | Tumor Sample Barcode | Tissue | Histology | Sex | Age | Stage | Therapy Types | Drugs | Outcome |
| ABCB6 | SNV | Missense_Mutation | novel | c.1367C>T | p.Ser456Phe | p.S456F | Q9NP58 | protein_coding | deleterious(0) | probably_damaging(0.997) | TCGA-5L-AAT1-01 | Breast | breast invasive carcinoma | Female | <65 | III/IV | Hormone Therapy | letrozol | SD |
| ABCB6 | SNV | Missense_Mutation | novel | c.2074N>T | p.Gly692Trp | p.G692W | Q9NP58 | protein_coding | deleterious(0.01) | benign(0.04) | TCGA-A7-A6VX-01 | Breast | breast invasive carcinoma | Female | >=65 | I/II | Chemotherapy | docetaxel | CR |
| ABCB6 | SNV | Missense_Mutation | c.1538N>G | p.Ser513Cys | p.S513C | Q9NP58 | protein_coding | tolerated(0.11) | possibly_damaging(0.617) | TCGA-AC-A23H-01 | Breast | breast invasive carcinoma | Female | >=65 | I/II | Unknown | Unknown | PD | |
| ABCB6 | SNV | Missense_Mutation | rs772815355 | c.1414N>A | p.Glu472Lys | p.E472K | Q9NP58 | protein_coding | deleterious(0) | probably_damaging(1) | TCGA-AN-A046-01 | Breast | breast invasive carcinoma | Female | >=65 | I/II | Unknown | Unknown | SD |
| ABCB6 | SNV | Missense_Mutation | c.2089N>A | p.Glu697Lys | p.E697K | Q9NP58 | protein_coding | tolerated(0.28) | benign(0.019) | TCGA-C8-A26Y-01 | Breast | breast invasive carcinoma | Female | >=65 | I/II | Unknown | Unknown | SD | |
| ABCB6 | SNV | Missense_Mutation | c.670N>T | p.Asp224Tyr | p.D224Y | Q9NP58 | protein_coding | deleterious(0) | benign(0.219) | TCGA-D8-A1J9-01 | Breast | breast invasive carcinoma | Female | <65 | I/II | Unknown | Unknown | SD | |
| ABCB6 | insertion | Nonsense_Mutation | novel | c.1713_1714insTGGGCCTGAGATTTTTCCCATTTC | p.Glu571_Thr572insTrpAlaTerAspPheSerHisPhe | p.E571_T572insWA*DFSHF | Q9NP58 | protein_coding | TCGA-A2-A0EO-01 | Breast | breast invasive carcinoma | Female | <65 | I/II | Hormone Therapy | tamoxiphen | SD | ||
| ABCB6 | insertion | Frame_Shift_Ins | novel | c.567_568insAGACGGAGTCTTGCTCTGTCACCAGGCTGGAGTGCAGTGGC | p.Val190ArgfsTer74 | p.V190Rfs*74 | Q9NP58 | protein_coding | TCGA-A2-A0EY-01 | Breast | breast invasive carcinoma | Female | <65 | I/II | Chemotherapy | adriamycin | SD | ||
| ABCB6 | insertion | Frame_Shift_Ins | novel | c.598_599insCATCATTCCT | p.Phe200SerfsTer24 | p.F200Sfs*24 | Q9NP58 | protein_coding | TCGA-BH-A0DS-01 | Breast | breast invasive carcinoma | Female | >=65 | III/IV | Chemotherapy | cyclophosphamide | SD | ||
| ABCB6 | SNV | Missense_Mutation | rs190137939 | c.1783G>A | p.Val595Met | p.V595M | Q9NP58 | protein_coding | deleterious(0.01) | probably_damaging(0.945) | TCGA-2W-A8YY-01 | Cervix | cervical & endocervical cancer | Female | <65 | I/II | Chemotherapy | cisplatin | CR |
| Page: 1 2 3 4 5 6 7 8 9 |
Top |
Related drugs of malignant transformation related genes |
| Identification of chemicals and drugs interact with genes involved in malignant transfromation |
| (DGIdb 4.0) |
| Entrez ID | Symbol | Category | Interaction Types | Drug Claim Name | Drug Name | PMIDs |
| Page: 1 |

Copyright 2023-Present -The University of Texas Health Science Center at Houston |