
|
|||||
|
 | |
| |
| |
| |
| |
| |
|
Gene: ABCB1 |
Gene summary for ABCB1 |
| Gene information | Species | Human | Gene symbol | ABCB1 | Gene ID | 5243 |
| Gene name | ATP binding cassette subfamily B member 1 | |
| Gene Alias | ABC20 | |
| Cytomap | 7q21.12 | |
| Gene Type | protein-coding | GO ID | GO:0000086 | UniProtAcc | A4D1D2 |
Top |
Malignant transformation analysis |
| Identification of the aberrant gene expression in precancerous and cancerous lesions by comparing the gene expression of stem-like cells in diseased tissues with normal stem cells |
| Entrez ID | Symbol | Replicates | Species | Organ | Tissue | Adj P-value | Log2FC | Malignancy |
| 5243 | ABCB1 | HTA11_1938_2000001011 | Human | Colorectum | AD | 1.22e-06 | 3.93e-01 | -0.0811 |
| 5243 | ABCB1 | HTA11_866_3004761011 | Human | Colorectum | AD | 6.56e-07 | 3.47e-01 | 0.096 |
| 5243 | ABCB1 | HTA11_6818_2000001021 | Human | Colorectum | AD | 2.65e-03 | 2.07e-01 | 0.0588 |
| 5243 | ABCB1 | HTA11_99999970781_79442 | Human | Colorectum | MSS | 3.41e-20 | 5.60e-01 | 0.294 |
| 5243 | ABCB1 | HTA11_99999965104_69814 | Human | Colorectum | MSS | 1.29e-08 | 4.16e-01 | 0.281 |
| 5243 | ABCB1 | HTA11_99999971662_82457 | Human | Colorectum | MSS | 3.71e-10 | 4.40e-01 | 0.3859 |
| 5243 | ABCB1 | HTA11_99999974143_84620 | Human | Colorectum | MSS | 1.09e-13 | 4.15e-01 | 0.3005 |
| 5243 | ABCB1 | A002-C-010 | Human | Colorectum | FAP | 3.36e-10 | 4.38e-01 | 0.242 |
| 5243 | ABCB1 | A001-C-207 | Human | Colorectum | FAP | 7.74e-04 | 4.24e-01 | 0.1278 |
| 5243 | ABCB1 | A002-C-203 | Human | Colorectum | FAP | 1.25e-20 | 6.98e-01 | 0.2786 |
| 5243 | ABCB1 | A002-C-021 | Human | Colorectum | FAP | 1.28e-04 | 3.07e-01 | 0.1171 |
| 5243 | ABCB1 | A001-C-104 | Human | Colorectum | FAP | 4.40e-05 | 3.92e-01 | 0.0184 |
| 5243 | ABCB1 | A015-C-106 | Human | Colorectum | FAP | 1.32e-03 | 3.45e-01 | -0.0511 |
| 5243 | ABCB1 | A008-E-015 | Human | Colorectum | FAP | 1.46e-11 | 4.38e-01 | 0.0177 |
| 5243 | ABCB1 | NAFLD1 | Human | Liver | NAFLD | 1.45e-02 | 3.79e-01 | -0.04 |
| 5243 | ABCB1 | S43 | Human | Liver | Cirrhotic | 1.23e-08 | 3.55e-02 | -0.0187 |
| 5243 | ABCB1 | HCC1_Meng | Human | Liver | HCC | 4.02e-74 | 7.60e-03 | 0.0246 |
| 5243 | ABCB1 | HCC2_Meng | Human | Liver | HCC | 1.21e-08 | -3.04e-01 | 0.0107 |
| 5243 | ABCB1 | cirrhotic1 | Human | Liver | Cirrhotic | 5.03e-09 | 7.35e-02 | 0.0202 |
| 5243 | ABCB1 | cirrhotic2 | Human | Liver | Cirrhotic | 1.46e-08 | 1.18e-01 | 0.0201 |
| Page: 1 2 |
| Tissue | Expression Dynamics | Abbreviation |
| Colorectum (GSE201348) |  | FAP: Familial adenomatous polyposis |
| CRC: Colorectal cancer | ||
| Colorectum (HTA11) |  | AD: Adenomas |
| SER: Sessile serrated lesions | ||
| MSI-H: Microsatellite-high colorectal cancer | ||
| MSS: Microsatellite stable colorectal cancer | ||
| Liver | 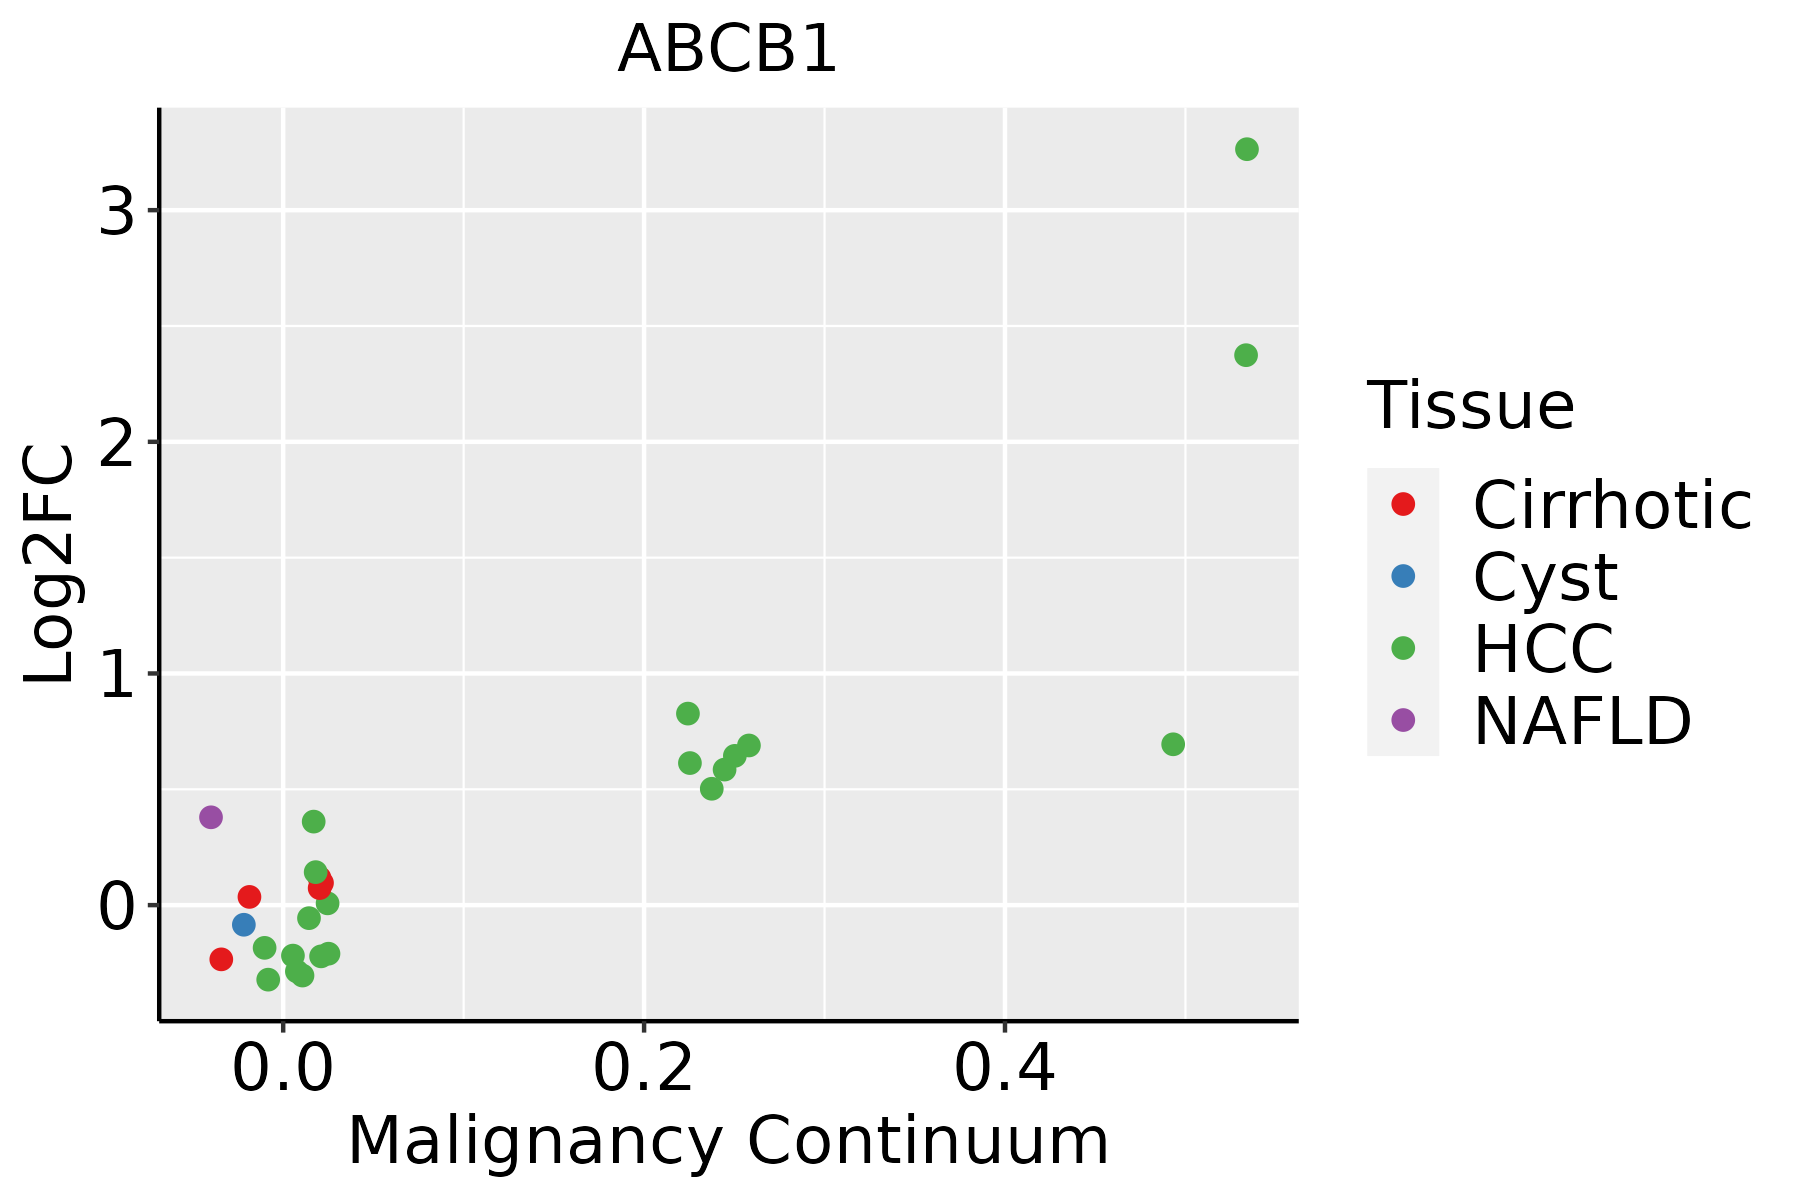 | HCC: Hepatocellular carcinoma |
| NAFLD: Non-alcoholic fatty liver disease |
| ∗log2FC in expression of this searched gene in stem-like cells from each diseased tissue sample relative to stem-like cells in normal samples in each tissue plotted against the malignancy continuum. Samples are colored based on if they are from different disease stage. |
Top |
Malignant transformation related pathway analysis |
| Find out the enriched GO biological processes and KEGG pathways involved in transition from healthy to precancer to cancer |
| Tissue | Disease Stage | Enriched GO biological Processes |
| Colorectum | AD |  |
| Colorectum | SER |  |
| Colorectum | MSS |  |
| Colorectum | MSI-H |  |
| Colorectum | FAP |  |
| ∗Top 15 enriched GO BP terms are showed in the bar plot of each disease state in each tissue. Each row represents a significant GO biological process which is colored according to the -log10(p.adjust). |
| Page: 1 2 3 4 5 6 7 8 9 |
| GO ID | Tissue | Disease Stage | Description | Gene Ratio | Bg Ratio | pvalue | p.adjust | Count |
| GO:0009636 | Colorectum | AD | response to toxic substance | 88/3918 | 262/18723 | 1.12e-06 | 3.72e-05 | 88 |
| GO:0098754 | Colorectum | AD | detoxification | 53/3918 | 152/18723 | 4.63e-05 | 7.98e-04 | 53 |
| GO:0009410 | Colorectum | AD | response to xenobiotic stimulus | 128/3918 | 462/18723 | 2.69e-04 | 3.31e-03 | 128 |
| GO:0010876 | Colorectum | AD | lipid localization | 120/3918 | 448/18723 | 1.59e-03 | 1.33e-02 | 120 |
| GO:0006869 | Colorectum | AD | lipid transport | 108/3918 | 398/18723 | 1.67e-03 | 1.39e-02 | 108 |
| GO:0042886 | Colorectum | AD | amide transport | 83/3918 | 301/18723 | 3.37e-03 | 2.46e-02 | 83 |
| GO:0032411 | Colorectum | AD | positive regulation of transporter activity | 37/3918 | 120/18723 | 6.82e-03 | 4.22e-02 | 37 |
| GO:0015698 | Colorectum | AD | inorganic anion transport | 52/3918 | 180/18723 | 6.83e-03 | 4.22e-02 | 52 |
| GO:0015748 | Colorectum | AD | organophosphate ester transport | 42/3918 | 140/18723 | 7.04e-03 | 4.31e-02 | 42 |
| GO:00096362 | Colorectum | MSS | response to toxic substance | 73/3467 | 262/18723 | 1.26e-04 | 1.94e-03 | 73 |
| GO:0150104 | Colorectum | MSS | transport across blood-brain barrier | 28/3467 | 87/18723 | 1.54e-03 | 1.41e-02 | 28 |
| GO:0010232 | Colorectum | MSS | vascular transport | 28/3467 | 88/18723 | 1.87e-03 | 1.64e-02 | 28 |
| GO:00324091 | Colorectum | MSS | regulation of transporter activity | 78/3467 | 310/18723 | 2.09e-03 | 1.78e-02 | 78 |
| GO:0070633 | Colorectum | MSS | transepithelial transport | 13/3467 | 31/18723 | 2.14e-03 | 1.80e-02 | 13 |
| GO:00428861 | Colorectum | MSS | amide transport | 76/3467 | 301/18723 | 2.14e-03 | 1.80e-02 | 76 |
| GO:0034764 | Colorectum | MSS | positive regulation of transmembrane transport | 58/3467 | 219/18723 | 2.19e-03 | 1.83e-02 | 58 |
| GO:00094101 | Colorectum | MSS | response to xenobiotic stimulus | 110/3467 | 462/18723 | 2.36e-03 | 1.92e-02 | 110 |
| GO:00324112 | Colorectum | MSS | positive regulation of transporter activity | 35/3467 | 120/18723 | 2.95e-03 | 2.28e-02 | 35 |
| GO:0022898 | Colorectum | MSS | regulation of transmembrane transporter activity | 70/3467 | 278/18723 | 3.36e-03 | 2.54e-02 | 70 |
| GO:00987542 | Colorectum | MSS | detoxification | 41/3467 | 152/18723 | 6.41e-03 | 4.27e-02 | 41 |
| Page: 1 2 3 4 5 6 7 8 9 |
| Pathway ID | Tissue | Disease Stage | Description | Gene Ratio | Bg Ratio | pvalue | p.adjust | qvalue | Count |
| hsa04976 | Colorectum | FAP | Bile secretion | 24/1404 | 89/8465 | 8.76e-03 | 3.21e-02 | 1.96e-02 | 24 |
| hsa049761 | Colorectum | FAP | Bile secretion | 24/1404 | 89/8465 | 8.76e-03 | 3.21e-02 | 1.96e-02 | 24 |
| hsa02010 | Liver | NAFLD | ABC transporters | 16/1043 | 45/8465 | 4.97e-05 | 1.16e-03 | 9.37e-04 | 16 |
| hsa020101 | Liver | NAFLD | ABC transporters | 16/1043 | 45/8465 | 4.97e-05 | 1.16e-03 | 9.37e-04 | 16 |
| hsa020102 | Liver | HCC | ABC transporters | 29/4020 | 45/8465 | 1.62e-02 | 3.88e-02 | 2.16e-02 | 29 |
| hsa020103 | Liver | HCC | ABC transporters | 29/4020 | 45/8465 | 1.62e-02 | 3.88e-02 | 2.16e-02 | 29 |
| Page: 1 |
Top |
Cell-cell communication analysis |
| Identification of potential cell-cell interactions between two cell types and their ligand-receptor pairs for different disease states |
| Ligand | Receptor | LRpair | Pathway | Tissue | Disease Stage |
| Page: 1 |
Top |
Single-cell gene regulatory network inference analysis |
| Find out the significant the regulons (TFs) and the target genes of each regulon across cell types for different disease states |
| TF | Cell Type | Tissue | Disease Stage | Target Gene | RSS | Regulon Activity |
| ∗The dot plots of a searched regulon are shown for all cell subpopulations in each disease state of each tissue based on the regulon specific score inferred using pySCENIC and by calculating the average expression. |
| Page: 1 |
Top |
Somatic mutation of malignant transformation related genes |
| Annotation of somatic variants for genes involved in malignant transformation |
| Hugo Symbol | Variant Class | Variant Classification | dbSNP RS | HGVSc | HGVSp | HGVSp Short | SWISSPROT | BIOTYPE | SIFT | PolyPhen | Tumor Sample Barcode | Tissue | Histology | Sex | Age | Stage | Therapy Types | Drugs | Outcome |
| ABCB1 | SNV | Missense_Mutation | c.2966N>A | p.Gly989Glu | p.G989E | P08183 | protein_coding | deleterious(0) | probably_damaging(0.999) | TCGA-A2-A04U-01 | Breast | breast invasive carcinoma | Female | <65 | I/II | Chemotherapy | adriamycin | SD | |
| ABCB1 | SNV | Missense_Mutation | rs776877163 | c.3194C>T | p.Thr1065Met | p.T1065M | P08183 | protein_coding | deleterious(0) | probably_damaging(1) | TCGA-A8-A09Z-01 | Breast | breast invasive carcinoma | Female | >=65 | I/II | Unknown | Unknown | SD |
| ABCB1 | SNV | Missense_Mutation | rs36105130 | c.2547N>G | p.Ile849Met | p.I849M | P08183 | protein_coding | deleterious(0.04) | possibly_damaging(0.626) | TCGA-AC-A6IW-01 | Breast | breast invasive carcinoma | Female | >=65 | I/II | Unknown | Unknown | SD |
| ABCB1 | SNV | Missense_Mutation | rs201352027 | c.1211N>A | p.Arg404Gln | p.R404Q | P08183 | protein_coding | deleterious(0) | probably_damaging(0.998) | TCGA-AQ-A54N-01 | Breast | breast invasive carcinoma | Female | <65 | I/II | Unknown | Unknown | SD |
| ABCB1 | SNV | Missense_Mutation | c.2320N>A | p.Gly774Ser | p.G774S | P08183 | protein_coding | tolerated(0.08) | probably_damaging(0.927) | TCGA-AR-A24H-01 | Breast | breast invasive carcinoma | Female | >=65 | I/II | Hormone Therapy | tamoxiphen | SD | |
| ABCB1 | SNV | Missense_Mutation | c.1561N>C | p.Asp521His | p.D521H | P08183 | protein_coding | deleterious(0.01) | probably_damaging(0.99) | TCGA-B6-A0IJ-01 | Breast | breast invasive carcinoma | Female | <65 | I/II | Unknown | Unknown | SD | |
| ABCB1 | SNV | Missense_Mutation | c.2816N>C | p.Gly939Ala | p.G939A | P08183 | protein_coding | deleterious(0.03) | probably_damaging(0.981) | TCGA-BH-A1F0-01 | Breast | breast invasive carcinoma | Female | >=65 | I/II | Unknown | Unknown | PD | |
| ABCB1 | SNV | Missense_Mutation | rs139611979 | c.1342N>A | p.Glu448Lys | p.E448K | P08183 | protein_coding | tolerated(0.12) | possibly_damaging(0.61) | TCGA-D8-A1JA-01 | Breast | breast invasive carcinoma | Female | <65 | III/IV | Chemotherapy | adriamycin | PD |
| ABCB1 | SNV | Missense_Mutation | novel | c.170N>G | p.Ala57Gly | p.A57G | P08183 | protein_coding | tolerated(0.24) | benign(0.269) | TCGA-EW-A1PC-01 | Breast | breast invasive carcinoma | Female | >=65 | I/II | Hormone Therapy | tamoxiphen | SD |
| ABCB1 | deletion | Frame_Shift_Del | novel | c.568delN | p.Ile190LeufsTer16 | p.I190Lfs*16 | P08183 | protein_coding | TCGA-D8-A27V-01 | Breast | breast invasive carcinoma | Female | <65 | I/II | Hormone Therapy | tamoxiphen | SD |
| Page: 1 2 3 4 5 6 7 8 9 10 11 12 13 14 15 16 17 18 19 20 21 22 23 24 25 26 27 |
Top |
Related drugs of malignant transformation related genes |
| Identification of chemicals and drugs interact with genes involved in malignant transfromation |
| (DGIdb 4.0) |
| Entrez ID | Symbol | Category | Interaction Types | Drug Claim Name | Drug Name | PMIDs |
| 5243 | ABCB1 | CLINICALLY ACTIONABLE, TRANSPORTER, DRUGGABLE GENOME, ENZYME, CELL SURFACE, DRUG RESISTANCE, ABC TRANSPORTER | antiepileptics | 15452306,17125969,16386926,17306068,21747585,19450124,22630058,22188362,20417680,17521963,16004559,16542858,16753003,24300029,12686700,15857428,25458099,21391884,18812236 | ||
| 5243 | ABCB1 | CLINICALLY ACTIONABLE, TRANSPORTER, DRUGGABLE GENOME, ENZYME, CELL SURFACE, DRUG RESISTANCE, ABC TRANSPORTER | CAROTENOIDS | 16454745 | ||
| 5243 | ABCB1 | CLINICALLY ACTIONABLE, TRANSPORTER, DRUGGABLE GENOME, ENZYME, CELL SURFACE, DRUG RESISTANCE, ABC TRANSPORTER | agomelatine | AGOMELATINE | ||
| 5243 | ABCB1 | CLINICALLY ACTIONABLE, TRANSPORTER, DRUGGABLE GENOME, ENZYME, CELL SURFACE, DRUG RESISTANCE, ABC TRANSPORTER | daptomycin | DAPTOMYCIN | 25239468 | |
| 5243 | ABCB1 | CLINICALLY ACTIONABLE, TRANSPORTER, DRUGGABLE GENOME, ENZYME, CELL SURFACE, DRUG RESISTANCE, ABC TRANSPORTER | nicardipine | NICARDIPINE | ||
| 5243 | ABCB1 | CLINICALLY ACTIONABLE, TRANSPORTER, DRUGGABLE GENOME, ENZYME, CELL SURFACE, DRUG RESISTANCE, ABC TRANSPORTER | VINBLASTINE | VINBLASTINE | 21348461,20363635 | |
| 5243 | ABCB1 | CLINICALLY ACTIONABLE, TRANSPORTER, DRUGGABLE GENOME, ENZYME, CELL SURFACE, DRUG RESISTANCE, ABC TRANSPORTER | DEXTROMETHORPHAN | DEXTROMETHORPHAN | 15582917 | |
| 5243 | ABCB1 | CLINICALLY ACTIONABLE, TRANSPORTER, DRUGGABLE GENOME, ENZYME, CELL SURFACE, DRUG RESISTANCE, ABC TRANSPORTER | ranolazine | RANOLAZINE | 24433361 | |
| 5243 | ABCB1 | CLINICALLY ACTIONABLE, TRANSPORTER, DRUGGABLE GENOME, ENZYME, CELL SURFACE, DRUG RESISTANCE, ABC TRANSPORTER | spironolactone | SPIRONOLACTONE | ||
| 5243 | ABCB1 | CLINICALLY ACTIONABLE, TRANSPORTER, DRUGGABLE GENOME, ENZYME, CELL SURFACE, DRUG RESISTANCE, ABC TRANSPORTER | propranolol | PROPRANOLOL |
| Page: 1 2 3 4 5 6 7 8 9 10 11 12 13 14 15 16 17 18 19 20 21 22 23 24 25 26 27 28 29 30 31 32 33 34 35 |

Copyright 2023-Present -The University of Texas Health Science Center at Houston |