
|
|||||
|
 | |
| |
| |
| |
| |
| |
|
Gene: ABCA8 |
Gene summary for ABCA8 |
| Gene information | Species | Human | Gene symbol | ABCA8 | Gene ID | 10351 |
| Gene name | ATP binding cassette subfamily A member 8 | |
| Gene Alias | ABCA8 | |
| Cytomap | 17q24.2 | |
| Gene Type | protein-coding | GO ID | GO:0006629 | UniProtAcc | O94911 |
Top |
Malignant transformation analysis |
| Identification of the aberrant gene expression in precancerous and cancerous lesions by comparing the gene expression of stem-like cells in diseased tissues with normal stem cells |
| Entrez ID | Symbol | Replicates | Species | Organ | Tissue | Adj P-value | Log2FC | Malignancy |
| 10351 | ABCA8 | NAFLD1 | Human | Liver | NAFLD | 6.36e-13 | 1.07e+00 | -0.04 |
| 10351 | ABCA8 | S41 | Human | Liver | Cirrhotic | 3.90e-05 | 7.30e-01 | -0.0343 |
| 10351 | ABCA8 | S43 | Human | Liver | Cirrhotic | 9.25e-03 | -1.50e-01 | -0.0187 |
| 10351 | ABCA8 | HCC1_Meng | Human | Liver | HCC | 2.32e-08 | -2.07e-01 | 0.0246 |
| 10351 | ABCA8 | HCC2_Meng | Human | Liver | HCC | 3.40e-07 | -2.07e-01 | 0.0107 |
| 10351 | ABCA8 | Pt13.a | Human | Liver | HCC | 4.16e-03 | -1.80e-01 | 0.021 |
| 10351 | ABCA8 | NEOLP-1 | Human | Oral cavity | NEOLP | 1.96e-05 | 2.63e-01 | -0.0194 |
| 10351 | ABCA8 | male-WTA | Human | Thyroid | PTC | 4.95e-23 | 2.36e-01 | 0.1037 |
| 10351 | ABCA8 | PTC01 | Human | Thyroid | PTC | 1.08e-07 | 2.27e-01 | 0.1899 |
| 10351 | ABCA8 | PTC06 | Human | Thyroid | PTC | 9.51e-09 | 2.50e-01 | 0.2057 |
| 10351 | ABCA8 | PTC07 | Human | Thyroid | PTC | 3.80e-06 | 1.93e-01 | 0.2044 |
| 10351 | ABCA8 | ATC12 | Human | Thyroid | ATC | 6.64e-11 | 1.94e-01 | 0.34 |
| 10351 | ABCA8 | ATC13 | Human | Thyroid | ATC | 3.61e-31 | 6.48e-01 | 0.34 |
| 10351 | ABCA8 | ATC4 | Human | Thyroid | ATC | 4.82e-12 | 2.42e-01 | 0.34 |
| 10351 | ABCA8 | ATC5 | Human | Thyroid | ATC | 5.08e-37 | 6.87e-01 | 0.34 |
| Page: 1 |
| Tissue | Expression Dynamics | Abbreviation |
| Liver | 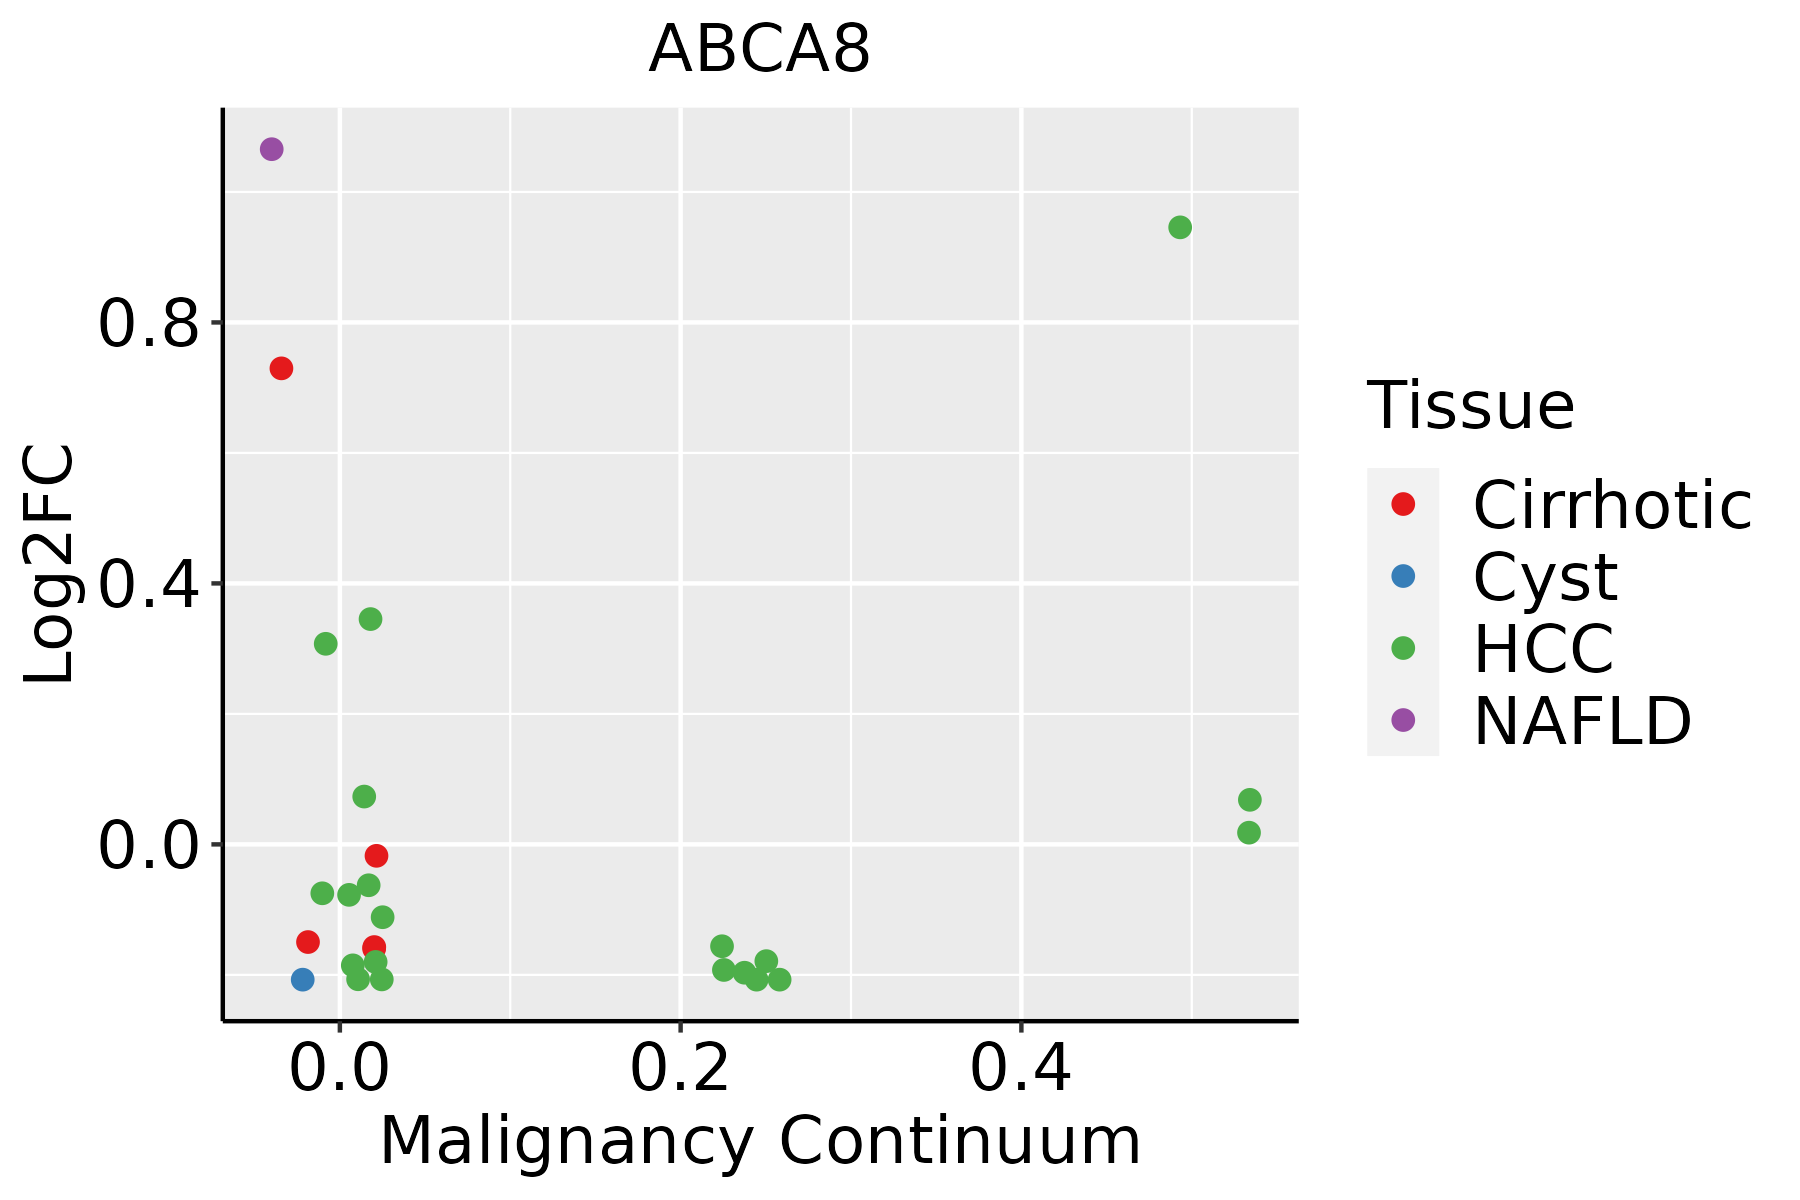 | HCC: Hepatocellular carcinoma |
| NAFLD: Non-alcoholic fatty liver disease | ||
| Oral Cavity | 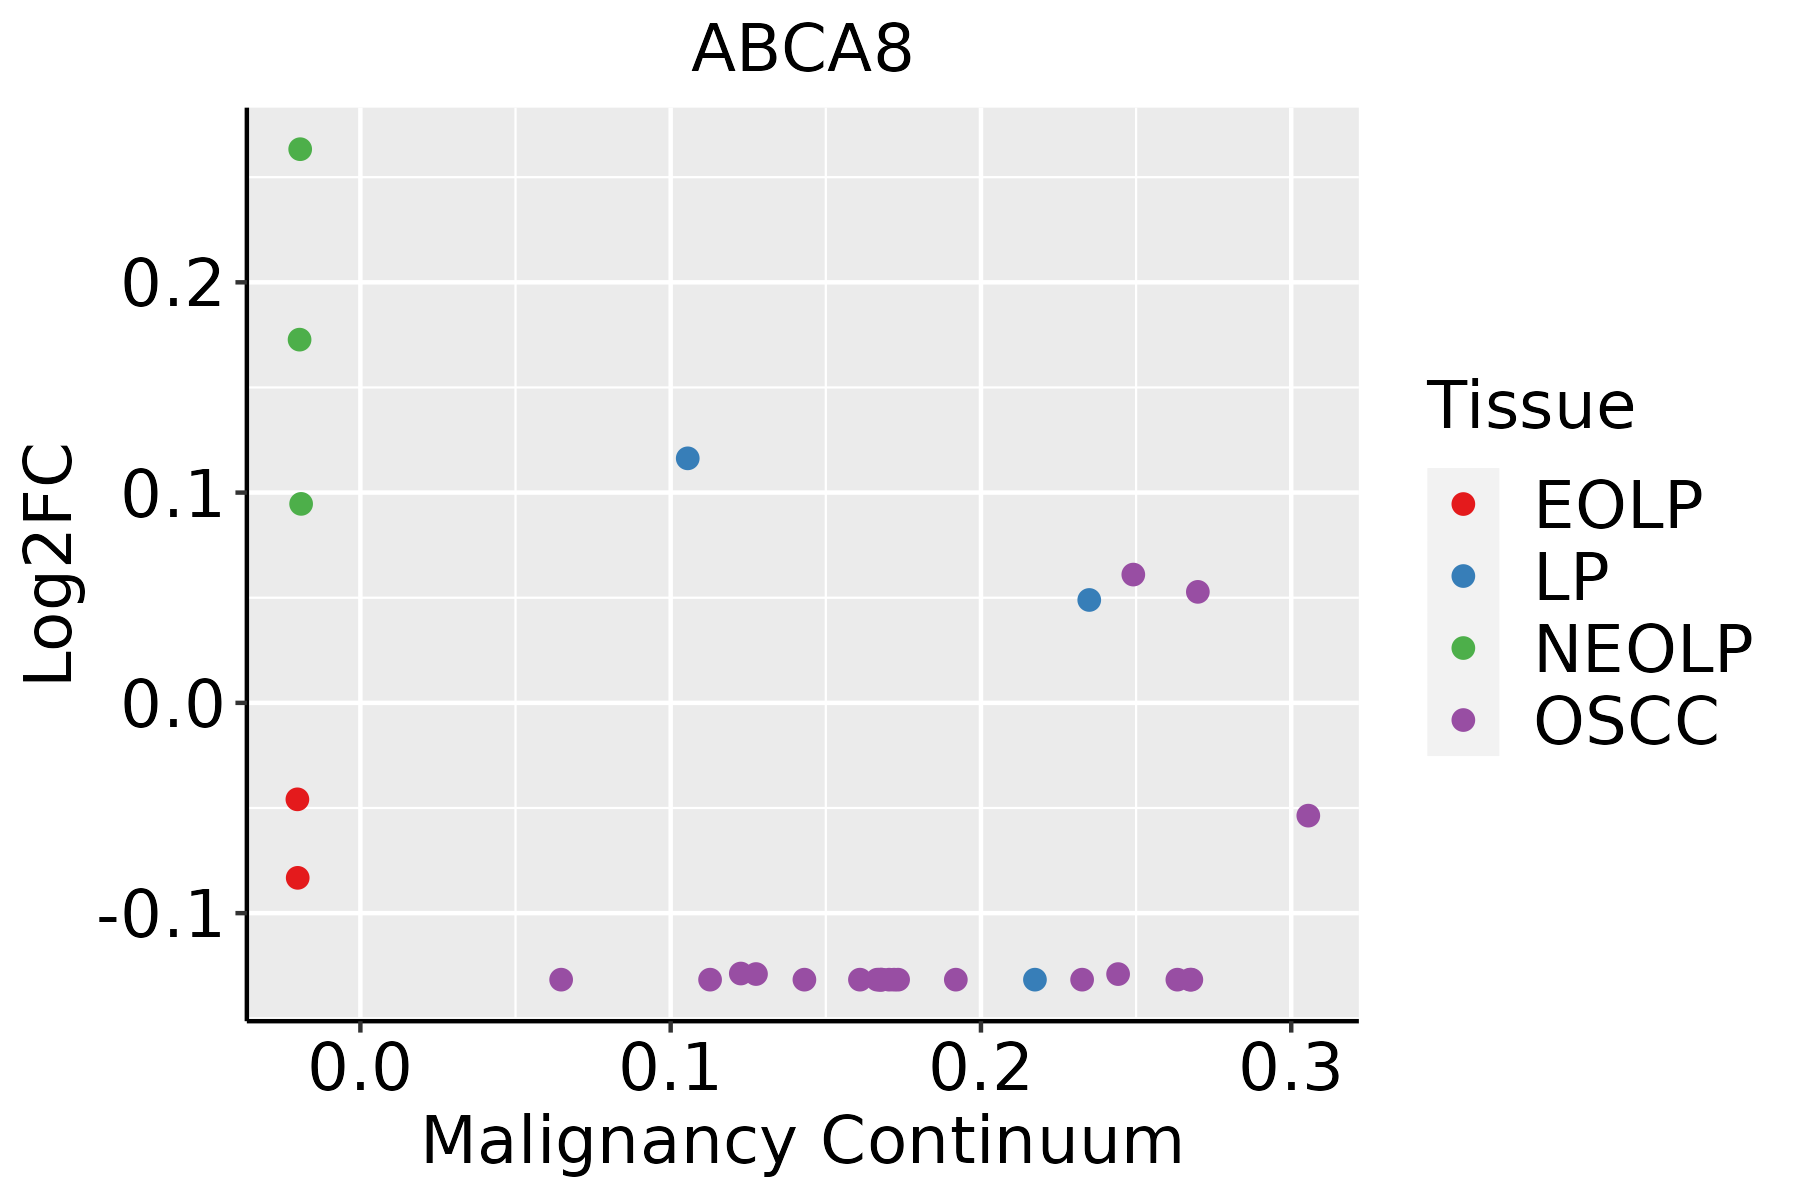 | EOLP: Erosive Oral lichen planus |
| LP: leukoplakia | ||
| NEOLP: Non-erosive oral lichen planus | ||
| OSCC: Oral squamous cell carcinoma | ||
| Thyroid | 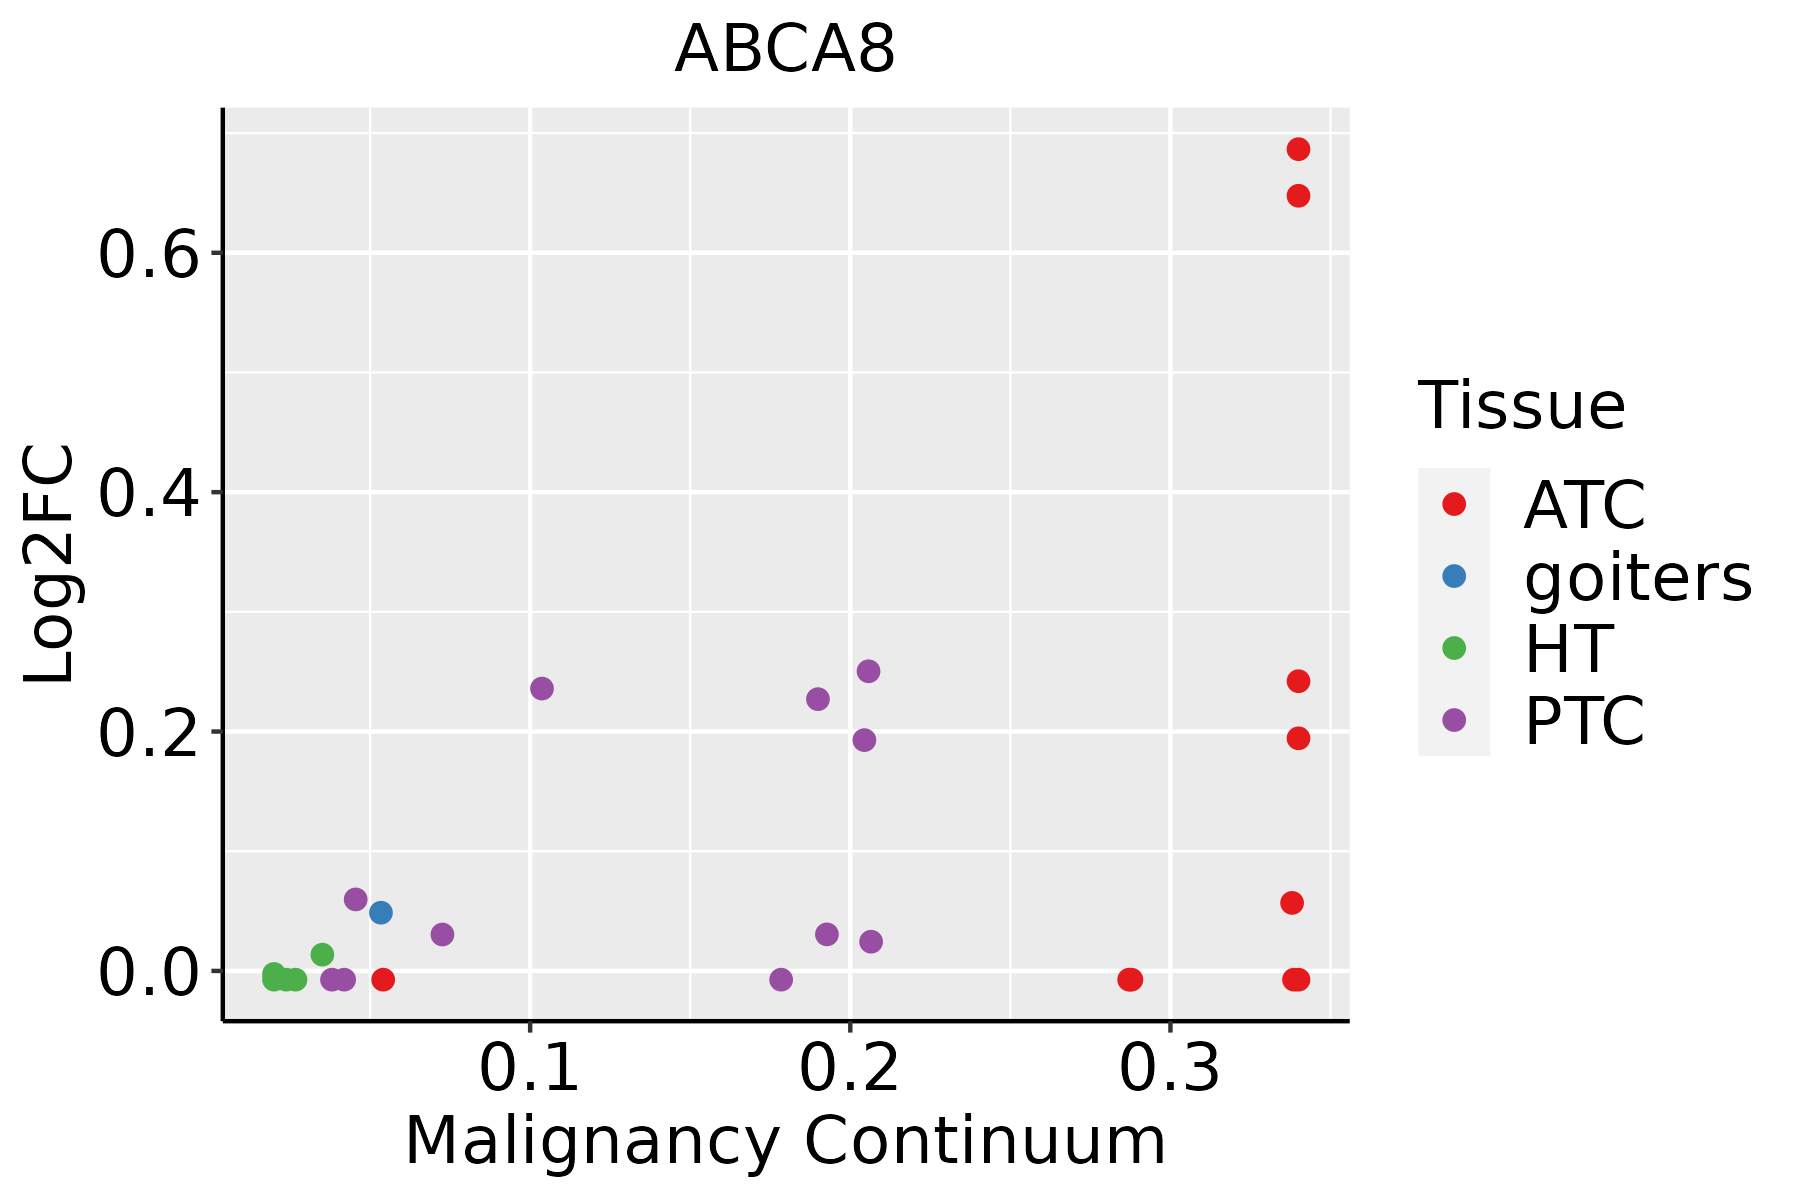 | ATC: Anaplastic thyroid cancer |
| HT: Hashimoto's thyroiditis | ||
| PTC: Papillary thyroid cancer |
| ∗log2FC in expression of this searched gene in stem-like cells from each diseased tissue sample relative to stem-like cells in normal samples in each tissue plotted against the malignancy continuum. Samples are colored based on if they are from different disease stage. |
Top |
Malignant transformation related pathway analysis |
| Find out the enriched GO biological processes and KEGG pathways involved in transition from healthy to precancer to cancer |
| Tissue | Disease Stage | Enriched GO biological Processes |
| Colorectum | AD |  |
| Colorectum | SER |  |
| Colorectum | MSS |  |
| Colorectum | MSI-H |  |
| Colorectum | FAP |  |
| ∗Top 15 enriched GO BP terms are showed in the bar plot of each disease state in each tissue. Each row represents a significant GO biological process which is colored according to the -log10(p.adjust). |
| Page: 1 2 3 4 5 6 7 8 9 |
| GO ID | Tissue | Disease Stage | Description | Gene Ratio | Bg Ratio | pvalue | p.adjust | Count |
| GO:00108765 | Liver | NAFLD | lipid localization | 79/1882 | 448/18723 | 4.75e-07 | 2.92e-05 | 79 |
| GO:00303013 | Liver | NAFLD | cholesterol transport | 30/1882 | 117/18723 | 1.08e-06 | 5.40e-05 | 30 |
| GO:00068694 | Liver | NAFLD | lipid transport | 71/1882 | 398/18723 | 1.16e-06 | 5.59e-05 | 71 |
| GO:00159183 | Liver | NAFLD | sterol transport | 32/1882 | 130/18723 | 1.27e-06 | 6.01e-05 | 32 |
| GO:0032373 | Liver | NAFLD | positive regulation of sterol transport | 15/1882 | 38/18723 | 1.68e-06 | 7.43e-05 | 15 |
| GO:0032376 | Liver | NAFLD | positive regulation of cholesterol transport | 15/1882 | 38/18723 | 1.68e-06 | 7.43e-05 | 15 |
| GO:0033344 | Liver | NAFLD | cholesterol efflux | 20/1882 | 69/18723 | 9.13e-06 | 2.98e-04 | 20 |
| GO:0015850 | Liver | NAFLD | organic hydroxy compound transport | 50/1882 | 284/18723 | 6.01e-05 | 1.32e-03 | 50 |
| GO:0032371 | Liver | NAFLD | regulation of sterol transport | 20/1882 | 78/18723 | 6.46e-05 | 1.39e-03 | 20 |
| GO:0032374 | Liver | NAFLD | regulation of cholesterol transport | 20/1882 | 78/18723 | 6.46e-05 | 1.39e-03 | 20 |
| GO:0010875 | Liver | NAFLD | positive regulation of cholesterol efflux | 10/1882 | 26/18723 | 1.20e-04 | 2.32e-03 | 10 |
| GO:1905952 | Liver | NAFLD | regulation of lipid localization | 34/1882 | 181/18723 | 2.51e-04 | 4.12e-03 | 34 |
| GO:1905954 | Liver | NAFLD | positive regulation of lipid localization | 23/1882 | 110/18723 | 5.16e-04 | 7.15e-03 | 23 |
| GO:0032368 | Liver | NAFLD | regulation of lipid transport | 28/1882 | 149/18723 | 8.39e-04 | 1.03e-02 | 28 |
| GO:0032370 | Liver | NAFLD | positive regulation of lipid transport | 18/1882 | 84/18723 | 1.49e-03 | 1.64e-02 | 18 |
| GO:001087611 | Liver | Cirrhotic | lipid localization | 147/4634 | 448/18723 | 6.24e-05 | 7.12e-04 | 147 |
| GO:00108751 | Liver | Cirrhotic | positive regulation of cholesterol efflux | 15/4634 | 26/18723 | 3.43e-04 | 2.93e-03 | 15 |
| GO:000686911 | Liver | Cirrhotic | lipid transport | 128/4634 | 398/18723 | 4.54e-04 | 3.69e-03 | 128 |
| GO:00323731 | Liver | Cirrhotic | positive regulation of sterol transport | 19/4634 | 38/18723 | 6.75e-04 | 5.06e-03 | 19 |
| GO:00323761 | Liver | Cirrhotic | positive regulation of cholesterol transport | 19/4634 | 38/18723 | 6.75e-04 | 5.06e-03 | 19 |
| Page: 1 2 3 |
| Pathway ID | Tissue | Disease Stage | Description | Gene Ratio | Bg Ratio | pvalue | p.adjust | qvalue | Count |
| hsa02010 | Liver | NAFLD | ABC transporters | 16/1043 | 45/8465 | 4.97e-05 | 1.16e-03 | 9.37e-04 | 16 |
| hsa020101 | Liver | NAFLD | ABC transporters | 16/1043 | 45/8465 | 4.97e-05 | 1.16e-03 | 9.37e-04 | 16 |
| hsa020102 | Liver | HCC | ABC transporters | 29/4020 | 45/8465 | 1.62e-02 | 3.88e-02 | 2.16e-02 | 29 |
| hsa020103 | Liver | HCC | ABC transporters | 29/4020 | 45/8465 | 1.62e-02 | 3.88e-02 | 2.16e-02 | 29 |
| Page: 1 |
Top |
Cell-cell communication analysis |
| Identification of potential cell-cell interactions between two cell types and their ligand-receptor pairs for different disease states |
| Ligand | Receptor | LRpair | Pathway | Tissue | Disease Stage |
| Page: 1 |
Top |
Single-cell gene regulatory network inference analysis |
| Find out the significant the regulons (TFs) and the target genes of each regulon across cell types for different disease states |
| TF | Cell Type | Tissue | Disease Stage | Target Gene | RSS | Regulon Activity |
| ∗The dot plots of a searched regulon are shown for all cell subpopulations in each disease state of each tissue based on the regulon specific score inferred using pySCENIC and by calculating the average expression. |
| Page: 1 |
Top |
Somatic mutation of malignant transformation related genes |
| Annotation of somatic variants for genes involved in malignant transformation |
| Hugo Symbol | Variant Class | Variant Classification | dbSNP RS | HGVSc | HGVSp | HGVSp Short | SWISSPROT | BIOTYPE | SIFT | PolyPhen | Tumor Sample Barcode | Tissue | Histology | Sex | Age | Stage | Therapy Types | Drugs | Outcome |
| ABCA8 | SNV | Missense_Mutation | c.3678N>C | p.Lys1226Asn | p.K1226N | O94911 | protein_coding | tolerated(0.06) | benign(0.209) | TCGA-3C-AALI-01 | Breast | breast invasive carcinoma | Female | <65 | I/II | Unspecific | Poly E | Complete Response | |
| ABCA8 | SNV | Missense_Mutation | rs368828473 | c.4351N>A | p.Glu1451Lys | p.E1451K | O94911 | protein_coding | tolerated(0.48) | benign(0.009) | TCGA-5L-AAT1-01 | Breast | breast invasive carcinoma | Female | <65 | III/IV | Hormone Therapy | letrozol | SD |
| ABCA8 | SNV | Missense_Mutation | novel | c.1497N>C | p.Leu499Phe | p.L499F | O94911 | protein_coding | deleterious(0) | probably_damaging(0.988) | TCGA-5L-AAT1-01 | Breast | breast invasive carcinoma | Female | <65 | III/IV | Hormone Therapy | letrozol | SD |
| ABCA8 | SNV | Missense_Mutation | c.2371N>C | p.Glu791Gln | p.E791Q | O94911 | protein_coding | deleterious(0.03) | probably_damaging(0.996) | TCGA-A1-A0SI-01 | Breast | breast invasive carcinoma | Female | <65 | I/II | Unknown | Unknown | SD | |
| ABCA8 | SNV | Missense_Mutation | c.3835N>A | p.Val1279Ile | p.V1279I | O94911 | protein_coding | tolerated(0.07) | possibly_damaging(0.477) | TCGA-A2-A0YM-01 | Breast | breast invasive carcinoma | Female | >=65 | I/II | Unknown | Unknown | SD | |
| ABCA8 | SNV | Missense_Mutation | c.4460N>A | p.Arg1487Gln | p.R1487Q | O94911 | protein_coding | deleterious(0.01) | probably_damaging(0.977) | TCGA-A7-A26E-01 | Breast | breast invasive carcinoma | Female | >=65 | III/IV | Chemotherapy | cytoxan | SD | |
| ABCA8 | SNV | Missense_Mutation | c.4481N>A | p.Gly1494Glu | p.G1494E | O94911 | protein_coding | deleterious(0) | probably_damaging(0.992) | TCGA-A8-A08L-01 | Breast | breast invasive carcinoma | Female | >=65 | III/IV | Unknown | Unknown | SD | |
| ABCA8 | SNV | Missense_Mutation | c.4810N>C | p.Glu1604Gln | p.E1604Q | O94911 | protein_coding | deleterious(0.02) | possibly_damaging(0.481) | TCGA-AC-A23H-01 | Breast | breast invasive carcinoma | Female | >=65 | I/II | Unknown | Unknown | PD | |
| ABCA8 | SNV | Missense_Mutation | novel | c.431G>A | p.Gly144Glu | p.G144E | O94911 | protein_coding | tolerated(0.27) | benign(0.062) | TCGA-AC-A8OP-01 | Breast | breast invasive carcinoma | Female | >=65 | I/II | Unknown | Unknown | SD |
| ABCA8 | SNV | Missense_Mutation | novel | c.3897N>C | p.Lys1299Asn | p.K1299N | O94911 | protein_coding | deleterious(0) | benign(0.379) | TCGA-AN-A0XW-01 | Breast | breast invasive carcinoma | Female | <65 | III/IV | Unknown | Unknown | SD |
| Page: 1 2 3 4 5 6 7 8 9 10 11 12 13 14 15 16 17 18 19 20 21 |
Top |
Related drugs of malignant transformation related genes |
| Identification of chemicals and drugs interact with genes involved in malignant transfromation |
| (DGIdb 4.0) |
| Entrez ID | Symbol | Category | Interaction Types | Drug Claim Name | Drug Name | PMIDs |
| Page: 1 |

Copyright 2023-Present -The University of Texas Health Science Center at Houston |