
|
|||||
|
 | |
| |
| |
| |
| |
| |
|
Gene: ABCA5 |
Gene summary for ABCA5 |
| Gene information | Species | Human | Gene symbol | ABCA5 | Gene ID | 23461 |
| Gene name | ATP binding cassette subfamily A member 5 | |
| Gene Alias | ABC13 | |
| Cytomap | 17q24.3 | |
| Gene Type | protein-coding | GO ID | GO:0006066 | UniProtAcc | Q8WWZ7 |
Top |
Malignant transformation analysis |
| Identification of the aberrant gene expression in precancerous and cancerous lesions by comparing the gene expression of stem-like cells in diseased tissues with normal stem cells |
| Entrez ID | Symbol | Replicates | Species | Organ | Tissue | Adj P-value | Log2FC | Malignancy |
| 23461 | ABCA5 | HTA11_3410_2000001011 | Human | Colorectum | AD | 6.01e-16 | -5.70e-01 | 0.0155 |
| 23461 | ABCA5 | HTA11_7862_2000001011 | Human | Colorectum | AD | 1.74e-03 | -5.82e-01 | -0.0179 |
| 23461 | ABCA5 | HTA11_866_3004761011 | Human | Colorectum | AD | 3.03e-09 | -5.15e-01 | 0.096 |
| 23461 | ABCA5 | HTA11_10711_2000001011 | Human | Colorectum | AD | 1.64e-04 | -5.09e-01 | 0.0338 |
| 23461 | ABCA5 | HTA11_7696_3000711011 | Human | Colorectum | AD | 3.97e-15 | -5.27e-01 | 0.0674 |
| 23461 | ABCA5 | HTA11_99999970781_79442 | Human | Colorectum | MSS | 1.05e-06 | -4.08e-01 | 0.294 |
| 23461 | ABCA5 | HTA11_99999971662_82457 | Human | Colorectum | MSS | 7.86e-10 | -4.54e-01 | 0.3859 |
| 23461 | ABCA5 | HTA11_99999973899_84307 | Human | Colorectum | MSS | 2.34e-03 | -5.39e-01 | 0.2585 |
| 23461 | ABCA5 | HTA11_99999974143_84620 | Human | Colorectum | MSS | 3.49e-17 | -5.28e-01 | 0.3005 |
| 23461 | ABCA5 | A002-C-010 | Human | Colorectum | FAP | 2.46e-05 | -2.88e-01 | 0.242 |
| 23461 | ABCA5 | A015-C-203 | Human | Colorectum | FAP | 1.24e-18 | -1.75e-01 | -0.1294 |
| 23461 | ABCA5 | A002-C-201 | Human | Colorectum | FAP | 6.06e-09 | -1.89e-01 | 0.0324 |
| 23461 | ABCA5 | A001-C-119 | Human | Colorectum | FAP | 5.10e-05 | -3.36e-01 | -0.1557 |
| 23461 | ABCA5 | A001-C-108 | Human | Colorectum | FAP | 5.64e-10 | -2.24e-01 | -0.0272 |
| 23461 | ABCA5 | A002-C-205 | Human | Colorectum | FAP | 3.50e-15 | -3.96e-01 | -0.1236 |
| 23461 | ABCA5 | A015-C-006 | Human | Colorectum | FAP | 5.01e-12 | -5.27e-01 | -0.0994 |
| 23461 | ABCA5 | A015-C-106 | Human | Colorectum | FAP | 1.39e-07 | -1.77e-01 | -0.0511 |
| 23461 | ABCA5 | A002-C-114 | Human | Colorectum | FAP | 5.26e-10 | -2.32e-01 | -0.1561 |
| 23461 | ABCA5 | A015-C-104 | Human | Colorectum | FAP | 1.73e-16 | -2.27e-01 | -0.1899 |
| 23461 | ABCA5 | A001-C-014 | Human | Colorectum | FAP | 2.10e-05 | -7.88e-02 | 0.0135 |
| Page: 1 2 3 4 5 6 |
| Tissue | Expression Dynamics | Abbreviation |
| Colorectum (GSE201348) |  | FAP: Familial adenomatous polyposis |
| CRC: Colorectal cancer | ||
| Colorectum (HTA11) |  | AD: Adenomas |
| SER: Sessile serrated lesions | ||
| MSI-H: Microsatellite-high colorectal cancer | ||
| MSS: Microsatellite stable colorectal cancer | ||
| Esophagus | 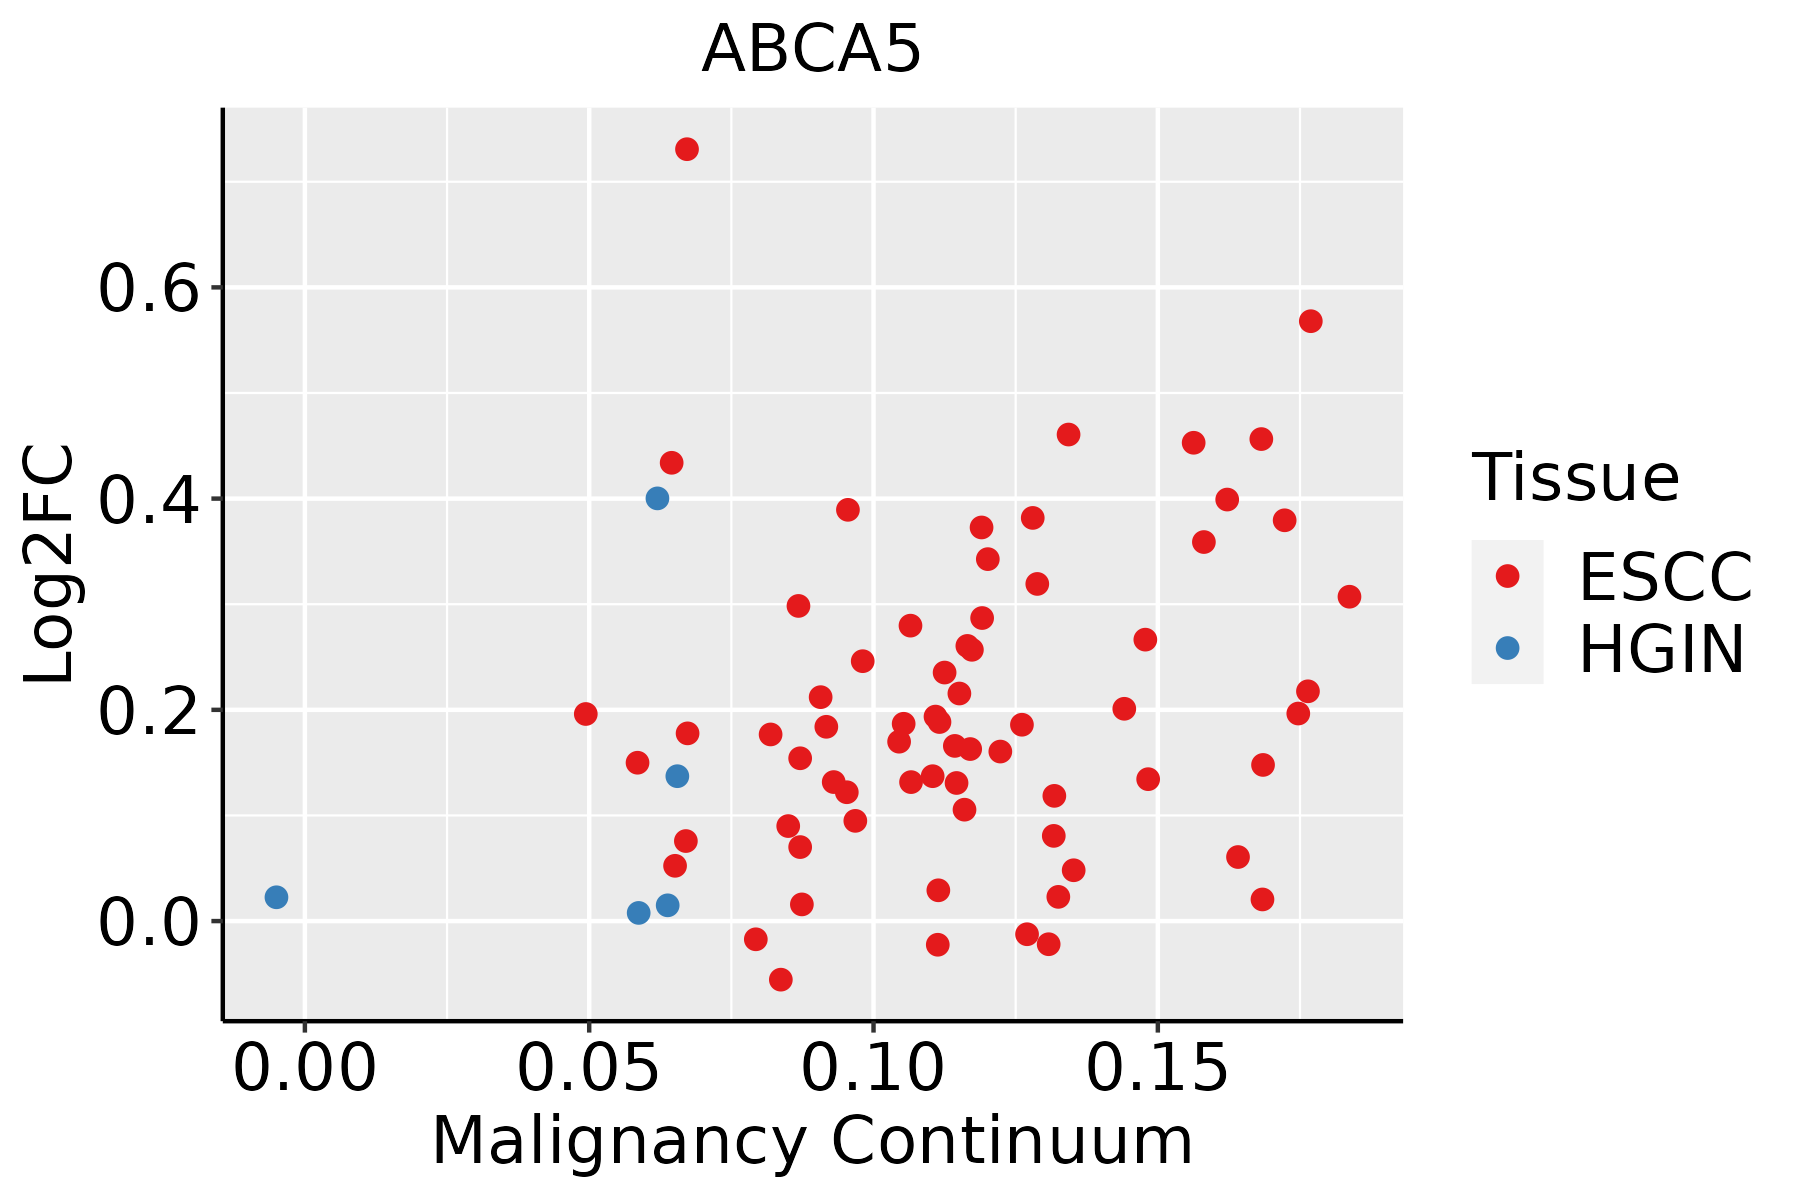 | ESCC: Esophageal squamous cell carcinoma |
| HGIN: High-grade intraepithelial neoplasias | ||
| LGIN: Low-grade intraepithelial neoplasias | ||
| Liver |  | HCC: Hepatocellular carcinoma |
| NAFLD: Non-alcoholic fatty liver disease | ||
| Lung | 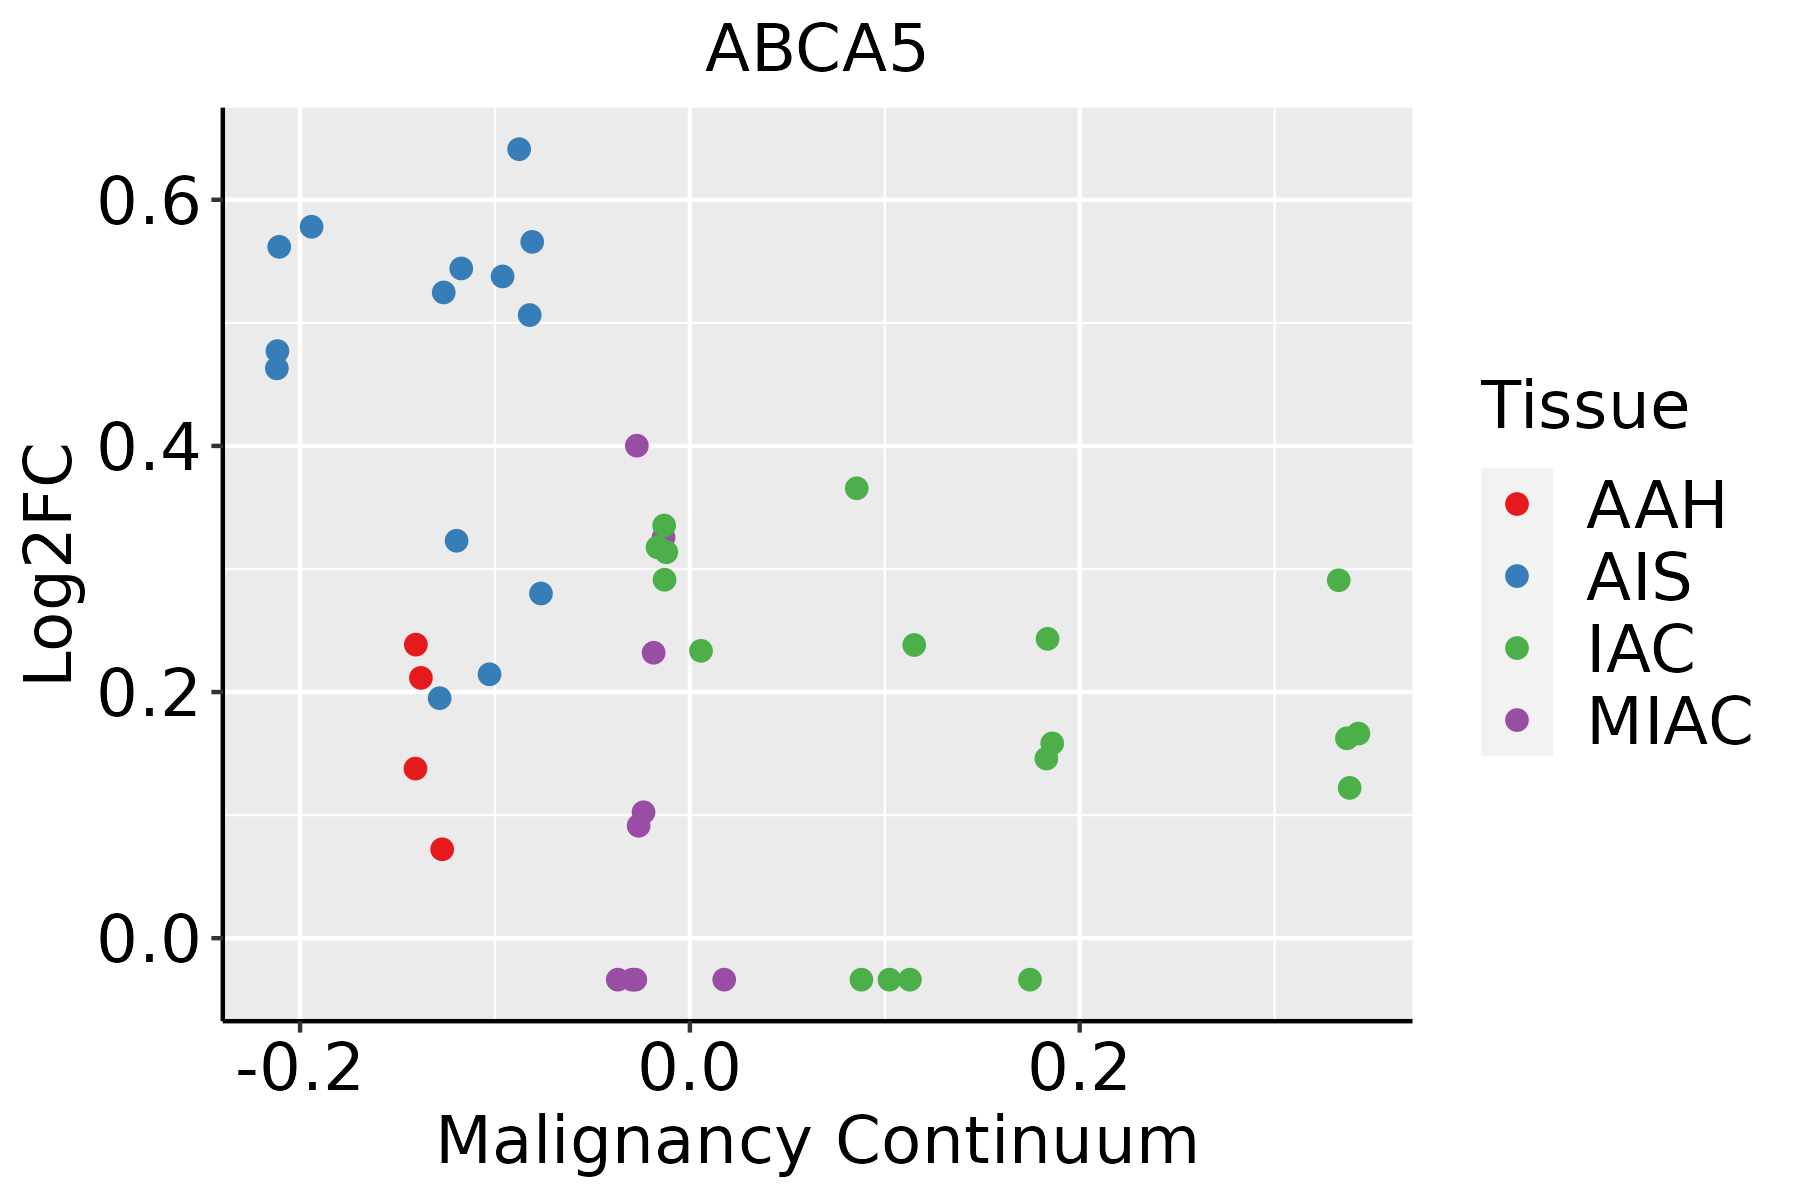 | AAH: Atypical adenomatous hyperplasia |
| AIS: Adenocarcinoma in situ | ||
| IAC: Invasive lung adenocarcinoma | ||
| MIA: Minimally invasive adenocarcinoma | ||
| Thyroid | 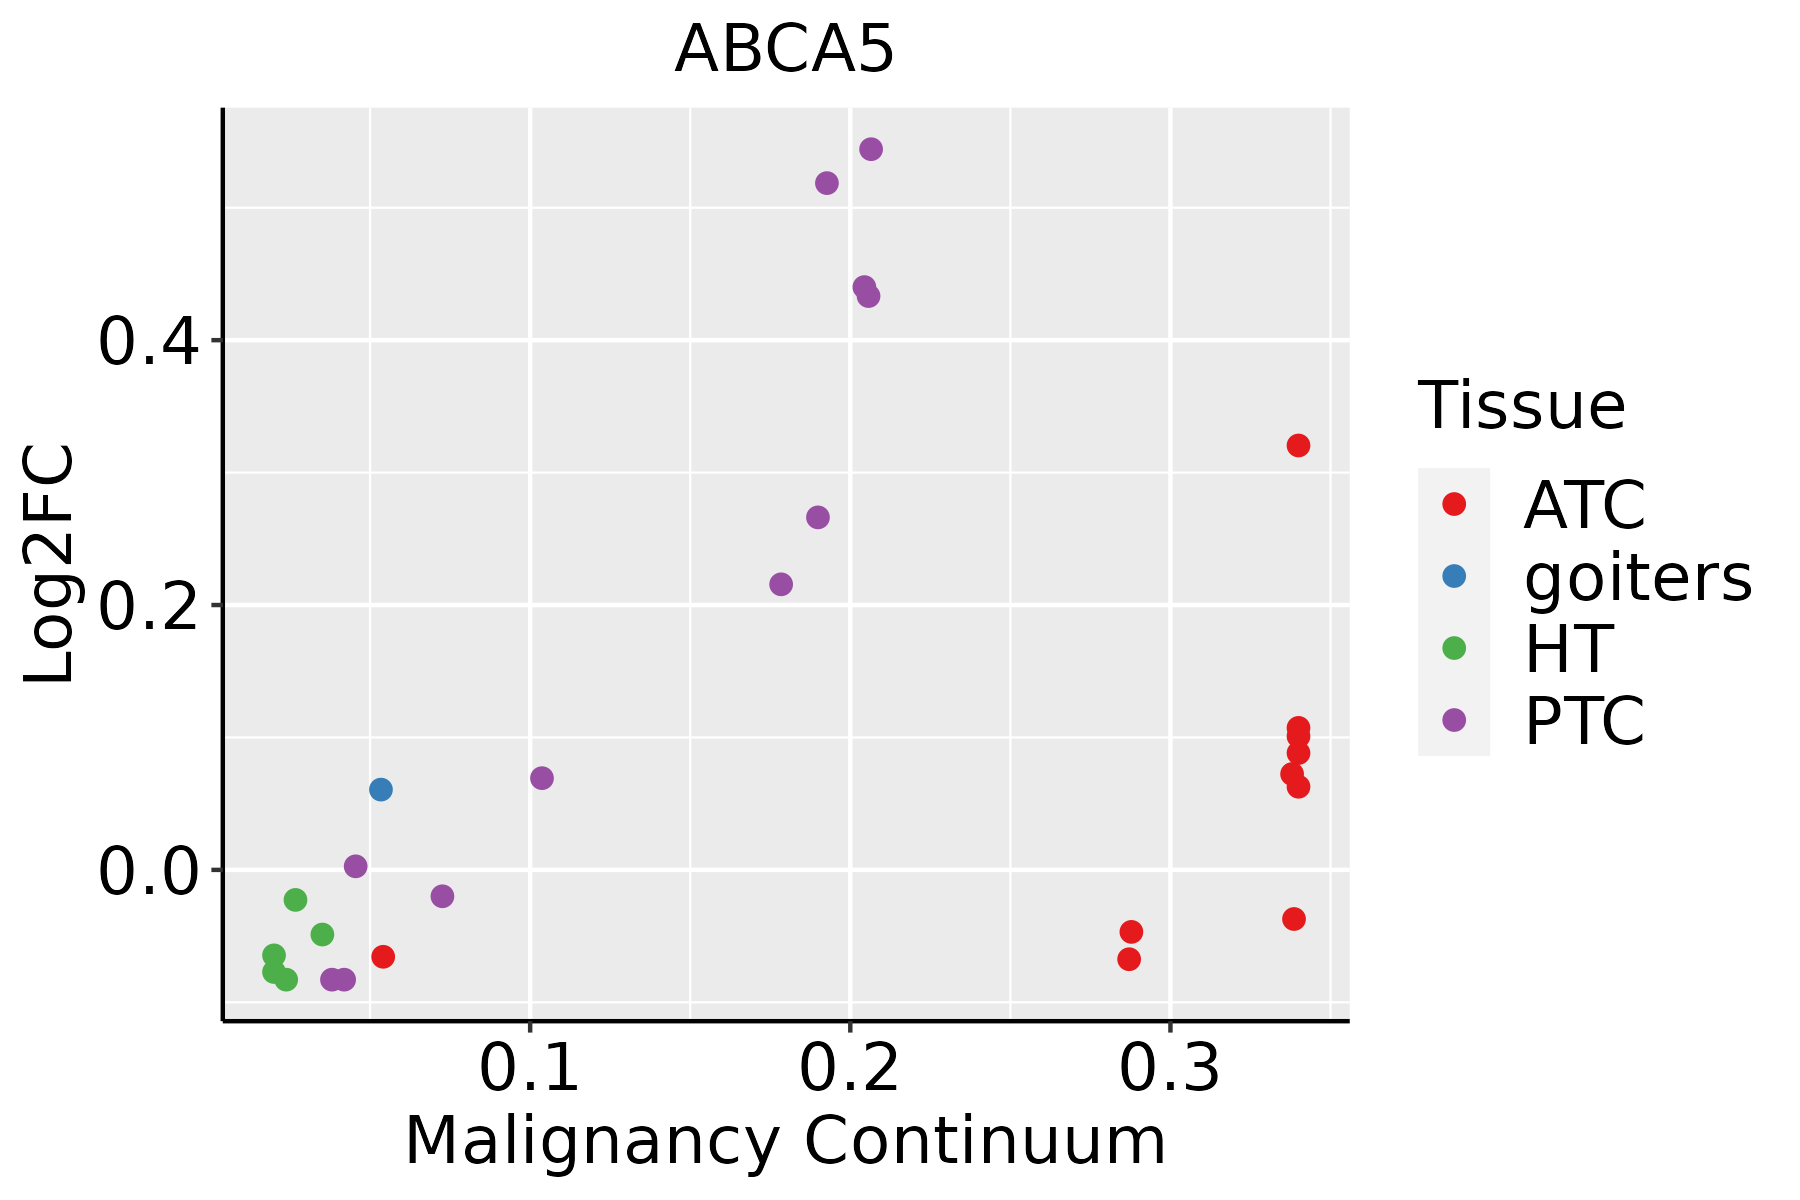 | ATC: Anaplastic thyroid cancer |
| HT: Hashimoto's thyroiditis | ||
| PTC: Papillary thyroid cancer |
| ∗log2FC in expression of this searched gene in stem-like cells from each diseased tissue sample relative to stem-like cells in normal samples in each tissue plotted against the malignancy continuum. Samples are colored based on if they are from different disease stage. |
Top |
Malignant transformation related pathway analysis |
| Find out the enriched GO biological processes and KEGG pathways involved in transition from healthy to precancer to cancer |
| Tissue | Disease Stage | Enriched GO biological Processes |
| Colorectum | AD |  |
| Colorectum | SER |  |
| Colorectum | MSS |  |
| Colorectum | MSI-H |  |
| Colorectum | FAP |  |
| ∗Top 15 enriched GO BP terms are showed in the bar plot of each disease state in each tissue. Each row represents a significant GO biological process which is colored according to the -log10(p.adjust). |
| Page: 1 2 3 4 5 6 7 8 9 |
| GO ID | Tissue | Disease Stage | Description | Gene Ratio | Bg Ratio | pvalue | p.adjust | Count |
| GO:0006066 | Colorectum | AD | alcohol metabolic process | 106/3918 | 353/18723 | 3.02e-05 | 5.57e-04 | 106 |
| GO:0010876 | Colorectum | AD | lipid localization | 120/3918 | 448/18723 | 1.59e-03 | 1.33e-02 | 120 |
| GO:0006869 | Colorectum | AD | lipid transport | 108/3918 | 398/18723 | 1.67e-03 | 1.39e-02 | 108 |
| GO:0008202 | Colorectum | AD | steroid metabolic process | 85/3918 | 319/18723 | 8.07e-03 | 4.75e-02 | 85 |
| GO:00060662 | Colorectum | MSS | alcohol metabolic process | 92/3467 | 353/18723 | 2.57e-04 | 3.46e-03 | 92 |
| GO:00108761 | Colorectum | MSS | lipid localization | 104/3467 | 448/18723 | 6.76e-03 | 4.38e-02 | 104 |
| GO:00068691 | Colorectum | FAP | lipid transport | 81/2622 | 398/18723 | 2.84e-04 | 3.76e-03 | 81 |
| GO:00108762 | Colorectum | FAP | lipid localization | 85/2622 | 448/18723 | 1.92e-03 | 1.63e-02 | 85 |
| GO:00060663 | Colorectum | FAP | alcohol metabolic process | 69/2622 | 353/18723 | 2.29e-03 | 1.85e-02 | 69 |
| GO:00068692 | Colorectum | CRC | lipid transport | 63/2078 | 398/18723 | 2.36e-03 | 2.26e-02 | 63 |
| GO:00060664 | Colorectum | CRC | alcohol metabolic process | 57/2078 | 353/18723 | 2.37e-03 | 2.27e-02 | 57 |
| GO:00108763 | Colorectum | CRC | lipid localization | 68/2078 | 448/18723 | 4.60e-03 | 3.58e-02 | 68 |
| GO:00060668 | Esophagus | ESCC | alcohol metabolic process | 202/8552 | 353/18723 | 7.32e-06 | 7.26e-05 | 202 |
| GO:19026524 | Esophagus | ESCC | secondary alcohol metabolic process | 87/8552 | 147/18723 | 6.58e-04 | 3.50e-03 | 87 |
| GO:00082034 | Esophagus | ESCC | cholesterol metabolic process | 79/8552 | 137/18723 | 3.11e-03 | 1.29e-02 | 79 |
| GO:00161254 | Esophagus | ESCC | sterol metabolic process | 86/8552 | 152/18723 | 4.37e-03 | 1.73e-02 | 86 |
| GO:00082023 | Liver | NAFLD | steroid metabolic process | 69/1882 | 319/18723 | 5.90e-10 | 1.28e-07 | 69 |
| GO:00550883 | Liver | NAFLD | lipid homeostasis | 44/1882 | 167/18723 | 1.48e-09 | 2.54e-07 | 44 |
| GO:00108765 | Liver | NAFLD | lipid localization | 79/1882 | 448/18723 | 4.75e-07 | 2.92e-05 | 79 |
| GO:00303013 | Liver | NAFLD | cholesterol transport | 30/1882 | 117/18723 | 1.08e-06 | 5.40e-05 | 30 |
| Page: 1 2 3 4 5 |
| Pathway ID | Tissue | Disease Stage | Description | Gene Ratio | Bg Ratio | pvalue | p.adjust | qvalue | Count |
| hsa02010 | Liver | NAFLD | ABC transporters | 16/1043 | 45/8465 | 4.97e-05 | 1.16e-03 | 9.37e-04 | 16 |
| hsa020101 | Liver | NAFLD | ABC transporters | 16/1043 | 45/8465 | 4.97e-05 | 1.16e-03 | 9.37e-04 | 16 |
| hsa020102 | Liver | HCC | ABC transporters | 29/4020 | 45/8465 | 1.62e-02 | 3.88e-02 | 2.16e-02 | 29 |
| hsa020103 | Liver | HCC | ABC transporters | 29/4020 | 45/8465 | 1.62e-02 | 3.88e-02 | 2.16e-02 | 29 |
| Page: 1 |
Top |
Cell-cell communication analysis |
| Identification of potential cell-cell interactions between two cell types and their ligand-receptor pairs for different disease states |
| Ligand | Receptor | LRpair | Pathway | Tissue | Disease Stage |
| Page: 1 |
Top |
Single-cell gene regulatory network inference analysis |
| Find out the significant the regulons (TFs) and the target genes of each regulon across cell types for different disease states |
| TF | Cell Type | Tissue | Disease Stage | Target Gene | RSS | Regulon Activity |
| ∗The dot plots of a searched regulon are shown for all cell subpopulations in each disease state of each tissue based on the regulon specific score inferred using pySCENIC and by calculating the average expression. |
| Page: 1 |
Top |
Somatic mutation of malignant transformation related genes |
| Annotation of somatic variants for genes involved in malignant transformation |
| Hugo Symbol | Variant Class | Variant Classification | dbSNP RS | HGVSc | HGVSp | HGVSp Short | SWISSPROT | BIOTYPE | SIFT | PolyPhen | Tumor Sample Barcode | Tissue | Histology | Sex | Age | Stage | Therapy Types | Drugs | Outcome |
| ABCA5 | SNV | Missense_Mutation | novel | c.3905A>G | p.Lys1302Arg | p.K1302R | Q8WWZ7 | protein_coding | tolerated(0.25) | benign(0) | TCGA-A2-A0CO-01 | Breast | breast invasive carcinoma | Female | >=65 | I/II | Hormone Therapy | tamoxiphen | CR |
| ABCA5 | SNV | Missense_Mutation | novel | c.1603N>A | p.Asp535Asn | p.D535N | Q8WWZ7 | protein_coding | tolerated(0.19) | benign(0.152) | TCGA-A2-A0EQ-01 | Breast | breast invasive carcinoma | Female | <65 | I/II | Chemotherapy | adriamycin | SD |
| ABCA5 | SNV | Missense_Mutation | rs369202022 | c.4316N>A | p.Arg1439Gln | p.R1439Q | Q8WWZ7 | protein_coding | deleterious(0) | probably_damaging(0.999) | TCGA-AN-A046-01 | Breast | breast invasive carcinoma | Female | >=65 | I/II | Unknown | Unknown | SD |
| ABCA5 | SNV | Missense_Mutation | novel | c.1436N>A | p.Arg479Lys | p.R479K | Q8WWZ7 | protein_coding | deleterious(0.01) | probably_damaging(0.91) | TCGA-AN-A046-01 | Breast | breast invasive carcinoma | Female | >=65 | I/II | Unknown | Unknown | SD |
| ABCA5 | SNV | Missense_Mutation | c.4715C>T | p.Pro1572Leu | p.P1572L | Q8WWZ7 | protein_coding | deleterious(0) | probably_damaging(0.997) | TCGA-B6-A1KI-01 | Breast | breast invasive carcinoma | Female | <65 | I/II | Unknown | Unknown | SD | |
| ABCA5 | SNV | Missense_Mutation | c.119N>C | p.Leu40Pro | p.L40P | Q8WWZ7 | protein_coding | deleterious(0) | probably_damaging(0.99) | TCGA-BH-A18G-01 | Breast | breast invasive carcinoma | Female | >=65 | I/II | Unknown | Unknown | SD | |
| ABCA5 | SNV | Missense_Mutation | c.2150N>G | p.Tyr717Cys | p.Y717C | Q8WWZ7 | protein_coding | tolerated(0.18) | possibly_damaging(0.619) | TCGA-C8-A12M-01 | Breast | breast invasive carcinoma | Female | >=65 | I/II | Unknown | Unknown | SD | |
| ABCA5 | SNV | Missense_Mutation | c.3053A>G | p.Lys1018Arg | p.K1018R | Q8WWZ7 | protein_coding | tolerated(0.4) | benign(0.007) | TCGA-C8-A1HI-01 | Breast | breast invasive carcinoma | Female | <65 | III/IV | Unknown | Unknown | SD | |
| ABCA5 | SNV | Missense_Mutation | c.1657G>A | p.Glu553Lys | p.E553K | Q8WWZ7 | protein_coding | tolerated(0.06) | possibly_damaging(0.908) | TCGA-C8-A274-01 | Breast | breast invasive carcinoma | Female | <65 | I/II | Hormone Therapy | tamoxiphen | SD | |
| ABCA5 | SNV | Missense_Mutation | novel | c.983G>A | p.Gly328Glu | p.G328E | Q8WWZ7 | protein_coding | deleterious(0.04) | probably_damaging(0.991) | TCGA-D8-A73U-01 | Breast | breast invasive carcinoma | Female | >=65 | I/II | Hormone Therapy | tamoxiphen | SD |
| Page: 1 2 3 4 5 6 7 8 9 10 11 12 13 14 15 16 17 18 19 |
Top |
Related drugs of malignant transformation related genes |
| Identification of chemicals and drugs interact with genes involved in malignant transfromation |
| (DGIdb 4.0) |
| Entrez ID | Symbol | Category | Interaction Types | Drug Claim Name | Drug Name | PMIDs |
| 23461 | ABCA5 | TRANSPORTER, ABC TRANSPORTER, DRUGGABLE GENOME | LIM-0705 | QUERCETIN-3'-O-PHOSPHATE |
| Page: 1 |

Copyright 2023-Present -The University of Texas Health Science Center at Houston |